Nicola Rennie · @nrennie
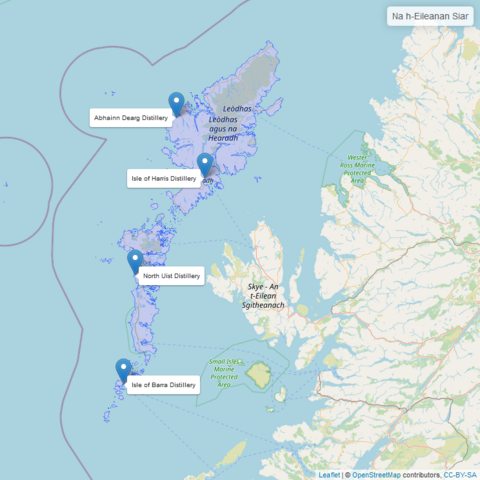
976 followers · 173 posts · Server fosstodon.orgIt's the last day of the #30DayMapChallenge! For the "Remix" theme on #Day30, I've recreated the map I made on day 26 using {leaflet} instead!
Code: https://github.com/nrennie/30DayMapChallenge/blob/main/2022/scripts/30_remix.R
#30DayMapChallenge #Day30 #rstats #15MinuteMaps #mapstodon #dataviz
Nicola Rennie · @nrennie
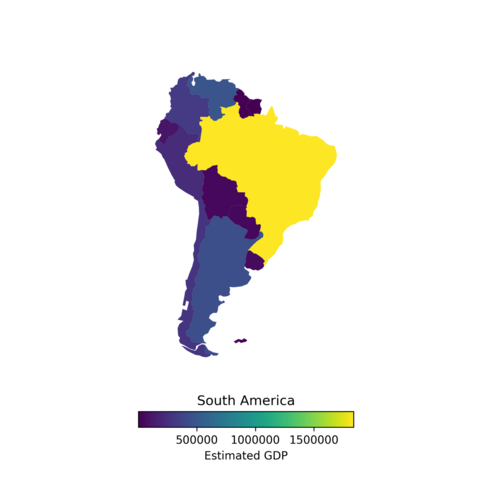
976 followers · 173 posts · Server fosstodon.orgUsing the same data as I did on day 2, I re-created this map of GDP in South America for #Day29 of the #30DayMapChallenge! 🐍🐍🐍 It was interesting to re-make a similar map in #python for a change!
Code: https://github.com/nrennie/30DayMapChallenge/blob/main/2022/scripts/29_comfort_zone.py
#day29 #30DayMapChallenge #python #15MinuteMaps #mapstodon #dataviz
Nicola Rennie · @nrennie
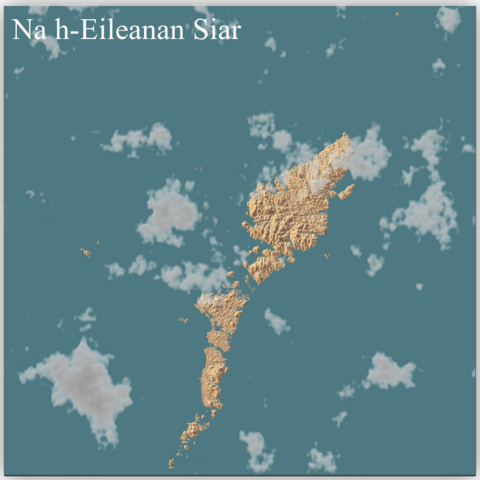
976 followers · 173 posts · Server fosstodon.orgExploring #rayshader in #rstats for the "3D" theme on #Day28 of the #30DayMapChallenge! ☁️☁️☁️I had fun creating layers of cloud cover over the Western Isles for this one!
Code: https://github.com/nrennie/30DayMapChallenge/blob/main/2022/scripts/28_3D.R
#rayshader #rstats #day28 #30DayMapChallenge #15MinuteMaps #mapstodon #dataviz
Nicola Rennie · @nrennie
943 followers · 151 posts · Server fosstodon.orgI re-worked a #TidyTuesday submission from a few weeks ago for the "music" prompt for today's #30DayMapChallenge - looking at radio stations in the USA 🇺🇸
Code: https://github.com/nrennie/30DayMapChallenge/blob/main/2022/scripts/27_music.R
#tidytuesday #30DayMapChallenge #rstats #15MinuteMaps #mapstodon #dataviz #Day27
Nicola Rennie · @nrennie
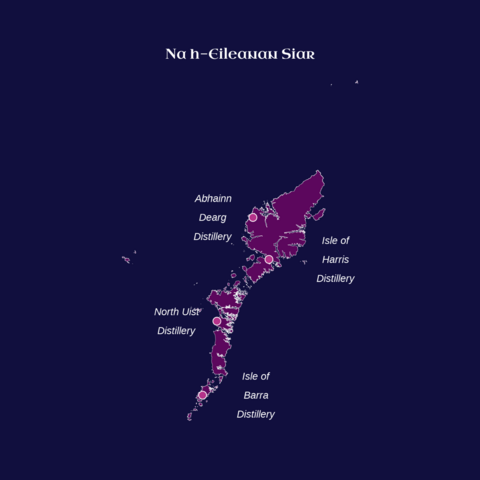
922 followers · 141 posts · Server fosstodon.orgA map of the Western Isles for the "Islands" theme on #Day26 of the #30DayMapChallenge - with a few distillery locations highlighted! 🎨Colours based on the Western Isles tartan! 🏴
Code: https://github.com/nrennie/30DayMapChallenge/blob/main/2022/scripts/26_islands.R
#day26 #30DayMapChallenge #rstats #15MinuteMaps #mapstodon #dataviz
Nicola Rennie · @nrennie
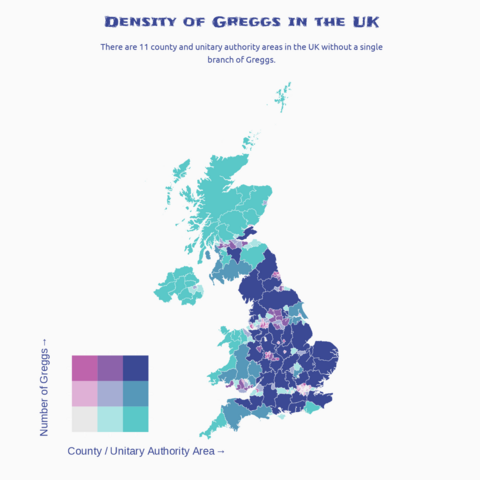
922 followers · 141 posts · Server fosstodon.orgCities in the UK have a much higher density of Greggs per area than rural areas - shown using the {biscale} #rstats package in this map for the "Two Colours" theme!
Code: https://github.com/nrennie/30DayMapChallenge/blob/main/2022/scripts/25_two_colours.R
#rstats #15MinuteMaps #mapstodon #dataviz
Nicola Rennie · @nrennie
922 followers · 141 posts · Server fosstodon.orgA map of Middle Earth for the "fantasy" theme on #Day24 of the #30DayMapChallenge! 🌲
Code: https://github.com/nrennie/30DayMapChallenge/blob/main/2022/scripts/24_fantasy.R
#day24 #30DayMapChallenge #rstats #15MinuteMaps #mapstodon #dataviz
Nicola Rennie · @nrennie
922 followers · 141 posts · Server fosstodon.orgI used the {rStrava} #rstats package to grab my own data for the "movement" theme on #Day23 of the #30DayMapChallenge! 🏃♀️🏃♀️🏃♀️ Here's an animated gif of my Great North Run data from this year!
Code: https://github.com/nrennie/30DayMapChallenge/blob/main/2022/scripts/23_movement.R
#rstats #day23 #30DayMapChallenge #15MinuteMaps #mapstodon #dataviz #greatnorthrun
Nicola Rennie · @nrennie
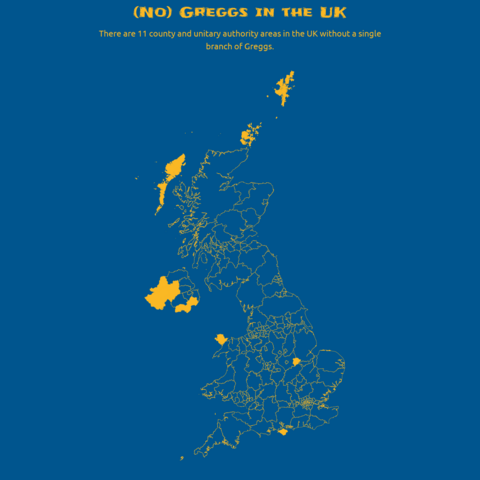
922 followers · 141 posts · Server fosstodon.orgRevisiting the Greggs data once again for the "NULL" theme on #Day22 of the #30DayMapChallenge - identifying council and unitary authority areas with no branches of Greggs!
Code: https://github.com/nrennie/30DayMapChallenge/blob/main/2022/scripts/22_null.R
#day22 #30DayMapChallenge #rstats #15MinuteMaps #mapstodon #dataviz
Nicola Rennie · @nrennie
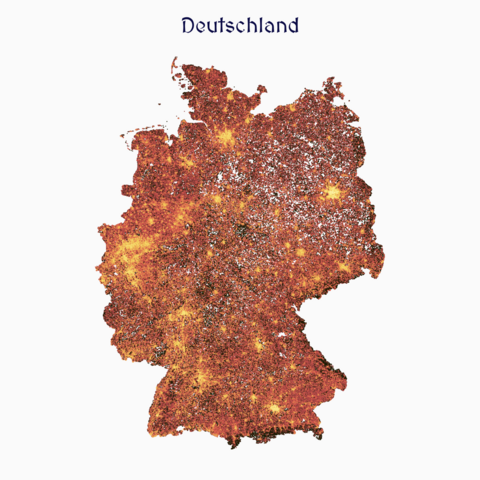
922 followers · 141 posts · Server fosstodon.orgUsing the Kontur population data for #Day21 of the #30DayMapChallenge and looking at the population of Germany 🇩🇪 🇩🇪 🇩🇪
Code: https://github.com/nrennie/30DayMapChallenge/blob/main/2022/scripts/21_kontur.R
#day21 #30DayMapChallenge #rstats #15MinuteMaps #mapstodon #dataviz
Nicola Rennie · @nrennie
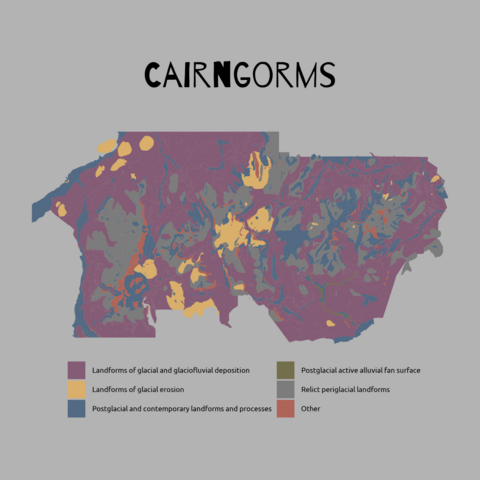
922 followers · 141 posts · Server fosstodon.orgFor the "My Favourite..." theme on #Day20 of the #30DayMapChallenge, I mapped out the land in my favourite mountain range - the Cairngorms!
Code: https://github.com/nrennie/30DayMapChallenge/blob/main/2022/scripts/20_favourite.R
#day20 #30DayMapChallenge #rstats #15MinuteMaps #mapstodon #dataviz
Nicola Rennie · @nrennie
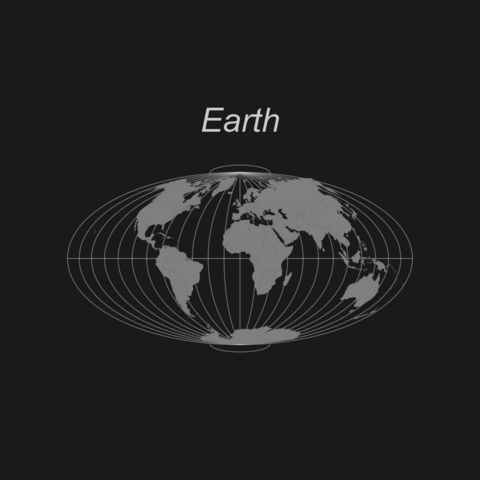
922 followers · 141 posts · Server fosstodon.orgCatching up on some #30DayMapChallenge posts from the last few days - a couple of different projections for the "globe" theme from #Day19!
Code: https://github.com/nrennie/30DayMapChallenge/blob/main/2022/scripts/19_globe.R
#30DayMapChallenge #day19 #rstats #15MinuteMaps #dataviz #mapstodon
Nicola Rennie · @nrennie
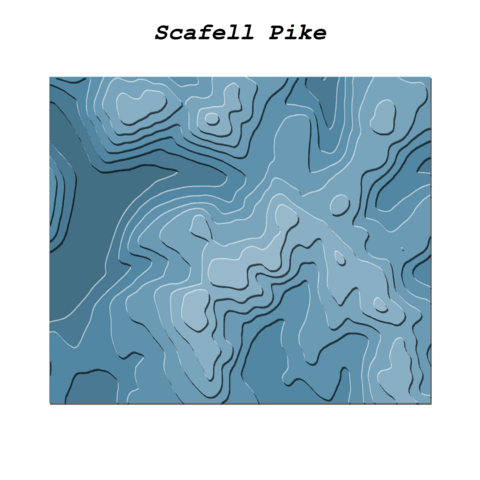
841 followers · 110 posts · Server fosstodon.orgI tried out the {tanaka} #rstats package for the first time today for the "blue" prompt on #Day18 of the #30DayMapChallenge!
Code: https://github.com/nrennie/30DayMapChallenge/blob/main/2022/scripts/18_blue.R
#rstats #day18 #30DayMapChallenge #15MinuteMaps #dataviz #mapstodon
Nicola Rennie · @nrennie
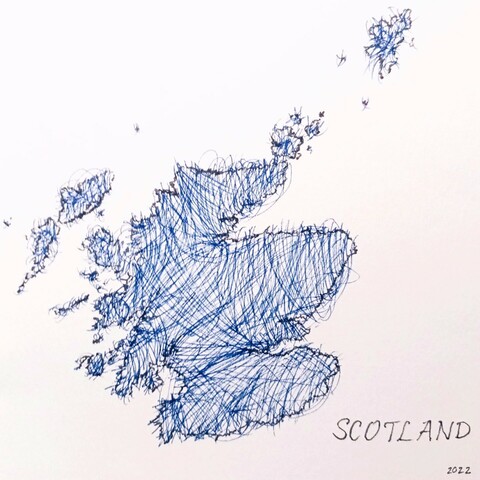
841 followers · 110 posts · Server fosstodon.orgIt's #Day17 of the #30DayMapChallenge and for the "Map without a computer" theme today, I tried to recreate the map I made on Day 2 using a biro ✍️✍️✍️
#day17 #30DayMapChallenge #15MinuteMaps #mapstodon #drawing #datavisualisation
Nicola Rennie · @nrennie
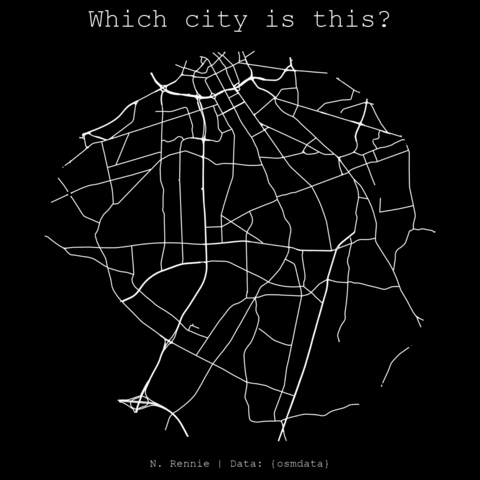
841 followers · 110 posts · Server fosstodon.orgFor the "minimal" prompt on #Day16 of the #30DayMapChallenge, can you guess which city this is just from the road network around it?
Code: https://github.com/nrennie/30DayMapChallenge/blob/main/2022/scripts/16_minimal.R
#RStats #15MinuteMaps #DataViz #DataVisualisation #DataVizualisation #Mapstodon #Maps
#day16 #30DayMapChallenge #rstats #15MinuteMaps #dataviz #datavisualisation #datavizualisation #mapstodon #maps
Nicola Rennie · @nrennie
639 followers · 73 posts · Server fosstodon.orgHalf way through the #30DayMapChallenge! Obviously going back to the Greggs data for "Food/drink" theme on #Day15! Inspired by Abdoul Madjid (@issa_madjid on Twitter) to map every branch of Greggs connected to its 10 nearest neighbours 🍞
Code: https://github.com/nrennie/30DayMapChallenge/blob/main/2022/scripts/15_food_drink.R
#30DayMapChallenge #day15 #rstats #15MinuteMaps #dataviz #mapstodon #spatial
Nicola Rennie · @nrennie
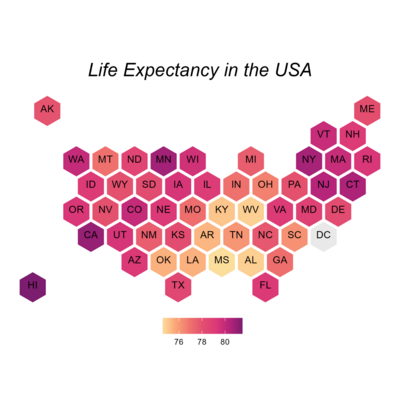
640 followers · 73 posts · Server fosstodon.orgFor the "hexagons" prompt on #Day14 of the #30DayMapChallenge, I looked at life expectancy by US state. 🇺🇸
Code: https://github.com/nrennie/30DayMapChallenge/blob/main/2022/scripts/14_hexagons.R
#day14 #30DayMapChallenge #rstats #15MinuteMaps #dataviz #mapstodon #r4ds
Nicola Rennie · @nrennie
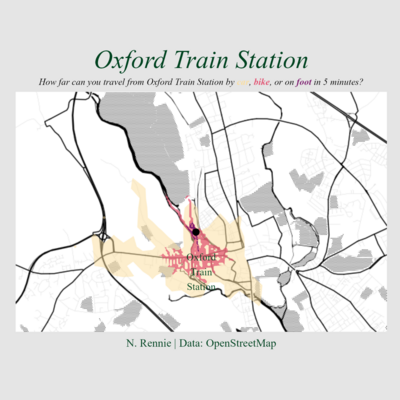
640 followers · 73 posts · Server fosstodon.orgIt's #Day13 of the #30DayMapChallenge and the theme is "5 minutes" - so how far can you get from Oxford Train Station in 5 minutes?
Code: https://github.com/nrennie/30DayMapChallenge/blob/main/2022/scripts/13_five_minutes.R
#RStats #15MinuteMaps #DataViz #Mapstodon #DataVisualisation #DataVizualisation #Spatial
#day13 #30DayMapChallenge #rstats #15MinuteMaps #dataviz #mapstodon #datavisualisation #datavizualisation #spatial
Nicola Rennie · @nrennie
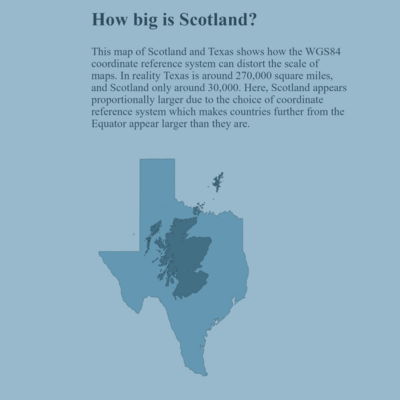
640 followers · 73 posts · Server fosstodon.orgNot super happy with this contribution for #Day12 of the #30DayMapChallenge - for the theme of "scale" I tried to show how a poor choice of projection results in scales that don't make sense!
Code: https://github.com/nrennie/30DayMapChallenge/blob/main/2022/scripts/12_scale.R
#day12 #30DayMapChallenge #rstats #15MinuteMaps #mapstodon #dataviz #spatial #r4ds
Nicola Rennie · @nrennie
640 followers · 73 posts · Server fosstodon.orgFor #Day11 of the #30DayMapChallenge the theme is "red"! 🔴I plotted London bus stops using OpenStreetMap data in #rstats
Code: https://github.com/nrennie/30DayMapChallenge/blob/main/2022/scripts/11_red.R
#Day11 #30DayMapChallenge #rstats #15MinuteMaps #dataviz #mapstodon #datavisualisation #r4ds
