
Christian Gebhard · @basepair
324 followers · 273 posts · Server vis.social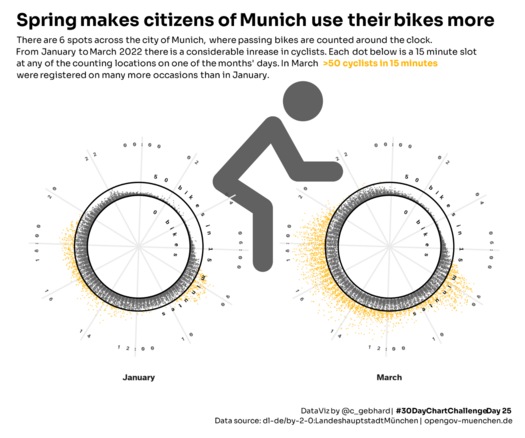
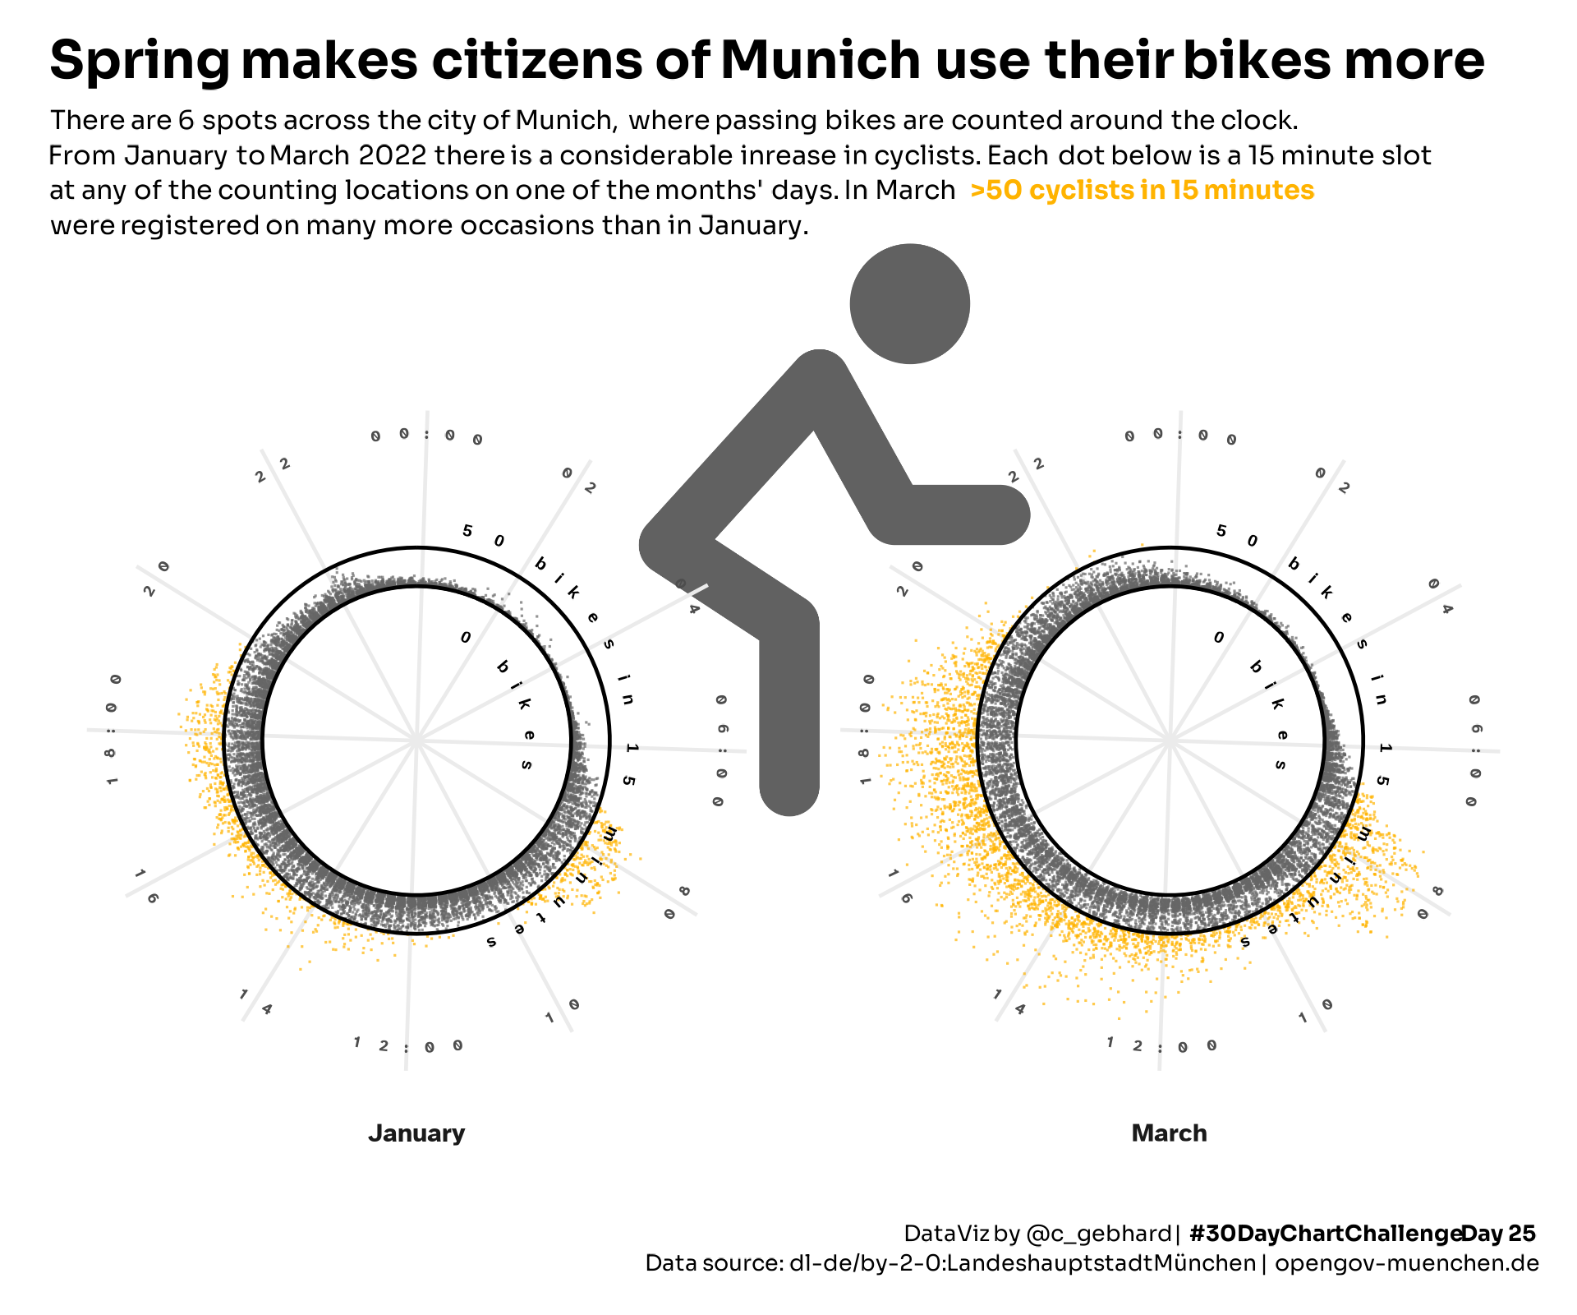
Cyclist counts showed an upward trend in Q1 2022 in Munich (Germany). Considering the seasonal weather improvement, this should be expected.
#30DayChartChallenge #30DCCNov22Reposts #Day25 - Topic: trend
Tool: #rstats
Data: opendata.muenchen.de
Code: https://github.com/nucleic-acid/30DayChartChallenge_2022
#datavis #opendata #cycling #rstats #day25 #30DCCNov22Reposts #30DayChartChallenge
Christian Gebhard · @basepair
324 followers · 268 posts · Server vis.socialCatching up on the #30DCCNov22Reposts . To keep it short, I'll make a 🧵 of the remaining charts.
This will cover #30DayChartChallenge posts created with #rstats. Other topics: #echarts, #TidyTuesday #gapminder, and data by @ourworldindata #datavis #dataviz
#dataviz #datavis #gapminder #TidyTuesday #ECharts #rstats #30DayChartChallenge #30DCCNov22Reposts
Christian Gebhard · @basepair
314 followers · 256 posts · Server vis.social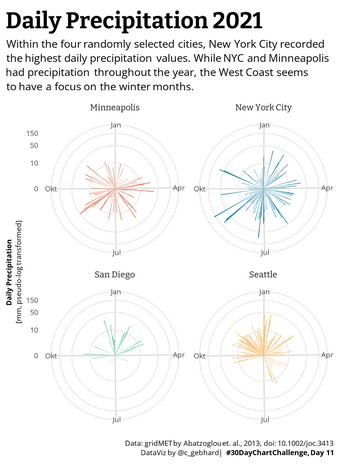
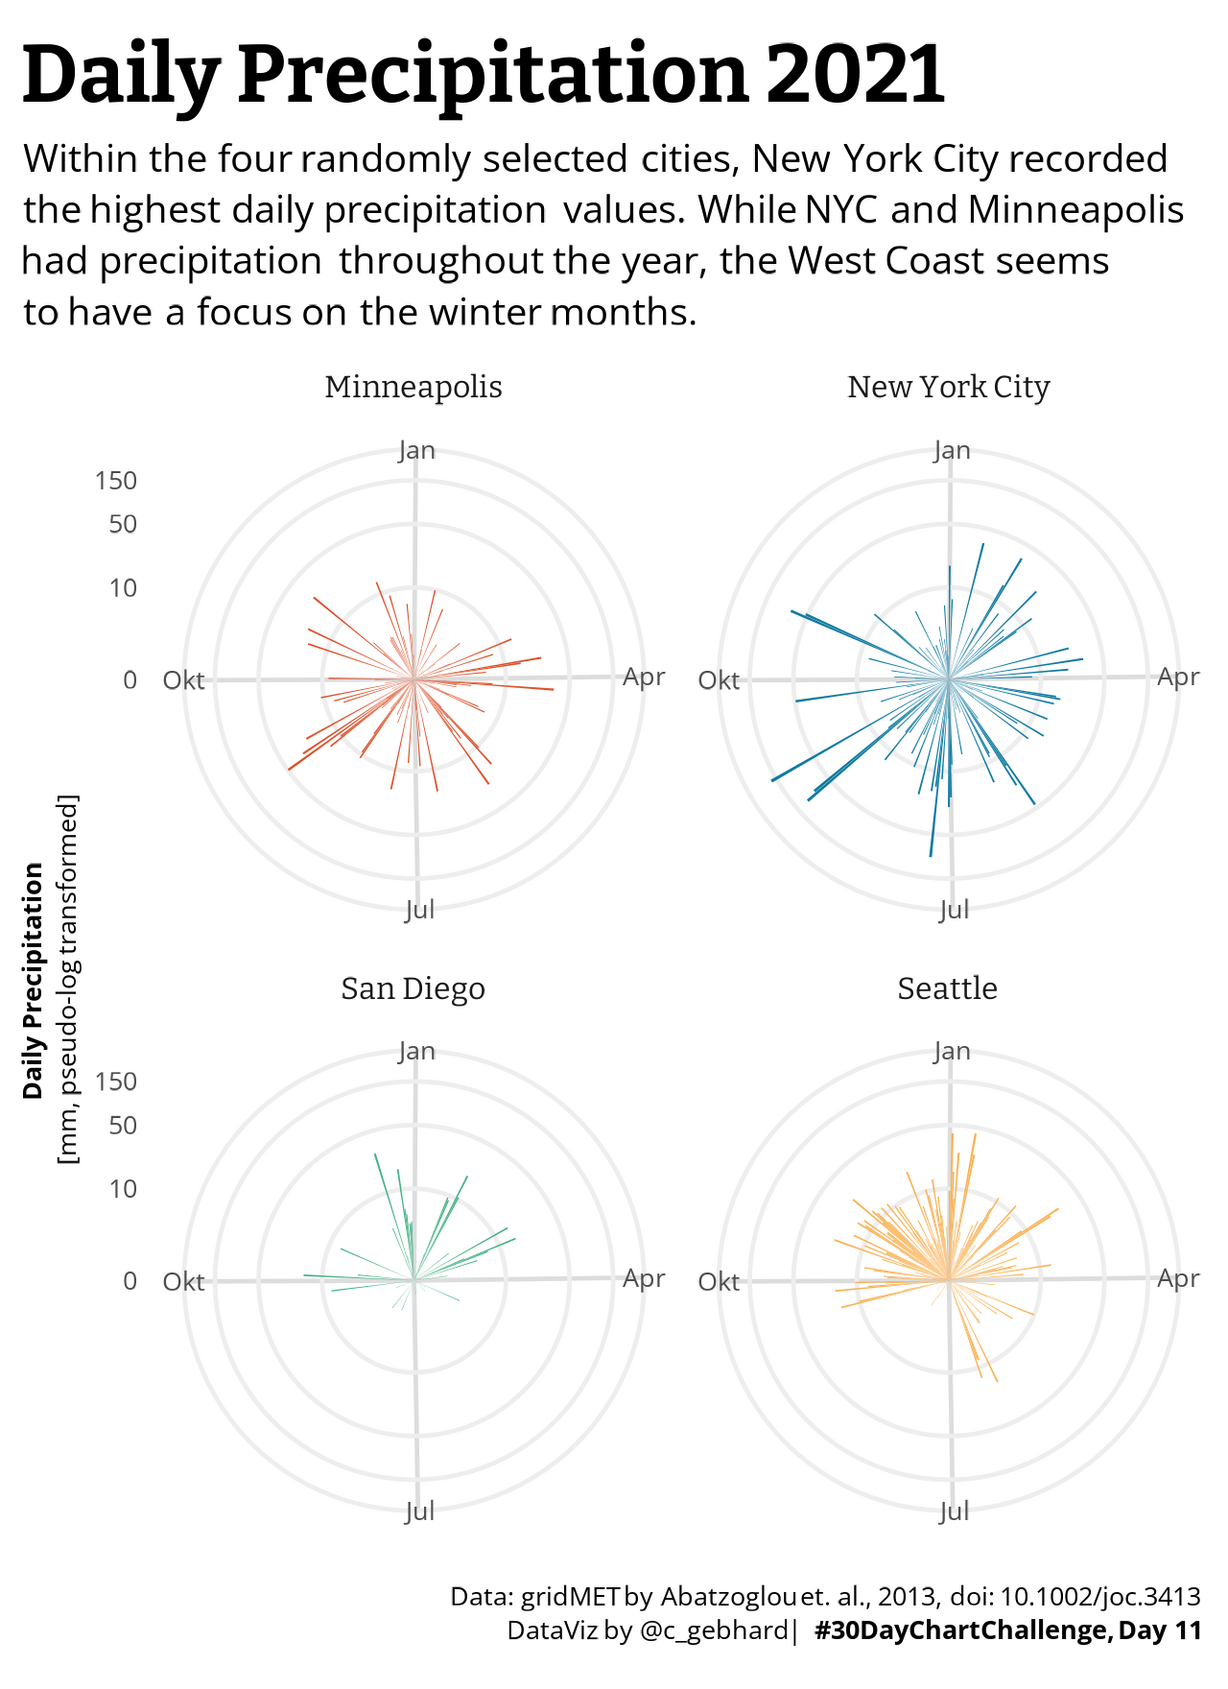
#30DayChartChallenge #30DCCNov22Reposts #Day11 - Topic: circular
Daily precipitation in four north american cities. The cities were chosen at random (this was more of a technical exercise for me).
Tool: #rstats
Data: gridMET by Abatzoglou et. al., 2013, doi: 10.1002/joc.3413 via {climateR} 📦
Color-Scale: MetBrewer
Code: https://github.com/nucleic-acid/30DayChartChallenge_2022
#rain #climate #datavis #rstats #Day11 #30DCCNov22Reposts #30DayChartChallenge
Christian Gebhard · @basepair
314 followers · 256 posts · Server vis.social
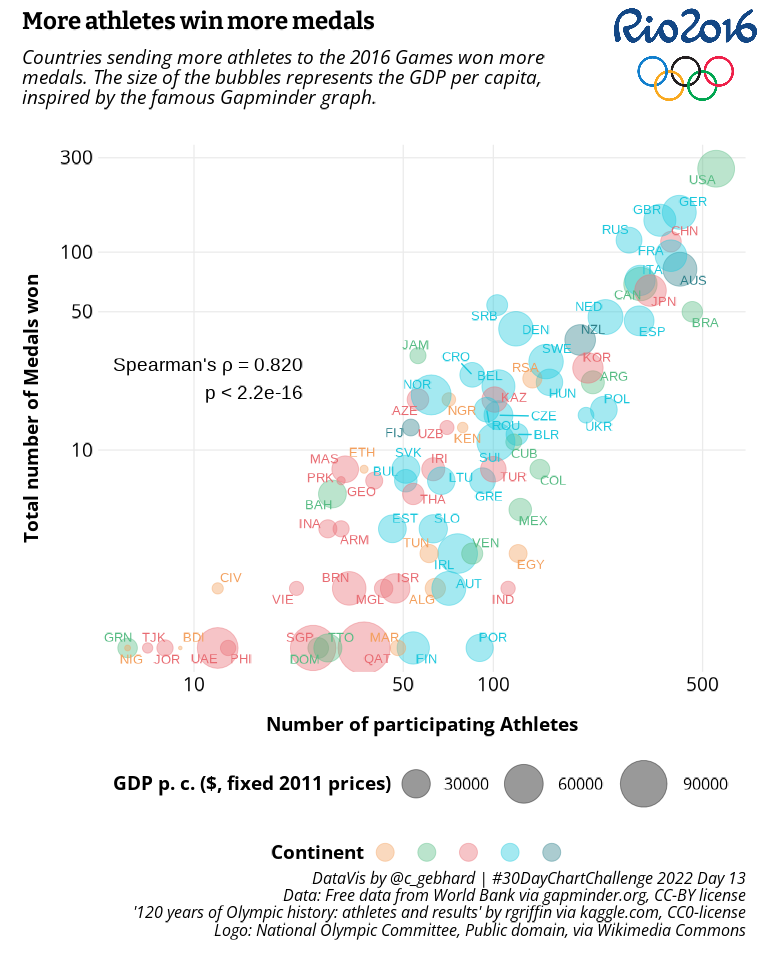
#30DayChartChallenge #30DCCNov22Reposts #Day13 - Topic: correlations
For this day I updated a plot from a while back: correlations at the 2016 Olympic Games.
Inspired by the iconic Hans Rosling plot.
Tool: #rstats
Data: Gapminder, WorldBank, kaggle user rgriffin
Code: https://jollydata.blog/posts/2021-01-01-olympic-history/#bringing-it-all-together
#datavis #dataviz #olympics2016 #olympics #sports #gapminder #WorldBank
#worldbank #gapminder #sports #olympics #olympics2016 #dataviz #datavis #rstats #day13 #30DCCNov22Reposts #30DayChartChallenge
Christian Gebhard · @basepair
314 followers · 256 posts · Server vis.social
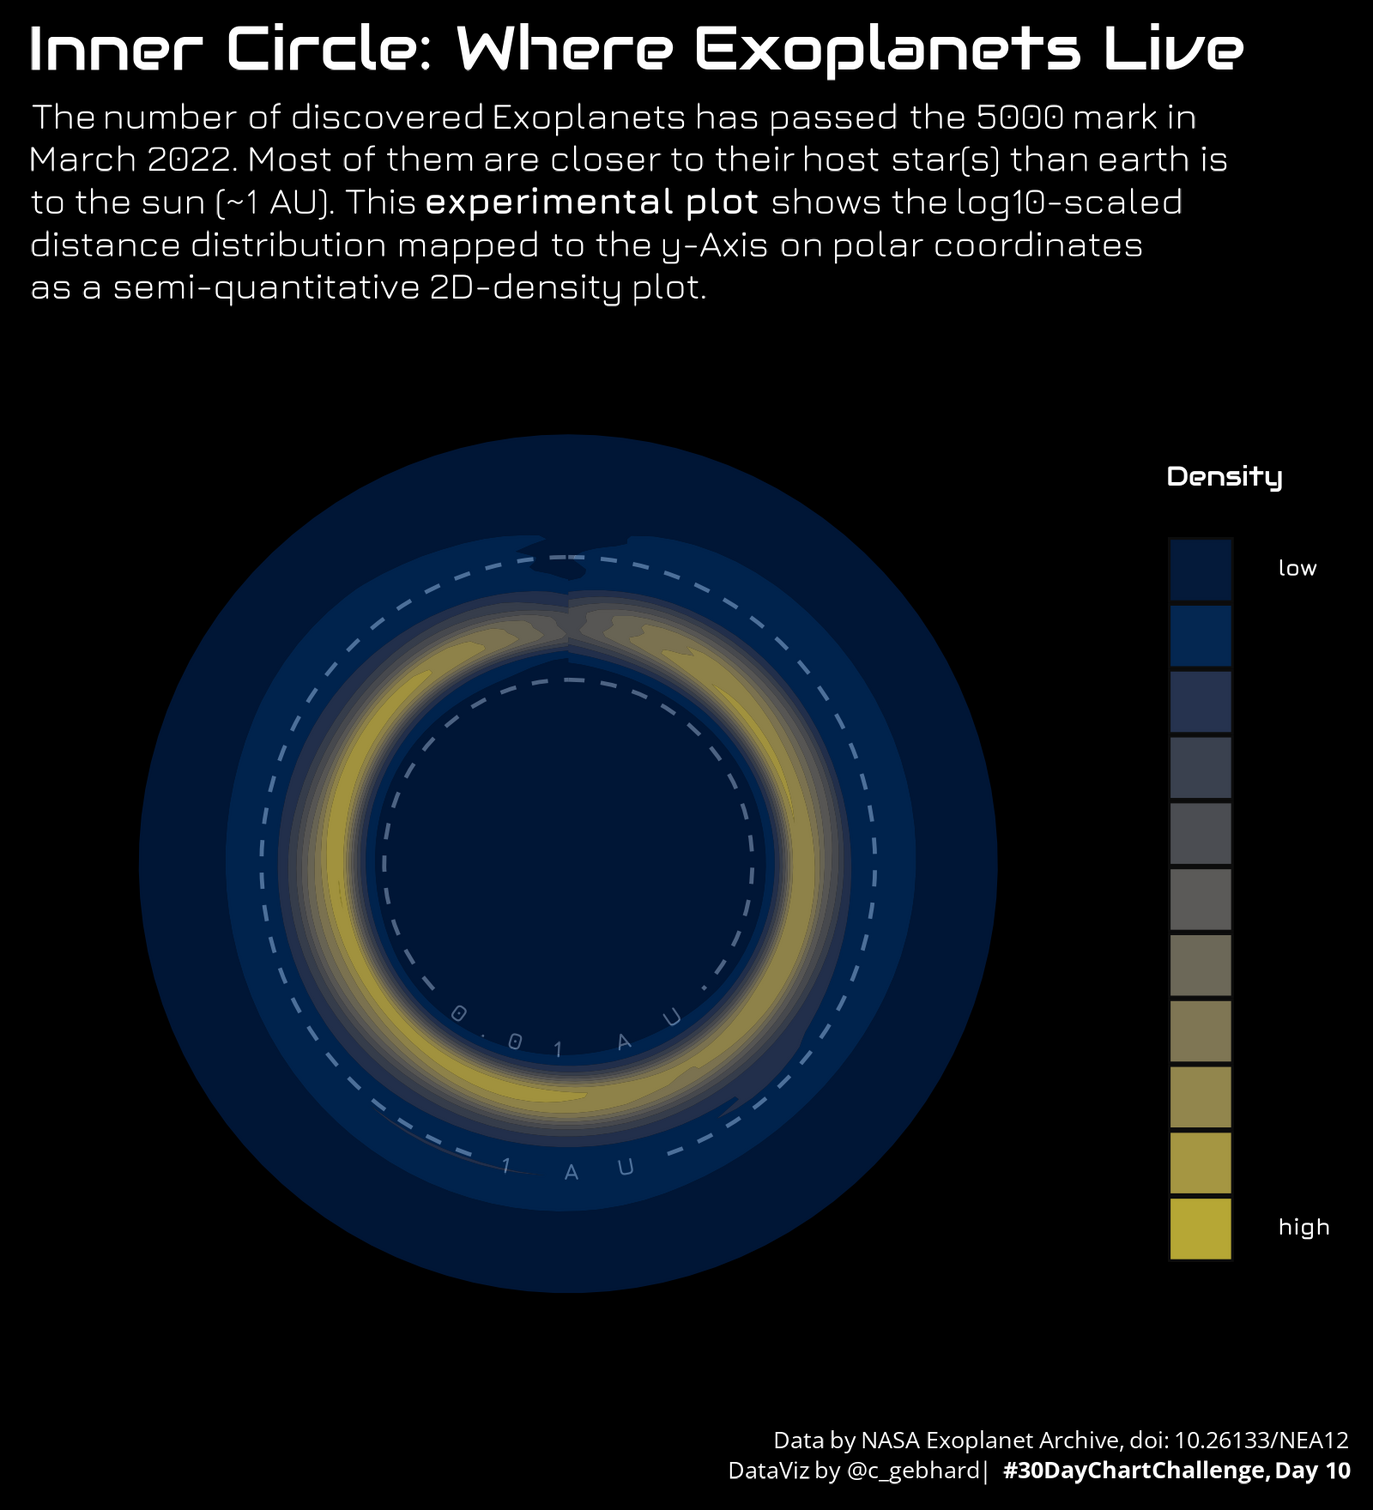
Distance of exoplanets to their host star(s). This plot is experimental & oversimplifies. The struggle was the highly skewed distance distribution, so a log scale was necessary, which conflicts with the assumed center/zero of the circle.
Feedback and critique is very welcome!
If I offended anyone on #astrodon, I apologize in advance.
#30DCCNov22Reposts
Tool: #rstats
Data: NASA Exoplanet Archive, doi: 10.26133/NEA12
Color-Scale: Viridis/E
Fonts: Jura, Audiowide
#30DayChartChallenge #datavis #rstats #30DCCNov22Reposts #Astrodon
Christian Gebhard · @basepair
314 followers · 256 posts · Server vis.social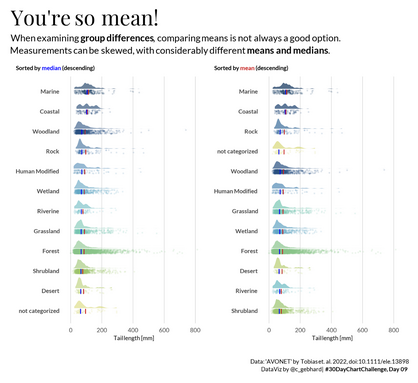
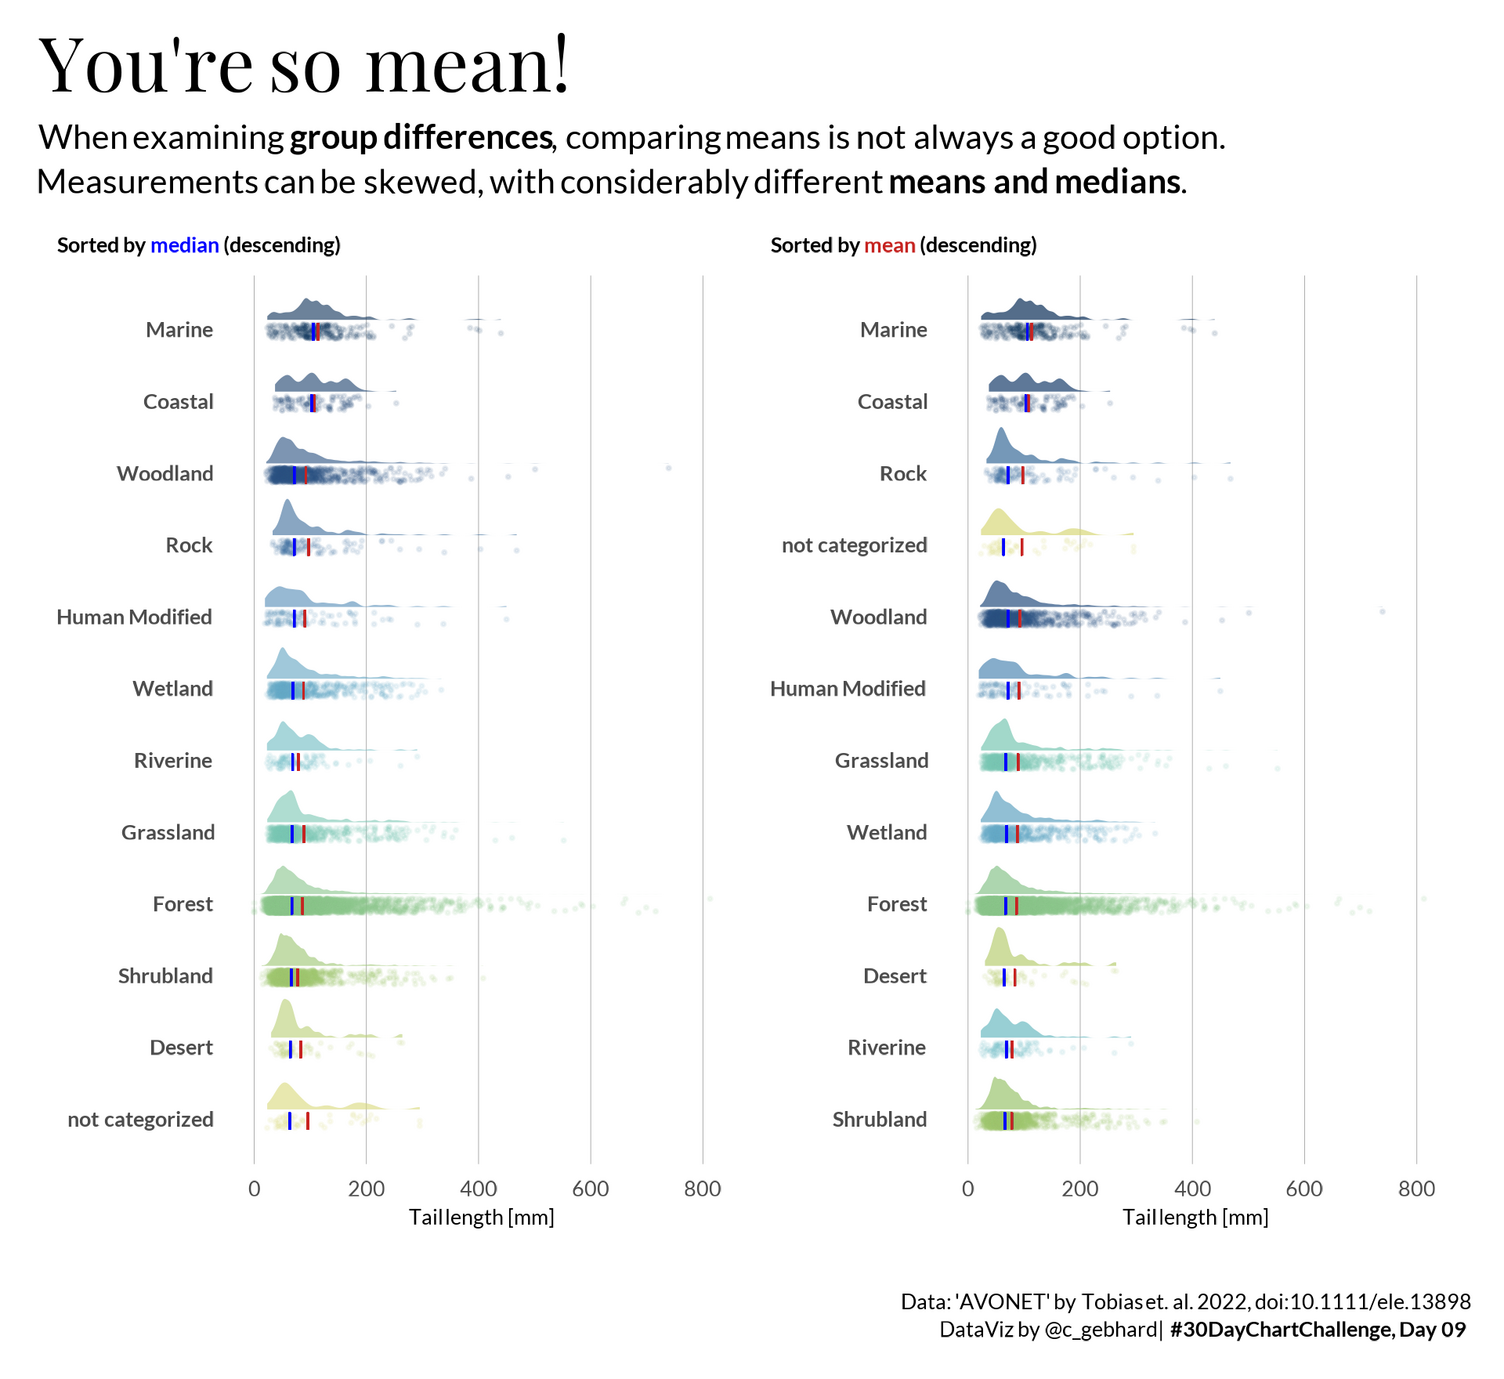
In addition there's #Day9 - Topic: statistics
Same AVONET data, comparing means and medians. Comparing the groups with either parameter makes a considerable difference in ranking.
Tool: #rstats
Data: doi:10.6084/m9.figshare.16586228.v5
Color-Scale: MetBrewer
Fonts: Playfair Display, Lato
Code: https://github.com/nucleic-acid/30DayChartChallenge_2022
#stats #dataviz #30DayChartChallenge #30DCCNov22Reposts #rstats #day9
Christian Gebhard · @basepair
314 followers · 256 posts · Server vis.social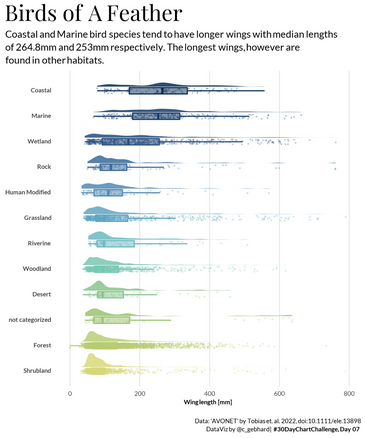
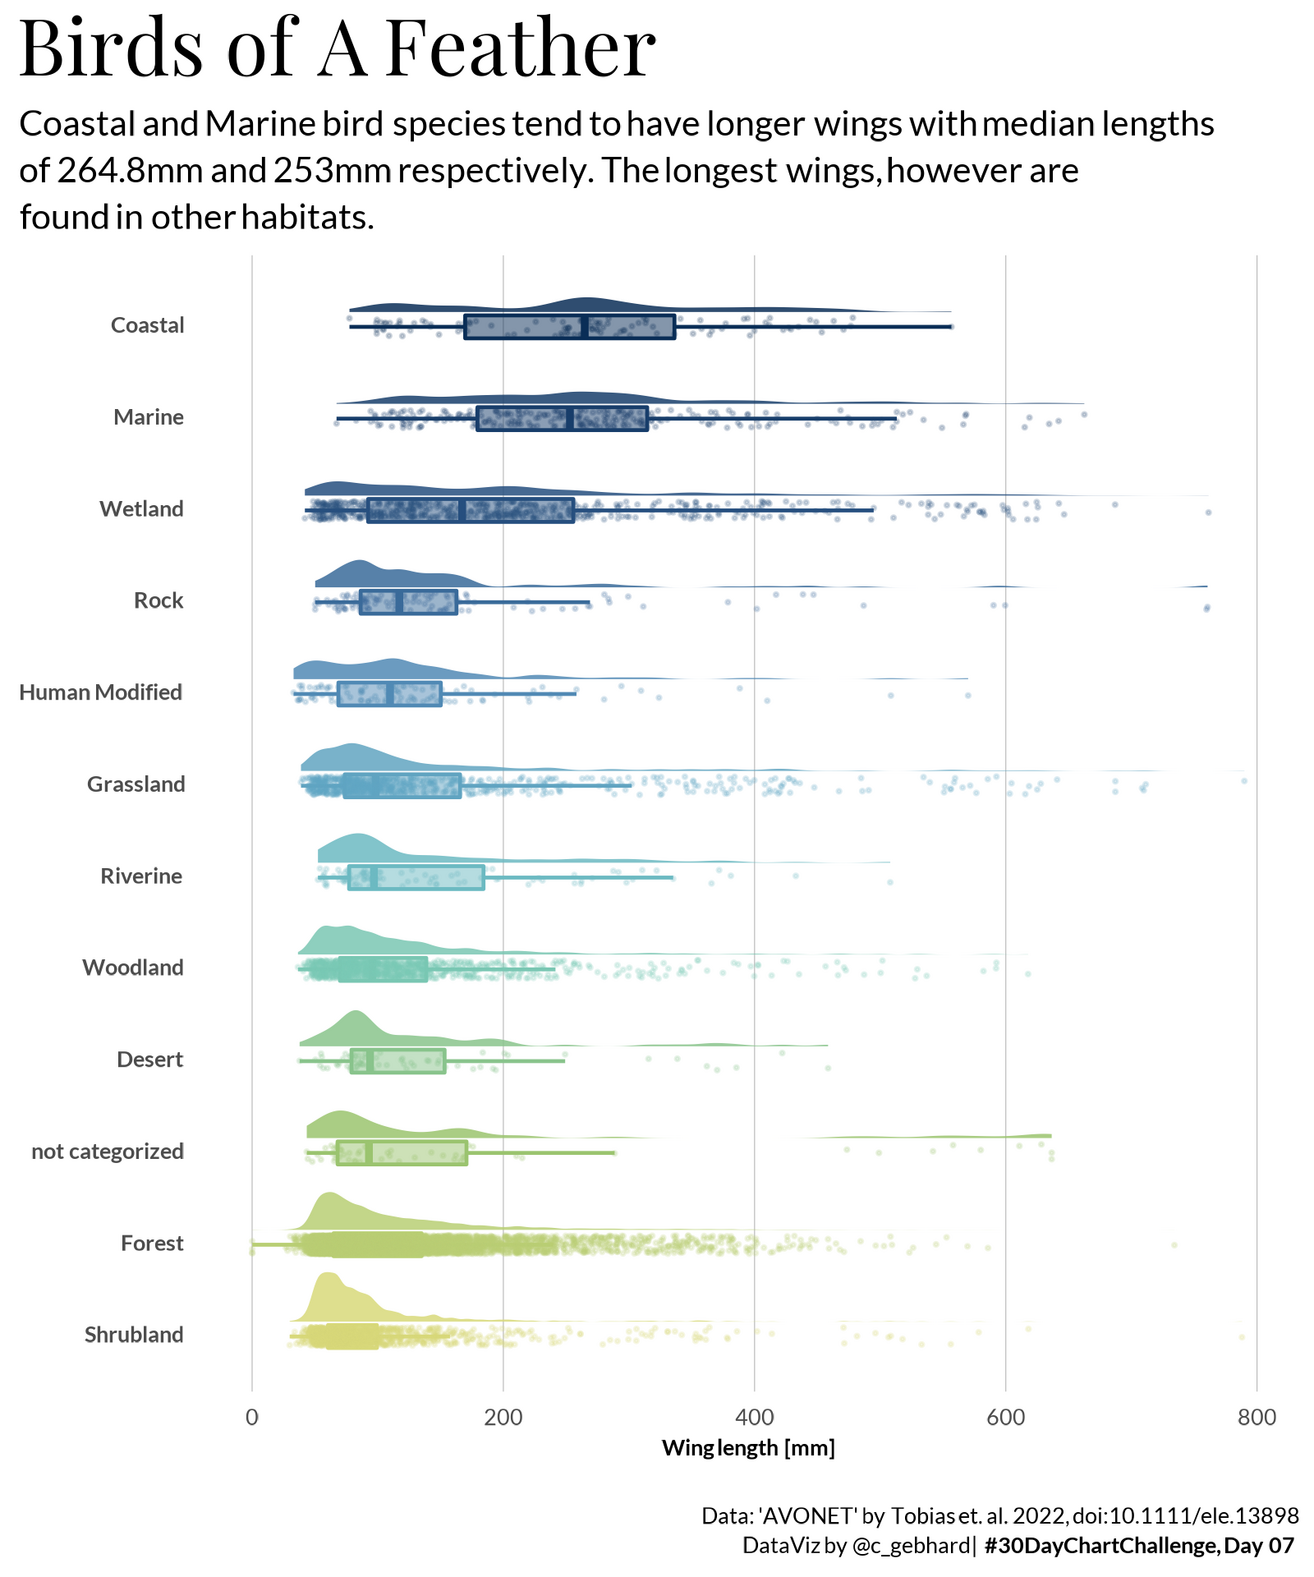
Trying to catch up with #30DCCNov22Reposts #day7
Topic: physical
Physical bird measurements: wing lengths of almost 10k bird species.
Data: AVONET database doi:10.6084/m9.figshare.16586228.v5
Tool: #rstats @rstats
Color-Scale: MetBrewer
Fonts: Playfair Display, Lato
Code: https://github.com/nucleic-acid/30DayChartChallenge_2022
#birds #dataviz #datavis #30DayChartChallenge #rstats #day7 #30DCCNov22Reposts

Lisa DeBruine 🏳️🌈 · @debruine
1583 followers · 182 posts · Server tech.lgbt
Lisa DeBruine 🏳️🌈 · @debruine
1583 followers · 182 posts · Server tech.lgbt
Lisa DeBruine 🏳️🌈 · @debruine
1583 followers · 182 posts · Server tech.lgbt
Christian Gebhard · @basepair
314 followers · 256 posts · Server vis.social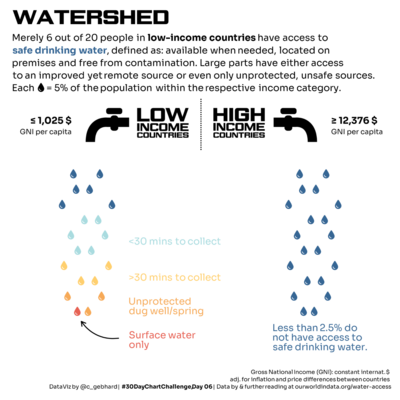
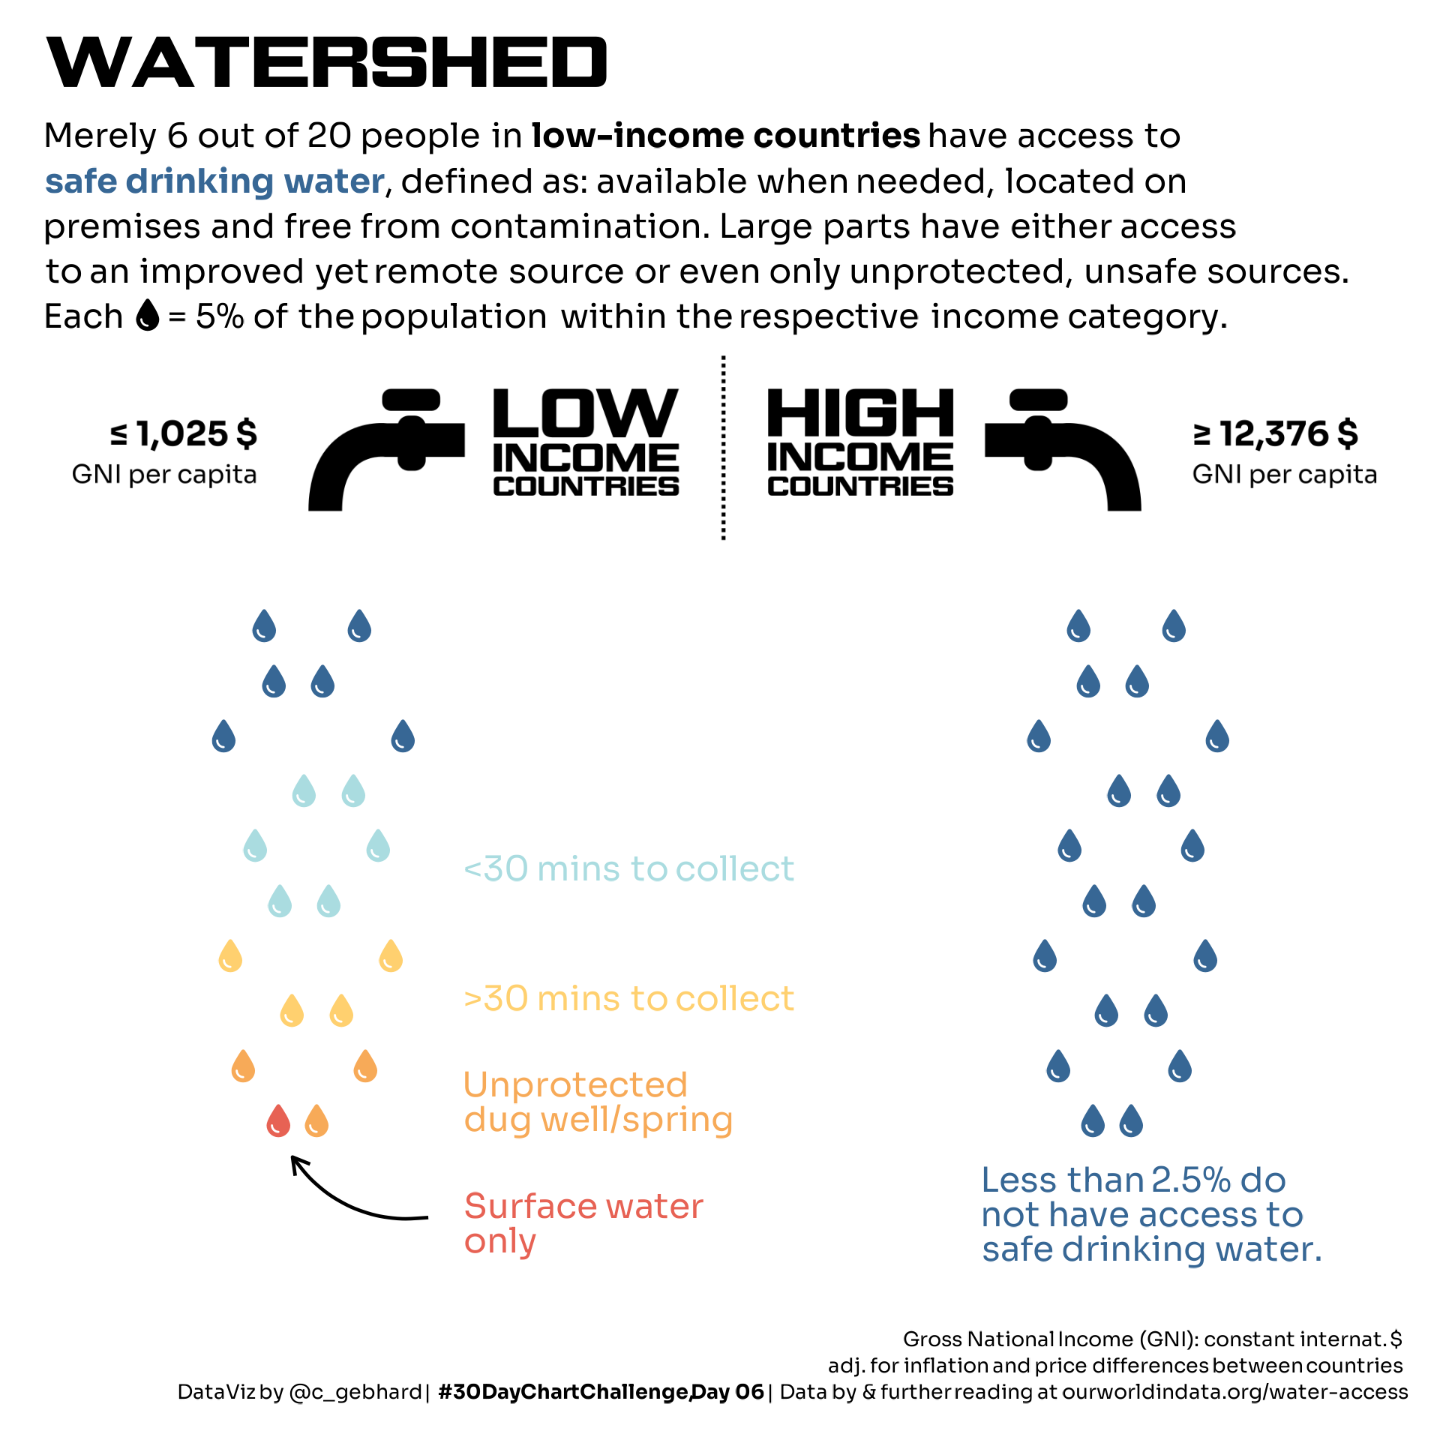
Safe drinking water is essential for good health and one of the #UN #SustainableDevelopmentGoals (SDG 6.1.1).
Not all people have access and there is still a great discrepancy between high- and low-income countries.
#30DayChartChallenge #30DCCNov22Reposts #Day6 - Topic: "data by ourworldindata.org"
Tool: #rstats @rstats Color-Scale: MetBrewer Hiroshige
#fonts : The Neue Black by theleagueofmoveabletype & Sora
Code: https://github.com/nucleic-acid/30DayChartChallenge_2022/tree/main/code
#data #dataviz #datavis #fonts #rstats #day6 #30DCCNov22Reposts #30DayChartChallenge #sustainabledevelopmentgoals #un
Christian Gebhard · @basepair
314 followers · 256 posts · Server vis.social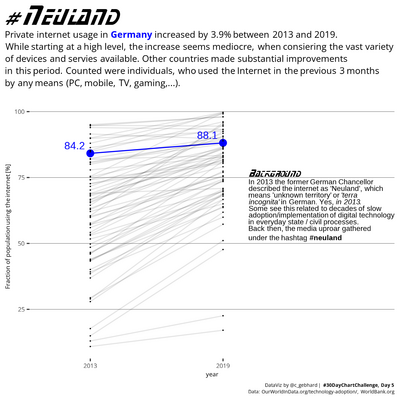
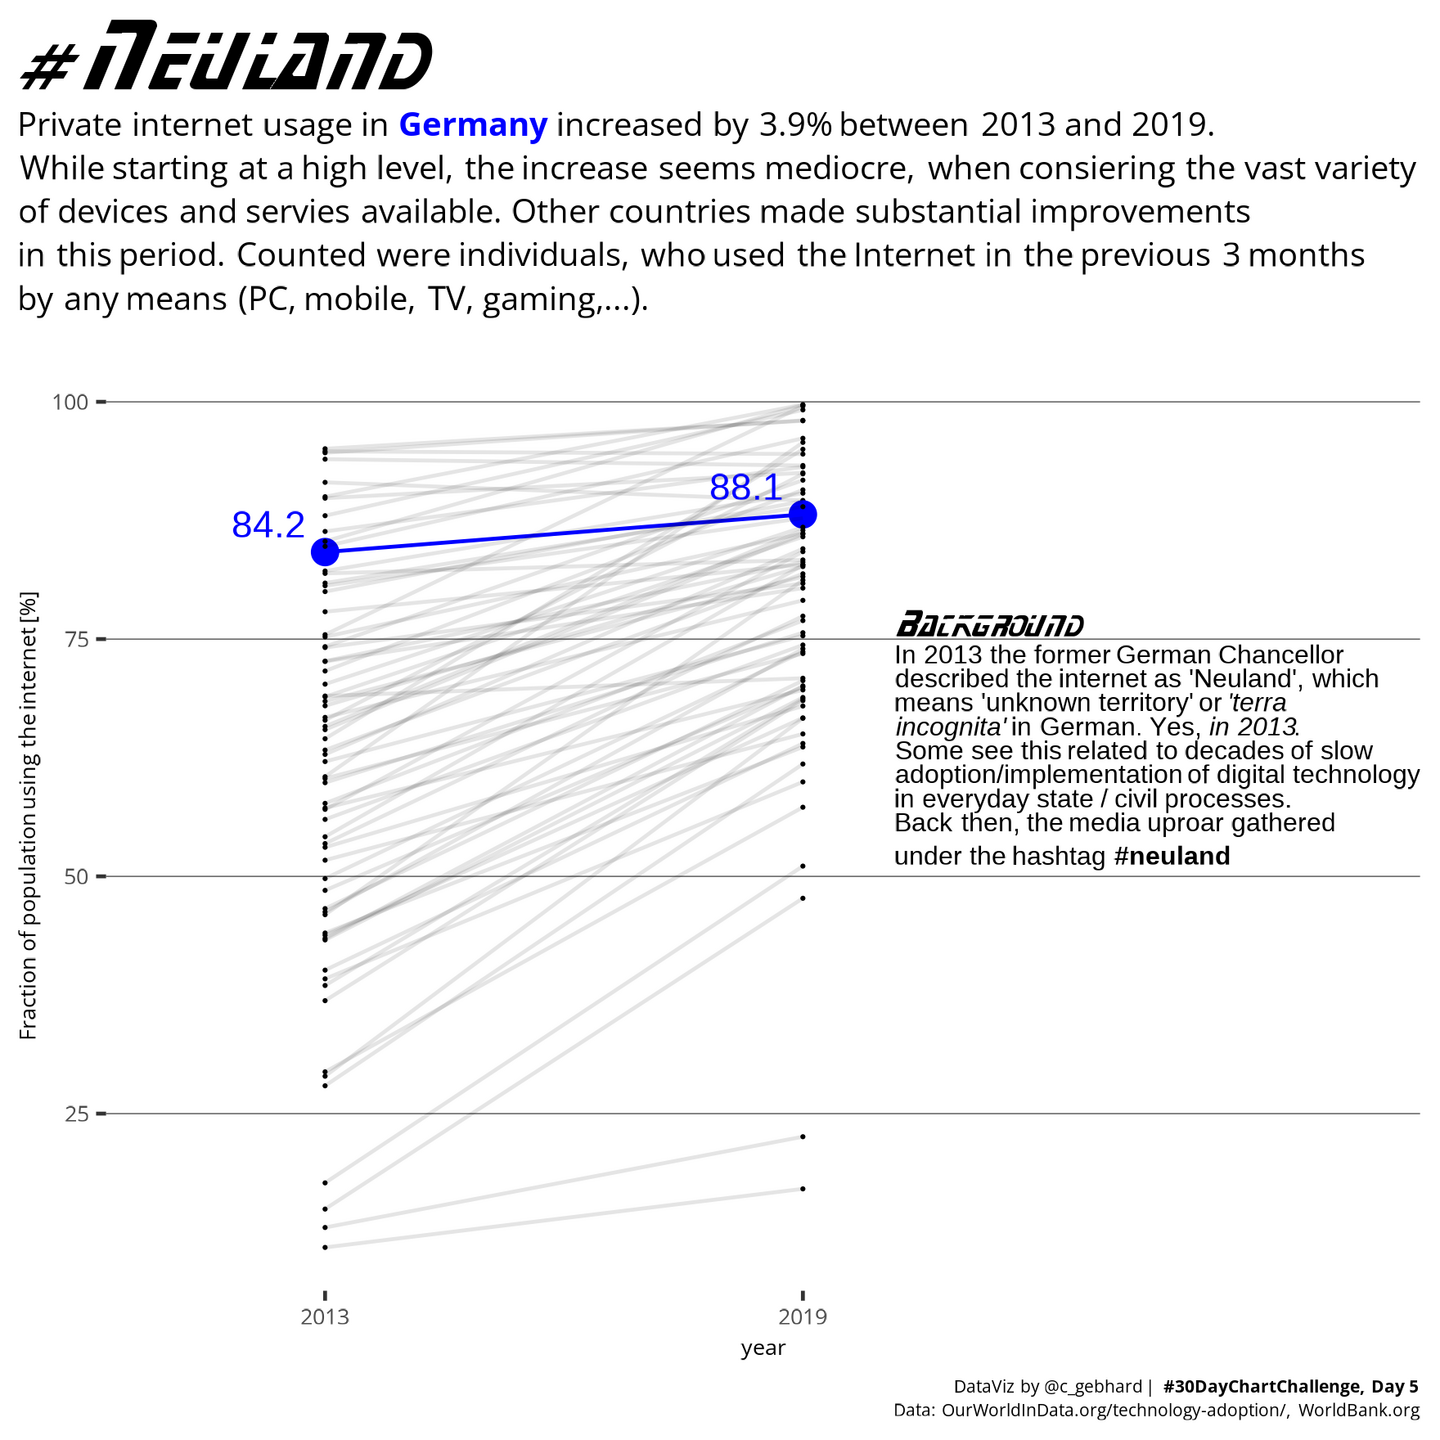
#30DayChartChallenge #30DCCNov22Reposts #Day5- Topic: slope
Data: OWID and WorldBank
Font: StarNext from the {trekfonts 📦}
Tool: #rstats @rstats
Code: https://github.com/nucleic-acid/30DayChartChallenge_2022
#dataviz #datavis #neuland #internet #rstats #day5 #30DCCNov22Reposts #30DayChartChallenge
Lisa DeBruine 🏳️🌈 · @debruine
1583 followers · 182 posts · Server tech.lgbt@MattCrump @rstats Cool. I am just pinning interesting hashtags in Toot! So far I’ve pinned #rstats #OpenScience* #30DayMapChallenge and #30DCCNov22Reposts
*please use camel case on hashtags so screen readers don’t mangle them
#rstats #openscience #30DayMapChallenge #30DCCNov22Reposts
Christian Gebhard · @basepair
314 followers · 256 posts · Server vis.social
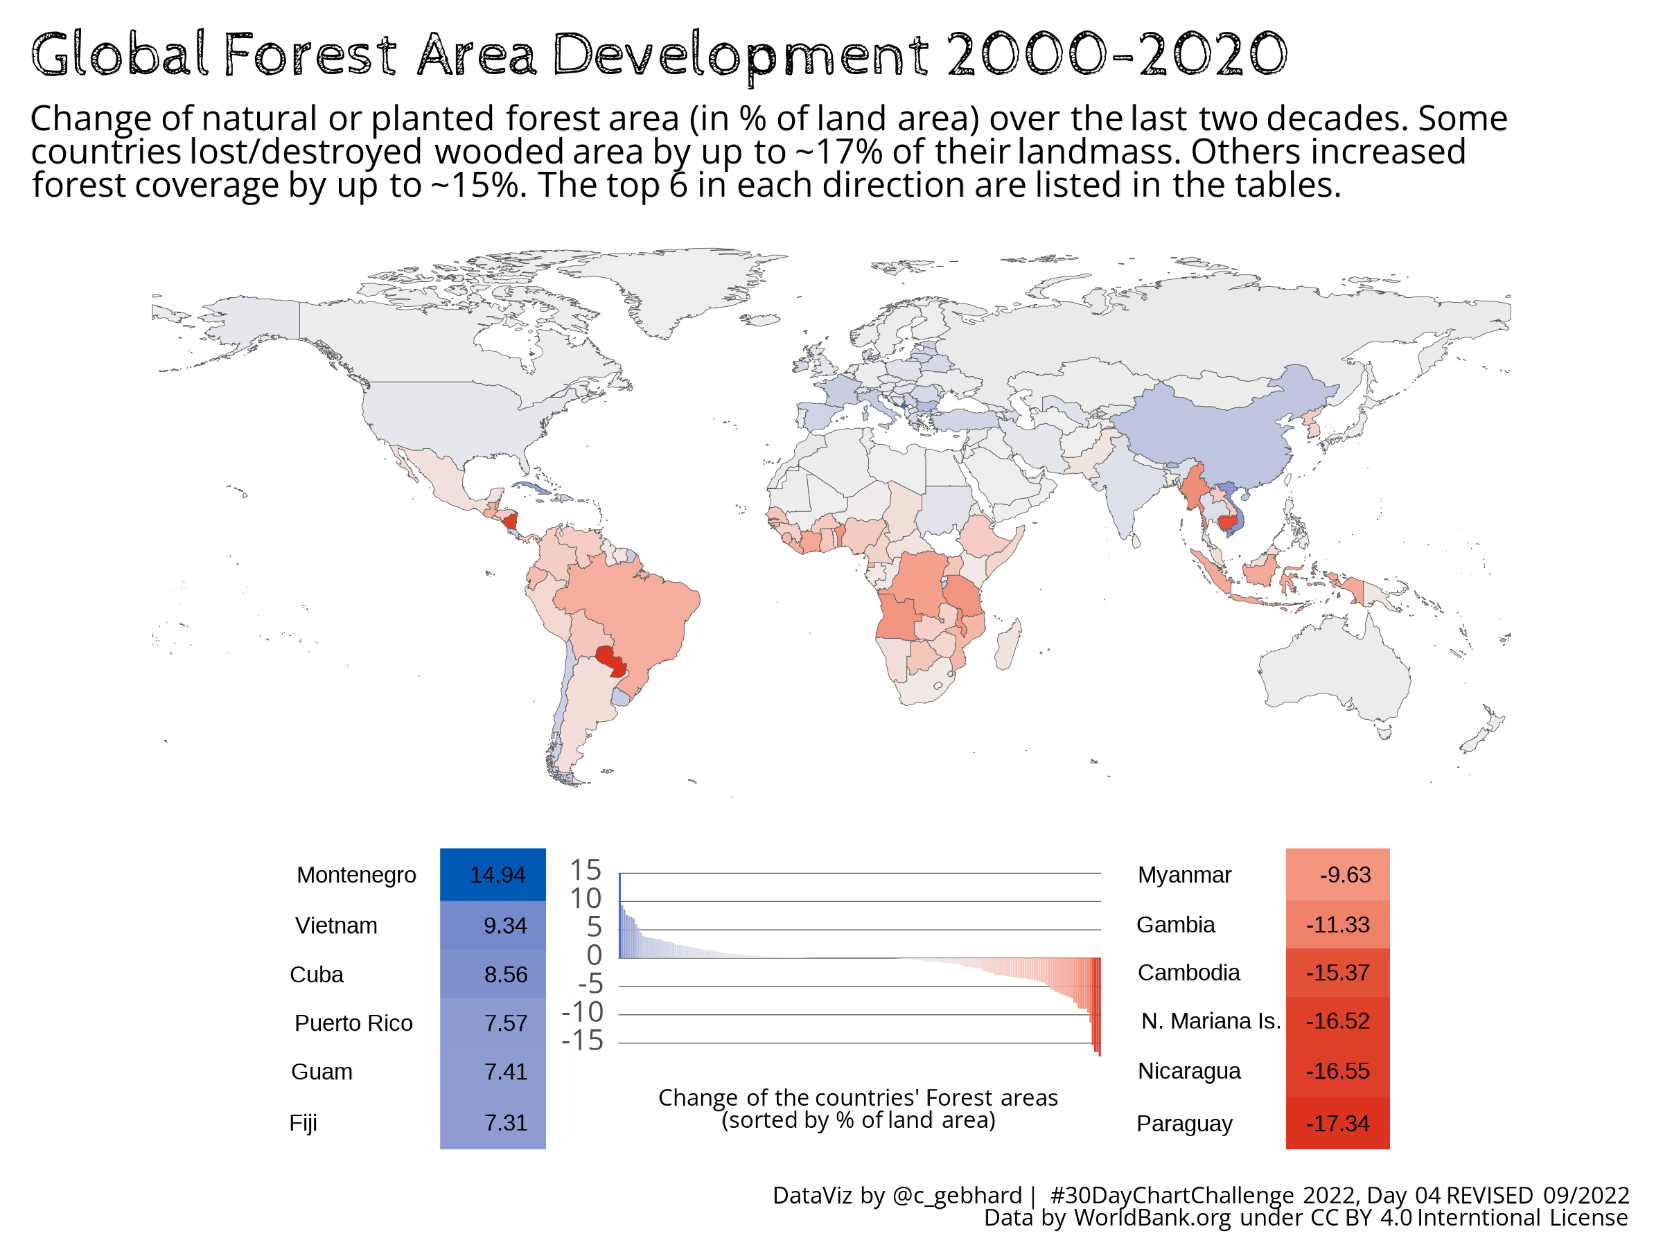
#30DayChartChallenge #30DCCNov22Reposts #Day4 - Topic: flora
A choropleth map combined with a table. This is an updated version using {flextable}'s new feature to export tables as plot objects, which can be used e.g. in {patchwork}.
Code is in a blog post regarding this feature: .https://jollydata.blog/posts/2022-09-09-flextable-in-graphs/2022-09-09-flextable-in-graphs.html
Tool: #rstats @rstats Data: WorldBank.org
Fonts: Cabin Sketch, Open Sans
#rstats #day4 #30DCCNov22Reposts #30DayChartChallenge
Lisa DeBruine 🏳️🌈 · @debruine
1583 followers · 182 posts · Server tech.lgbtIf you made plots for the last #30DayChartChallenge, join @basepair and me reposting them this month under #30DCCNov22Reposts
I’m especially keen to see how everyone does their alt-text to describe charts. I love how easy it is to add alt-text on mastodon, and how normative it is here.
#30DayChartChallenge #30DCCNov22Reposts
Lisa DeBruine 🏳️🌈 · @debruine
1583 followers · 182 posts · Server tech.lgbt
#30DayChartChallenge Historical
#30DCCNov22Reposts #day3
Tutorial: https://debruine.github.io/30DCC-2022/03-historical.html
#30DayChartChallenge #30DCCNov22Reposts #day3
Christian Gebhard · @basepair
314 followers · 256 posts · Server vis.social
#30DayChartChallenge #30DCCNov22Reposts #Day3 - Topic: historical
Back to the Shakespeare data! I wanted to compare the length of his plays.
Tool: #rstats @rstats Data: kaggle users LiamLarsen, aodhan
Color-Scale: MetBrewer "Isfahan2"
Fonts: Niconne, Noto Sans (+Mono)
Code: https://github.com/nucleic-acid/30DayChartChallenge_2022
#datavis #dataviz #shakespeare #distribution #typography #monospace #barchart
#barchart #monospace #typography #distribution #shakespeare #dataviz #datavis #rstats #day3 #30DCCNov22Reposts #30DayChartChallenge
Christian Gebhard · @basepair
314 followers · 256 posts · Server vis.social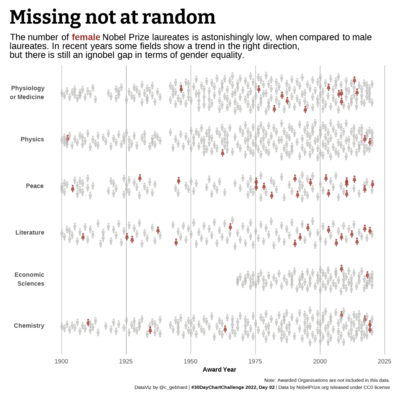
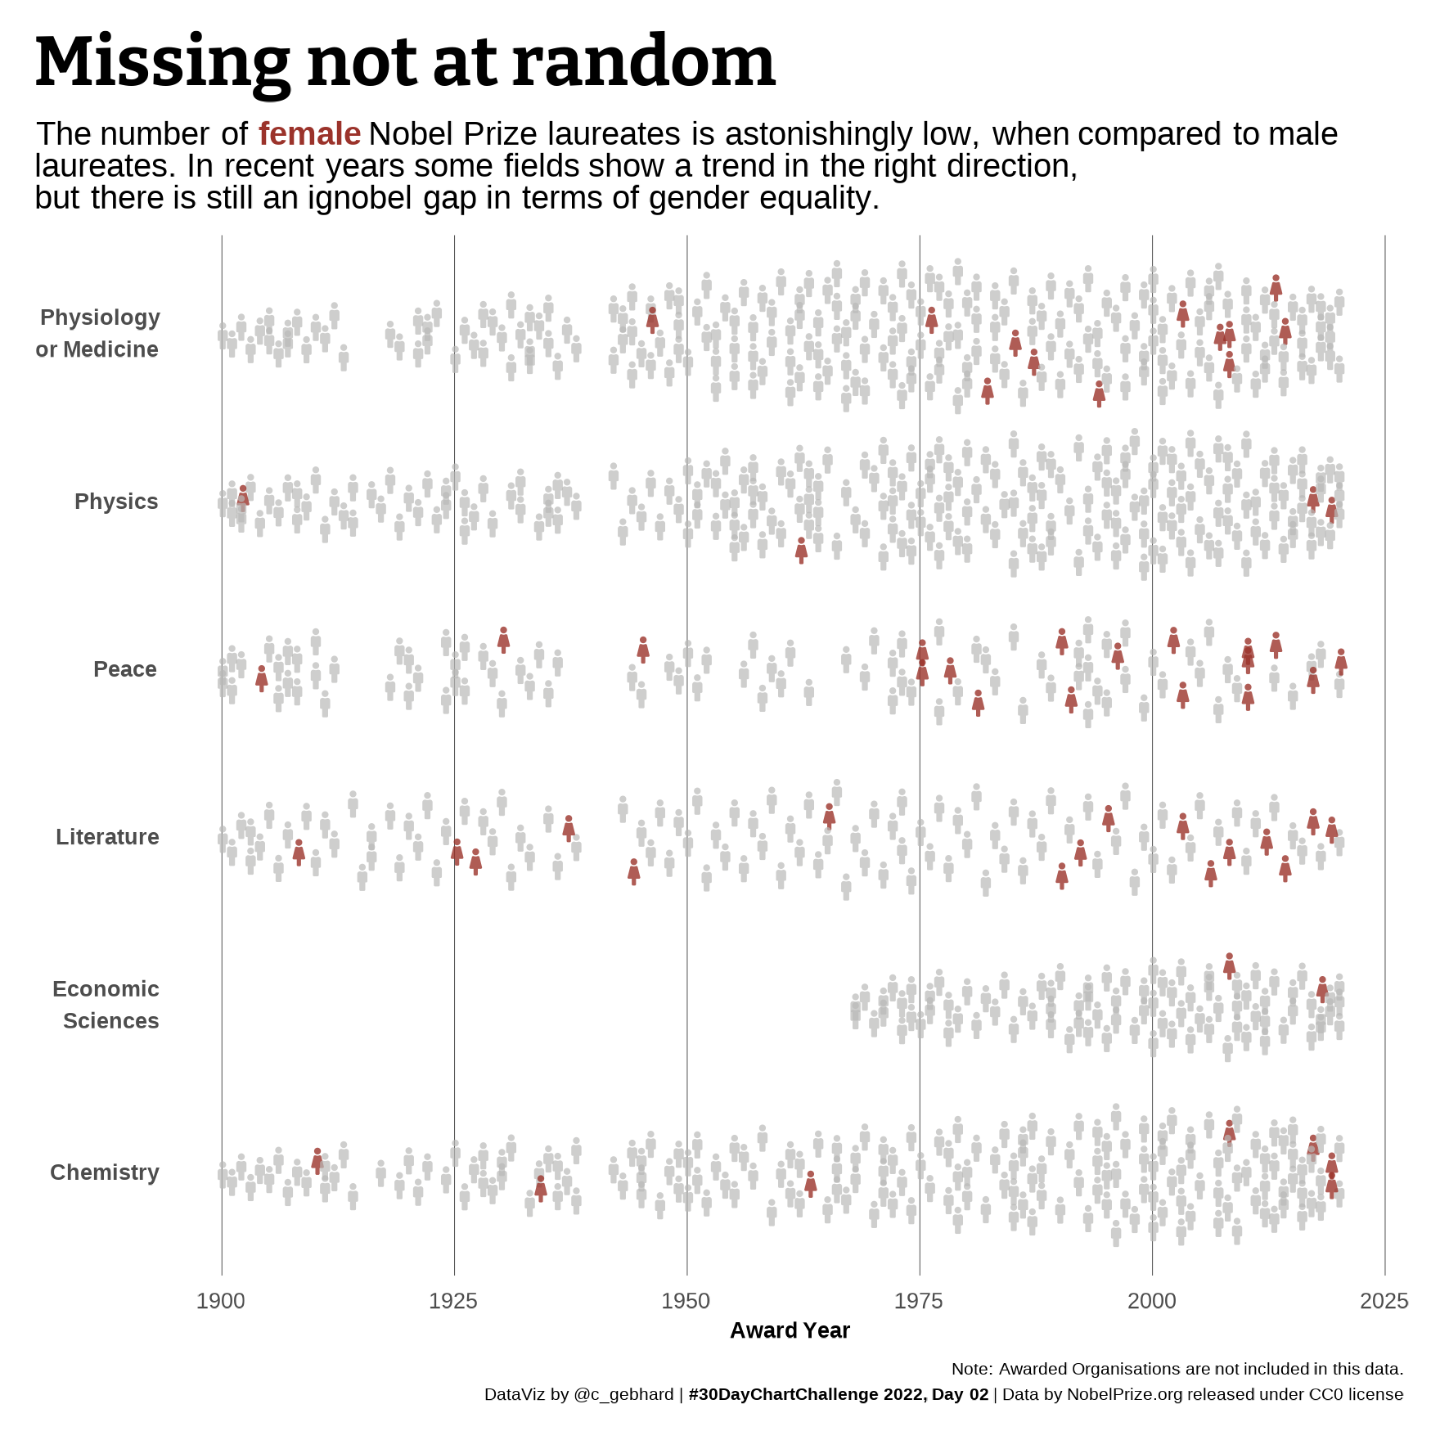
#30DayChartChallenge #30DCCNov22Reposts #Day2 - Topic: pictogram
Looking at gender inequality at the Nobel Prizes. (This is not yet updated with the 2023 awards.)
Tool: #rstats @rstats Data: nobelprize.org
Fonts: Bitter, Open Sans
Code: https://github.com/nucleic-acid/30DayChartChallenge_2022
#dataviz #datavis #gendergap #genderinequality #nobelprize #rstats #day2 #30DCCNov22Reposts #30DayChartChallenge
Lisa DeBruine 🏳️🌈 · @debruine
1583 followers · 182 posts · Server tech.lgbt
Lisa DeBruine 🏳️🌈 · @debruine
1583 followers · 182 posts · Server tech.lgbt
#30DayChartChallenge
#30DCCNov22Reposts #Day1
Code and step-by-step tutorial at
https://debruine.github.io/30DCC-2022/01-part-to-whole.html
#30DayChartChallenge #30DCCNov22Reposts #day1