
Niko Komin · @kokemikal
73 followers · 174 posts · Server sciencemastodon.com
I wanted to transmit ranges in a #PieChart, so here is my day 1 (#partToWhole) of the #30DayChartChallenge and I would love to hear feedback. Does it work, is it clear? What could be done better?
#piechart #parttowhole #30DayChartChallenge #dataviz #infertility #fertility
Niko Komin · @kokemikal
73 followers · 174 posts · Server sciencemastodon.comI wanted to transmit ranges in a #PieChart, so here is my day 1 (#part-to-whole) of the #30DayChartChallenge and I would love to hear feedback. Does it work, is it clear? What could be done better?
#piechart #part #30DayChartChallenge #dataviz #infertility #fertility
Niko Komin · @kokemikal
73 followers · 174 posts · Server sciencemastodon.comI wanted to transmit ranges in a #PieChart, so here is my day 1 (#point-to-whole) of the #30DayChartChallenge and I would love to hear feedback. Does it work, is it clear? What could be done better?
#piechart #point #30DayChartChallenge #dataviz #infertility #fertility

Ryan · @ryanahart
35 followers · 75 posts · Server fosstodon.org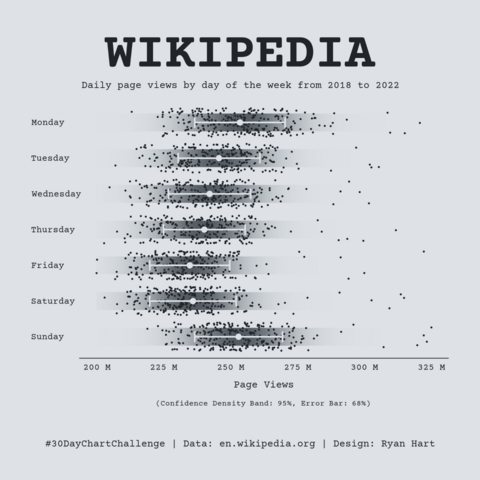
#30DayChartChallenge | April 2023 - Day 29 | monochrome
code: https://github.com/curatedmess/30DayChartChallenge/blob/main/2023/04292023/day_29.R
#30DayChartChallenge #ggplot #rstats #dataviz
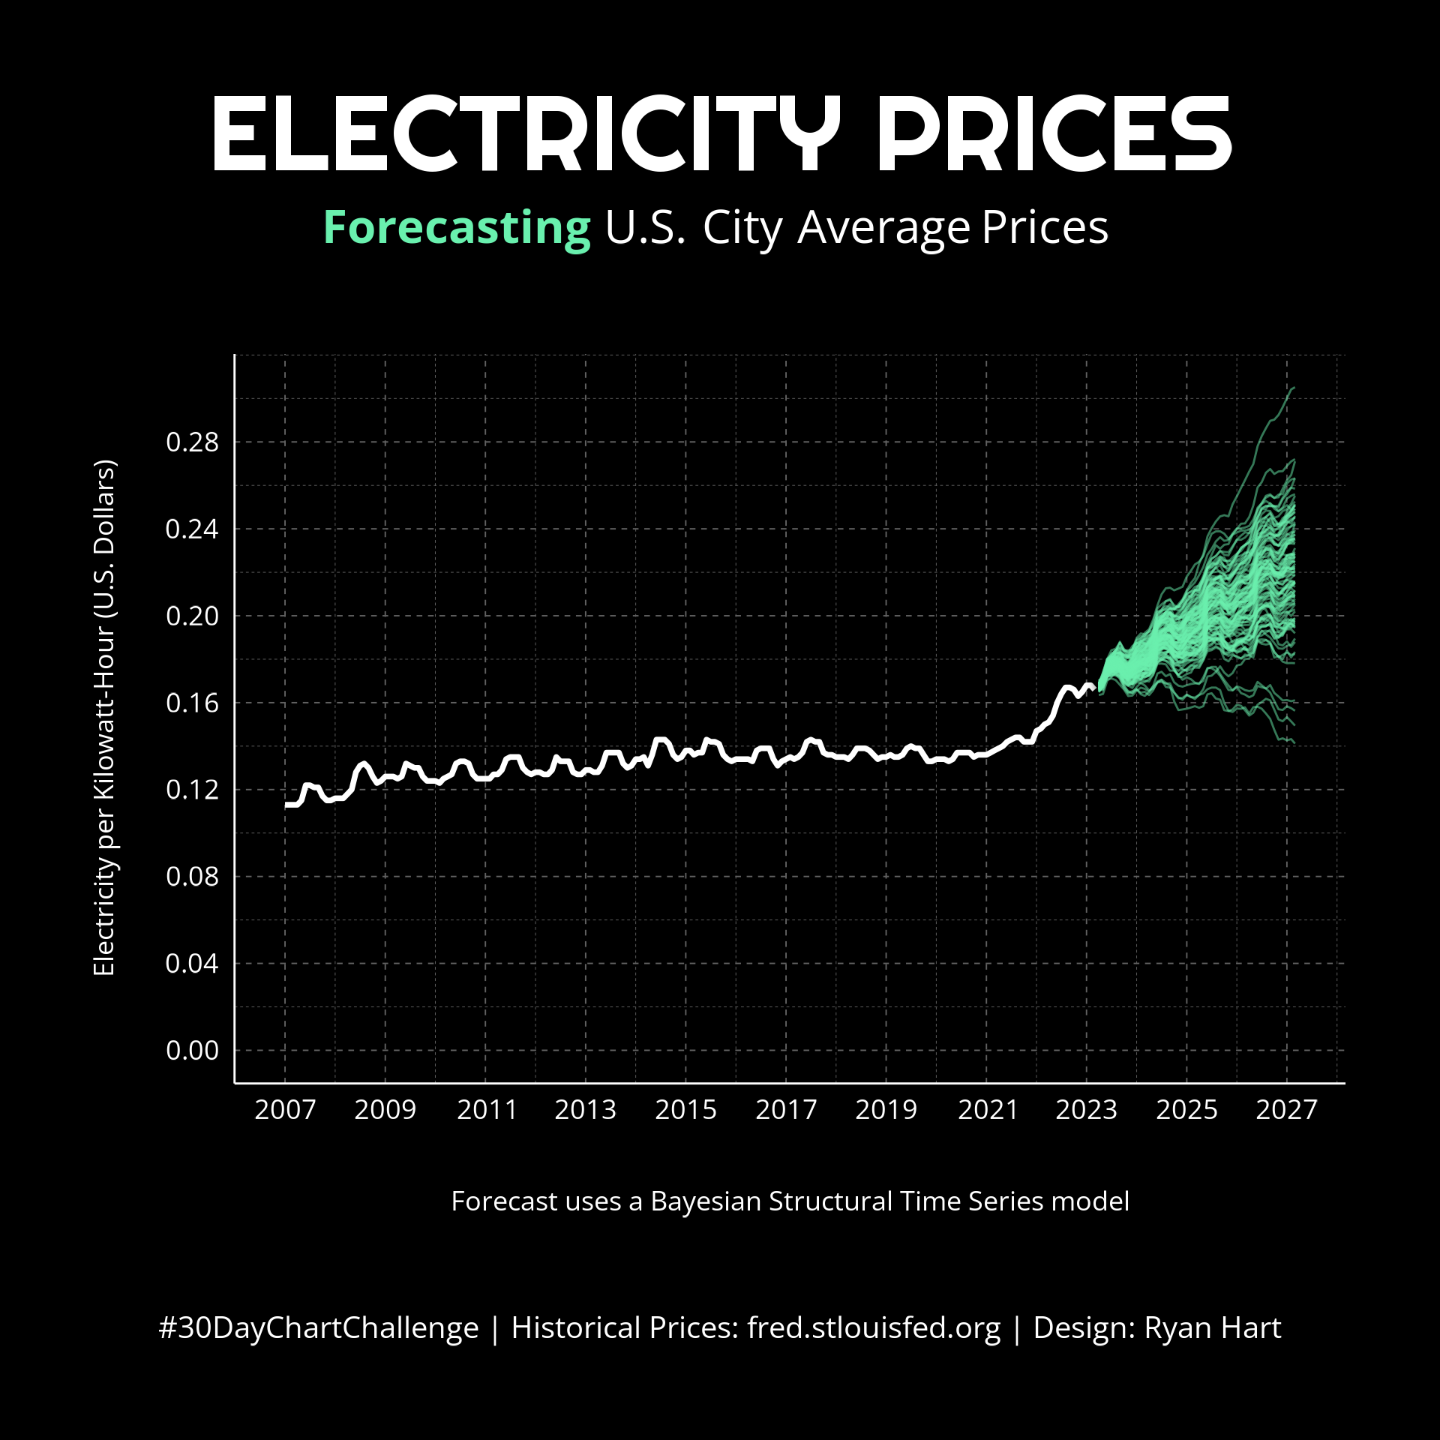
Ryan · @ryanahart
35 followers · 74 posts · Server fosstodon.org
#30DayChartChallenge | April 2023 - Day 28 | trend
went down a bit of a rabbit hole trying to learn how to illustrate uncertainty with time series by showing all the draws...still a bit uncertain of the model I chose
code: https://github.com/curatedmess/30DayChartChallenge/blob/main/2023/04282023/day_28.R
#30DayChartChallenge #ggplot #rstats #dataviz

Sam Van Horne, Ph.D. · @DataAngler
158 followers · 600 posts · Server vis.social
My #Rstats plot for Day 28 (Trend) of #30DayChartChallenge is a series plot that shows how fatal automobile crashes in Delaware have recently been increasing, after a period of decline.
Code: https://codeberg.org/svanhorne/TidyTuesday/src/branch/main/30DayChartChallenge/28_Trend/Code.r

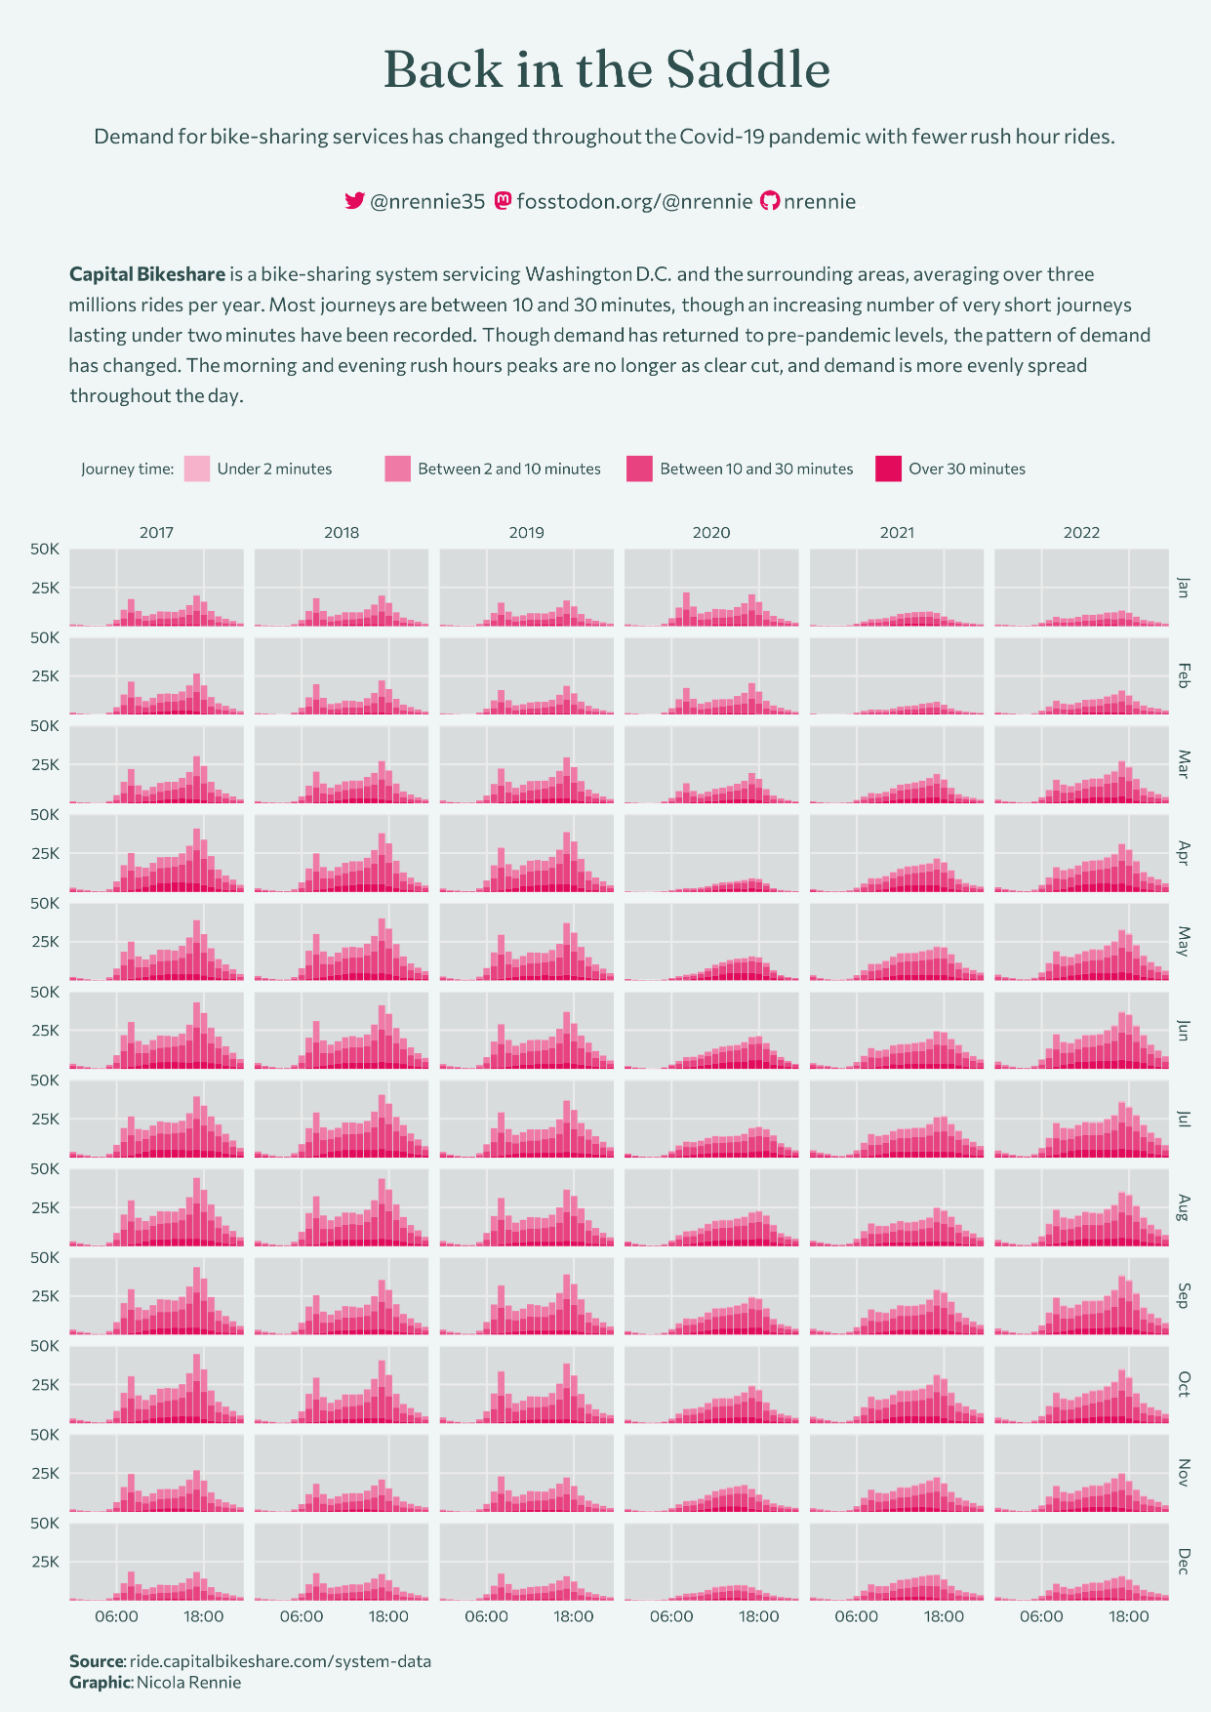
Nicola Rennie · @nrennie
1468 followers · 556 posts · Server fosstodon.org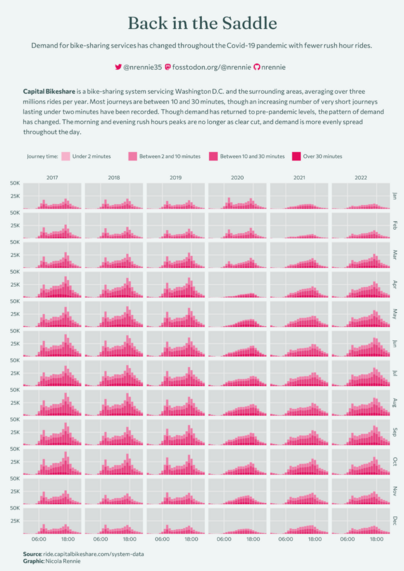
Now that I'm back to having WiFi, I'm playing catch up with the #30DayChartChallenge!
For #Day28 (trend), I had a look at the Capital Bikeshare data again and visualised how usage trends throughout the day have changed 🚲🚲🚲
#30DayChartChallenge #day28 #rstats #dataviz

remiforall · @remiforall
202 followers · 6581 posts · Server mamot.frRT @we_do_data
#30DayChartChallenge jour 2️⃣6️⃣ / Local Change
Une cartographie des ventes immobilières en Loire-Atlantique depuis 2014, un phénomène qui bouleverse la région, ses habitants et son économie.
Réalisée avec l’outil CineDataMap 🎥
🐦🔗: https://twitter.com/we_do_data/status/1651110314174300160

Nuria · @naltimir
12 followers · 19 posts · Server mstdn.social
#30DayChartChallenge 2023 Day 13 Pop culture
Yes, climate stripes are in pop culture.
An extra shade explicits the limit You Shall Not Pass. We have a limit 👉we show it
@IPCC_CH as discussed
@chezVoila
@AlexRuane
@Peters_Glen
Heatmaps with @f_l_o_u_r_i_s_h
+ Illustrator
#scicom #science #illustration #datavisualization
#datavisualization #Illustration #Science #scicom #30DayChartChallenge
Nuria · @naltimir
12 followers · 18 posts · Server mstdn.social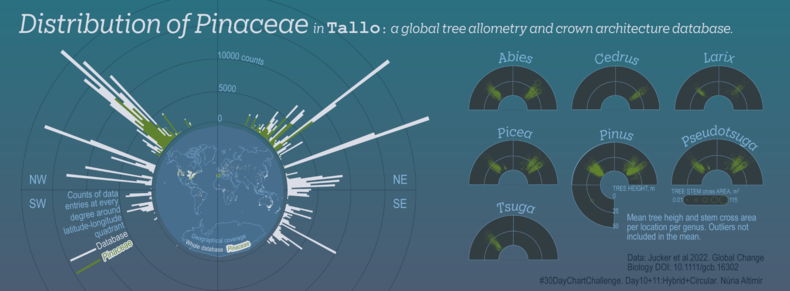
#30DayChartChallenge Day 10 Hybrid +Day 11 Circular within the Distribution theme. Mainly practice with circular arrangement: polar histogram + polar dot graphs + Sphere Van der Grinten projection
Data by @tommaso_jucker
+plots with #rstats + @qgis
final in Illustrator
#scicom #science #illustration #datavisualization
#datavisualization #Illustration #Science #scicom #RStats #30DayChartChallenge
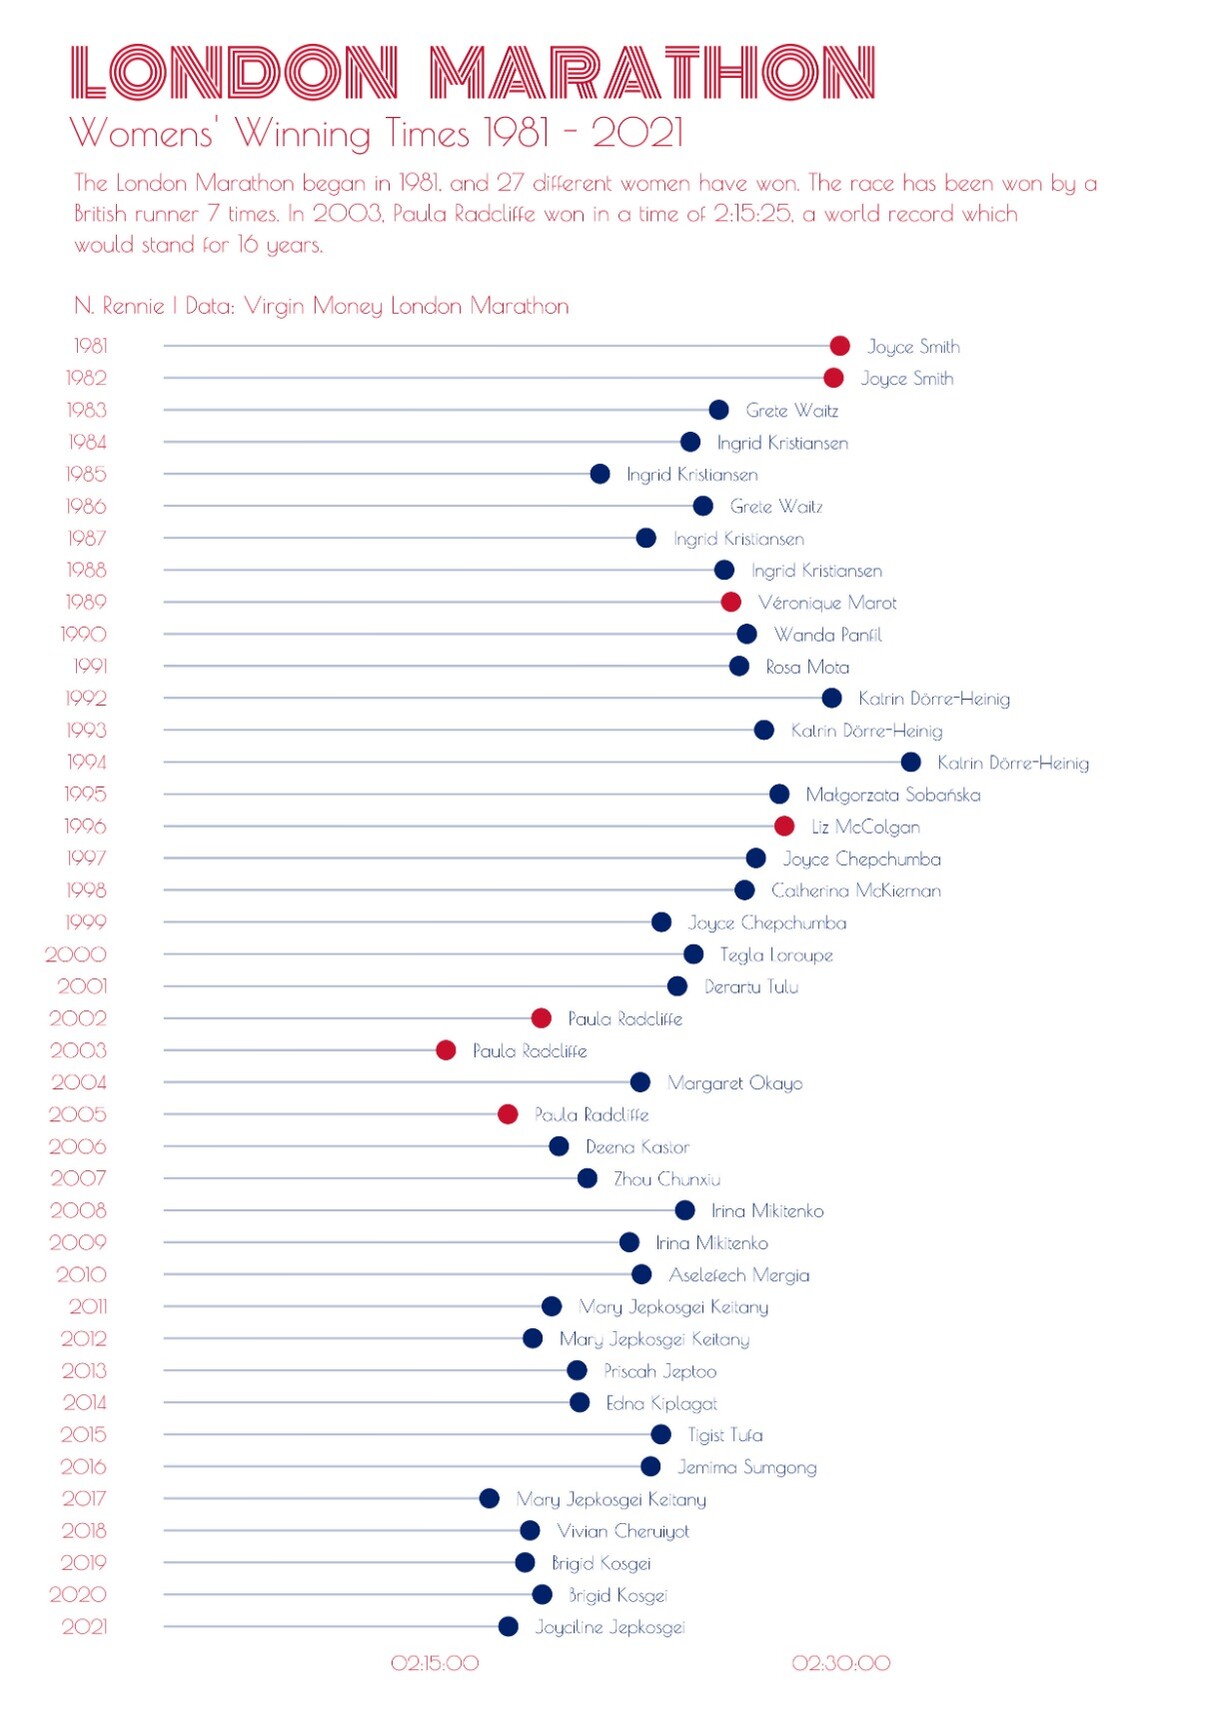
Ryan · @ryanahart
34 followers · 73 posts · Server fosstodon.org
#TidyTuesday | Week 17 | London Marathon
A World Marathon Major is considered global (I think), and trying to predict the future is full of uncertainty...so going to count this one as #30DayChartChallenge | Day 25 | global change (uncertainties) too.
code: https://github.com/curatedmess/TidyTuesday/blob/main/2023/04252023/sub_two.R
#tidytuesday #30DayChartChallenge #rstats #dataviz #ggplot2
Nicola Rennie · @nrennie
1463 followers · 548 posts · Server fosstodon.org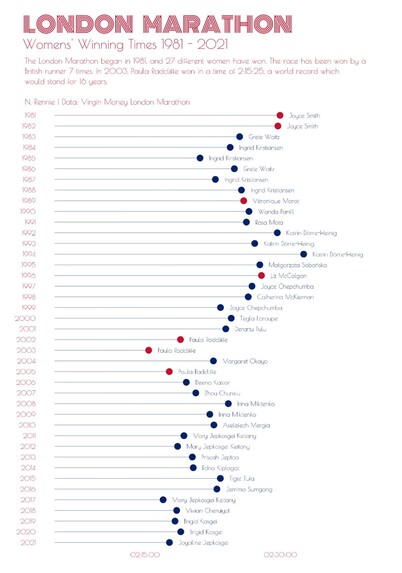
Blog post describing the process of using {rvest} to get this data from Wikipedia: https://nrennie.rbind.io/blog/web-scraping-rvest-london-marathon/
I also looked at London Marathon data for the #30DayChartChallenge last year!
Code: https://github.com/nrennie/30DayChartChallenge/blob/main/2022/scripts/07_physical.R
Benjamin Nowak · @bjnnowak
46 followers · 69 posts · Server fosstodon.org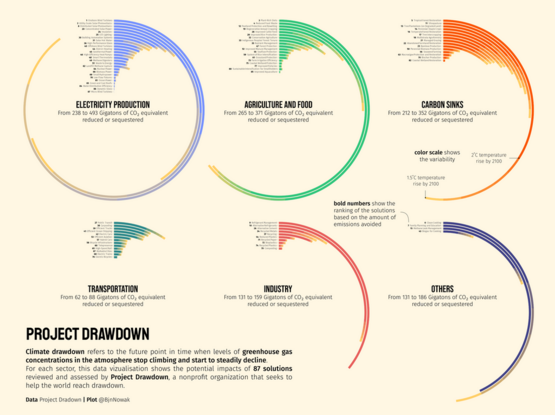
For #Day25 of #30DayChartChallenge (Global change) a #dataviz to compare the impacts of various solutions to reach drawdown, the moment when greenhous gases concentrations in atmosphere stop ↗️ and start ↘️
Data from Project Drawdown
#RStats code https://github.com/BjnNowak/TidyTuesday/blob/main/SC_drawdown.R
#day25 #30DayChartChallenge #dataviz #rstats
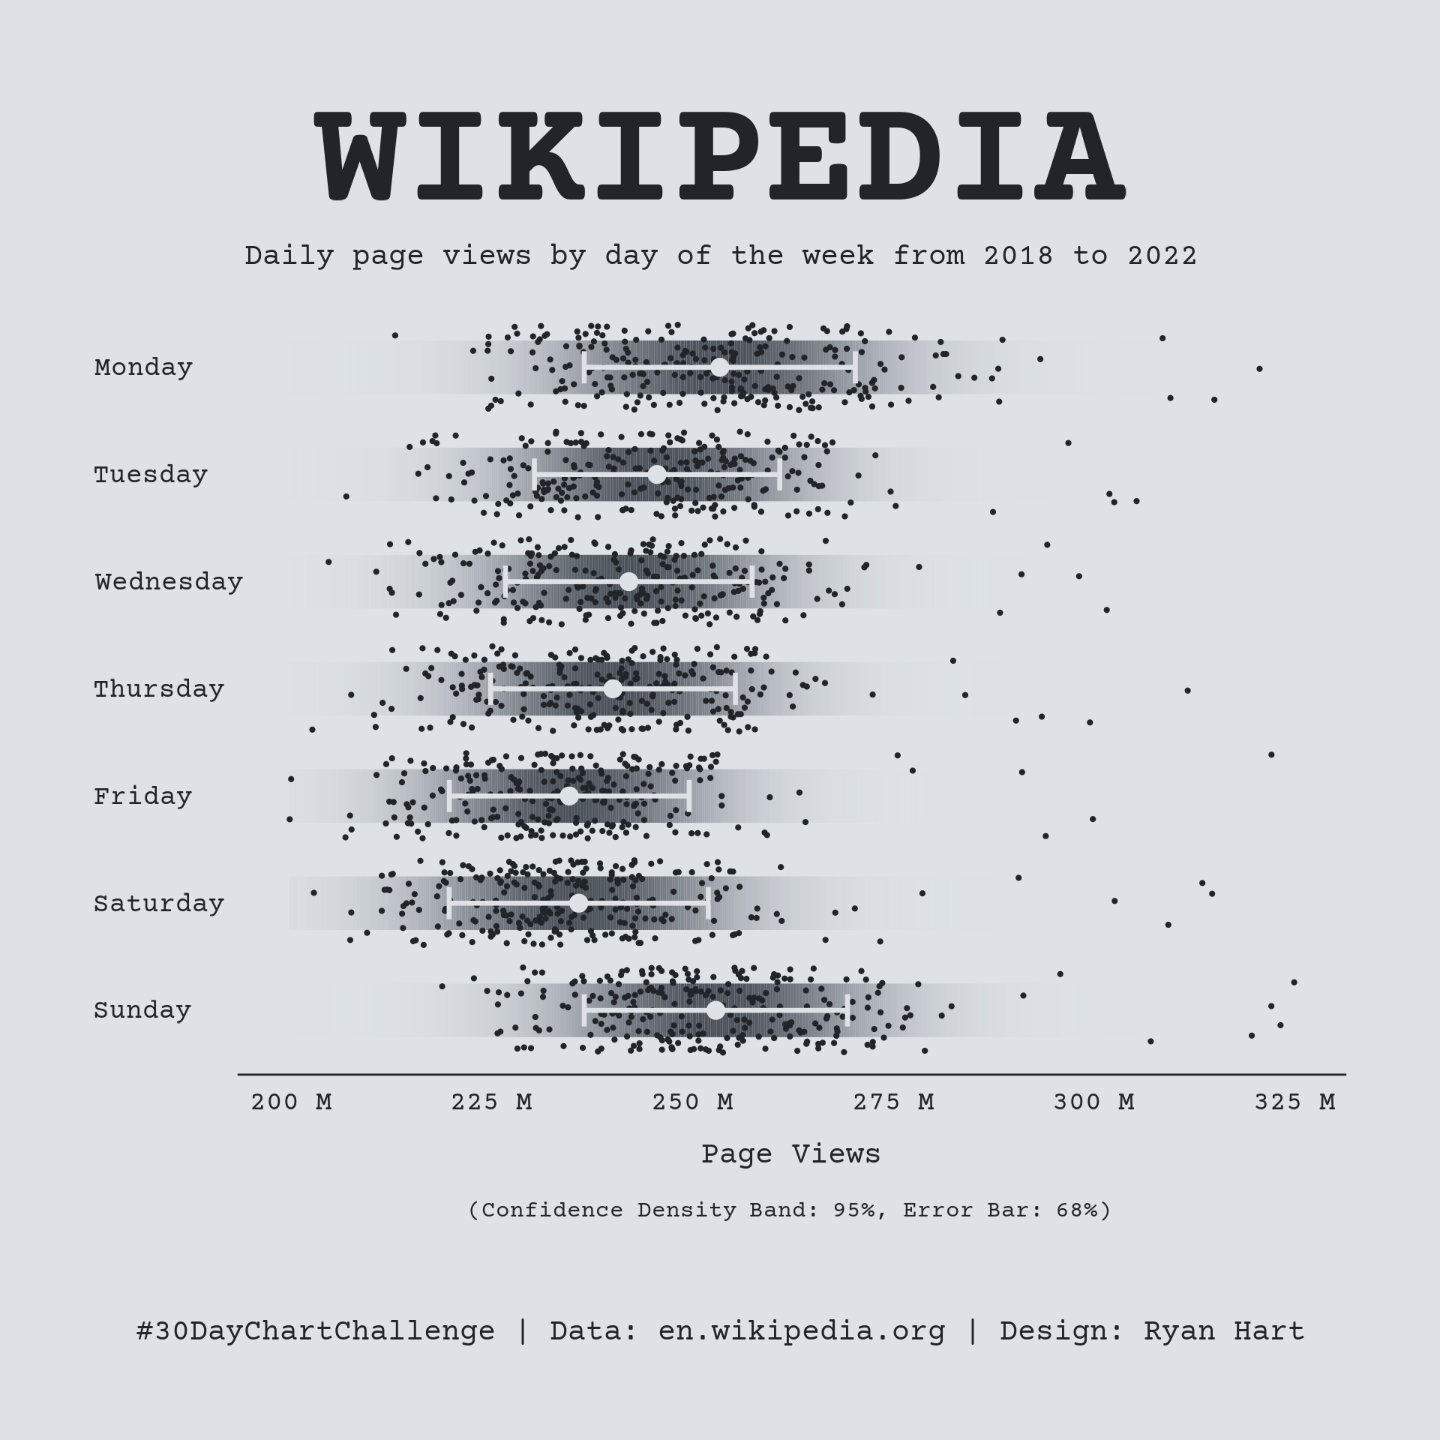
Ryan · @ryanahart
34 followers · 72 posts · Server fosstodon.org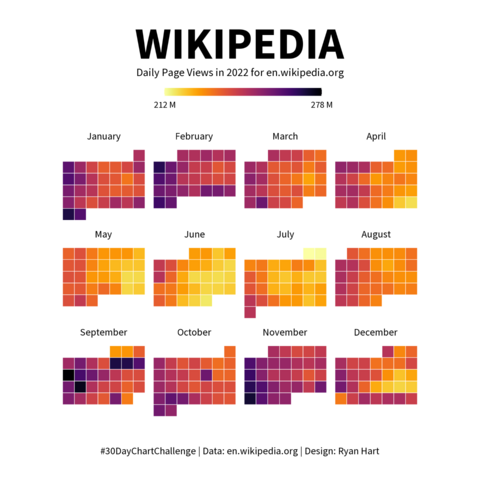
#30DayChartChallenge | April 2023 - Day 23 | tiles
wikipedia daily page views for 2022...interesting pattern...school's out for summer 🤔
code: https://github.com/curatedmess/30DayChartChallenge/blob/main/2023/04232023/day_23.R
#30DayChartChallenge #ggplot #rstats #dataviz
Ryan · @ryanahart
34 followers · 72 posts · Server fosstodon.org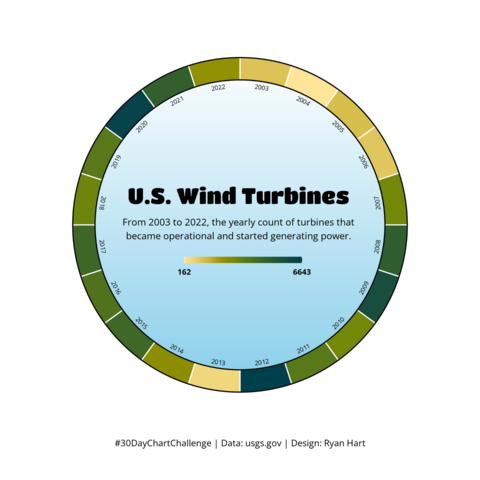
#30DayChartChallenge | April 2023 - Day 22 | green energy
updated version with dates along ring...
code: https://github.com/curatedmess/30DayChartChallenge/blob/main/2023/04222023/day_22.R
#30DayChartChallenge #ggplot #rstats #dataviz
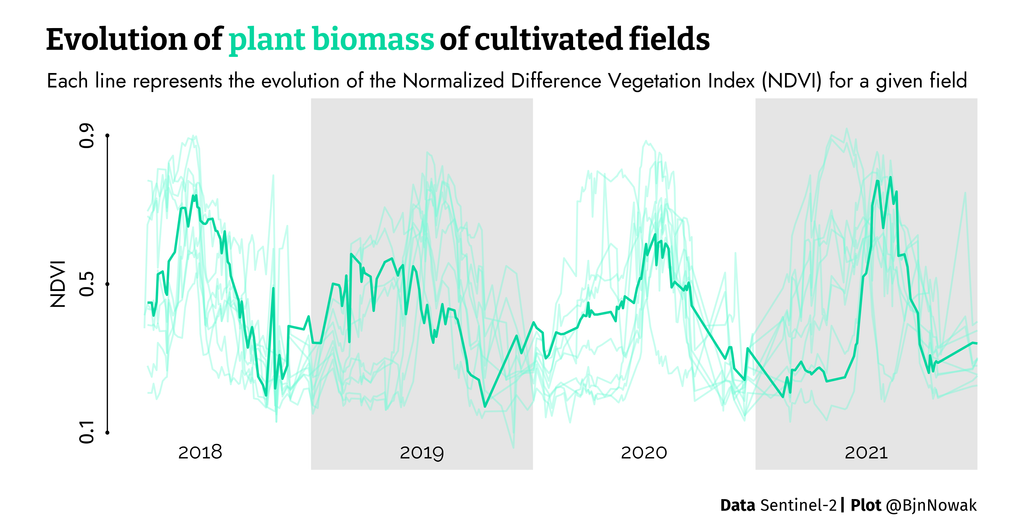
Benjamin Nowak · @bjnnowak
47 followers · 68 posts · Server fosstodon.org
For #Day22 of #30DayChartChallenge (Time Series X Green energy) a #DataViz about plant biomass evaluation by🛰️images
🔗#RStats code https://github.com/BjnNowak/TidyTuesday/blob/main/SC_NDVI.R
#day22 #30DayChartChallenge #dataviz #rstats

Dr. Dominic Royé · @dr_xeo
449 followers · 200 posts · Server mstdn.social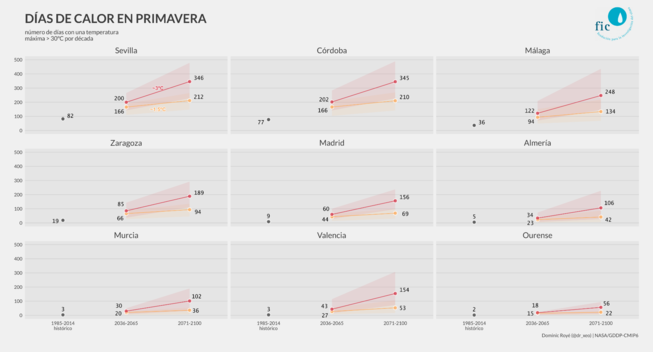
#30DayChartChallenge | April 2023 - Day 21 | down/upwards
This graph shows the average number of days per decade with maximums > 30ºC in spring for an increase of 1.5ºC (SSP2-4.5) and 3ºC (SSP5-8.5). #climatechange
La próxima semana es esperan temperaturas muy elevadas, propias de mes de julio, pero, ¿Qué pasará en el futuro? 🥵
En este gráfico se ve el promedio de días por década con máximas > 30ºC para un aumento de 1.5ºC (SSP2-4.5) y 3ºC (SSP5-8.5). #CambioClimatico #rstats #dataviz
#dataviz #RStats #CambioClimatico #ClimateChange #30DayChartChallenge
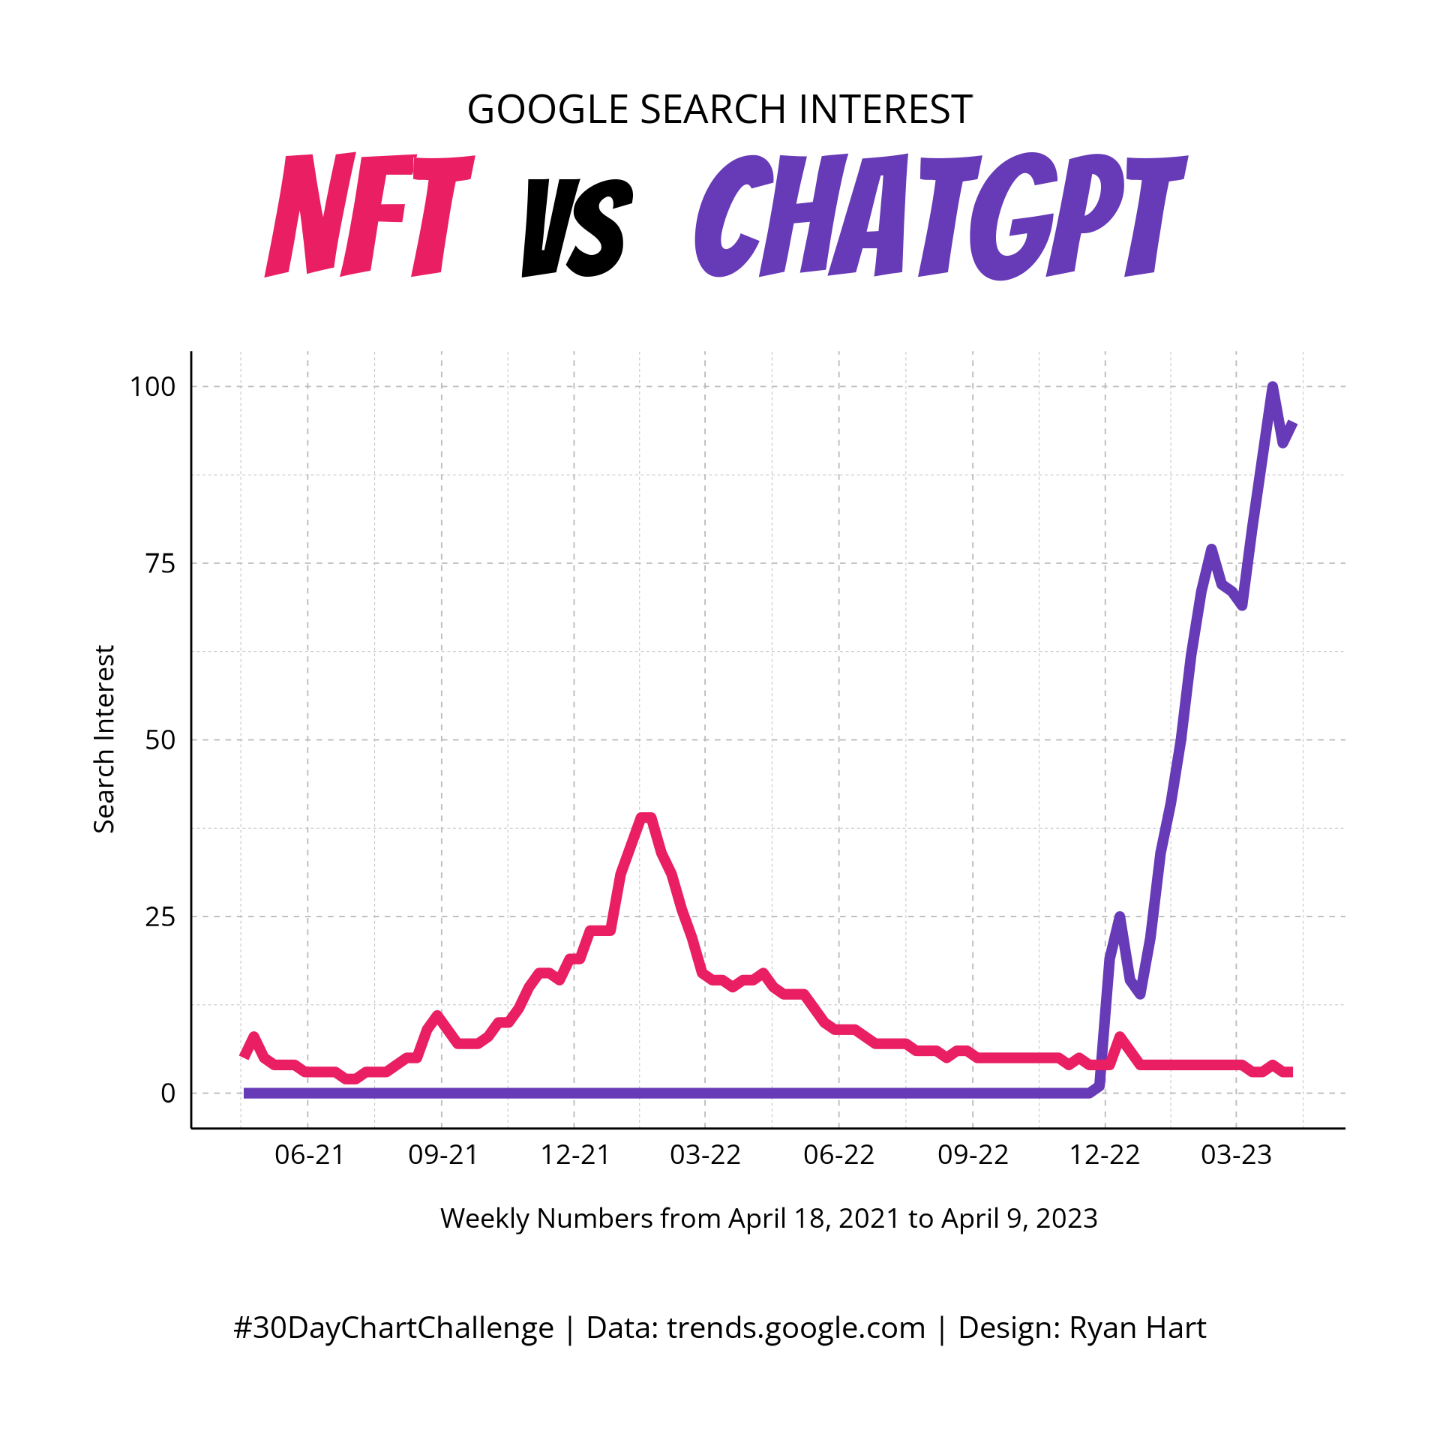
Ryan · @ryanahart
34 followers · 70 posts · Server fosstodon.org
#30DayChartChallenge | April 2023 - Day 21 | down/upwards
last year my social feeds were all about NFTs...now it's all about chatGPT
code: https://github.com/curatedmess/30DayChartChallenge/blob/main/2023/04212023/day_21.R
#30DayChartChallenge #ggplot #rstats #dataviz
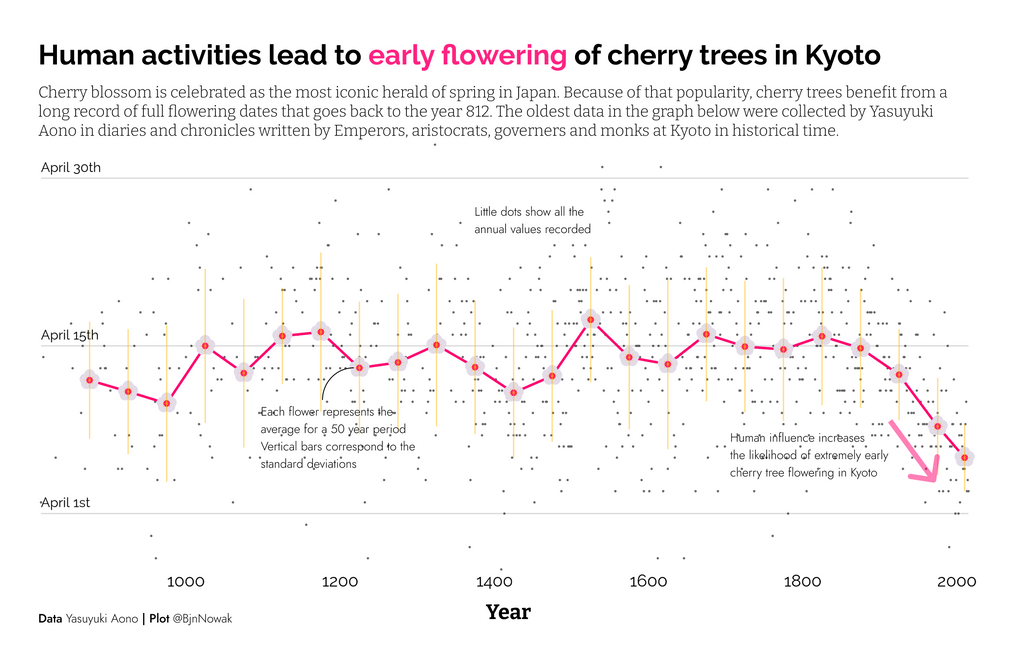
Benjamin Nowak · @bjnnowak
46 followers · 66 posts · Server fosstodon.org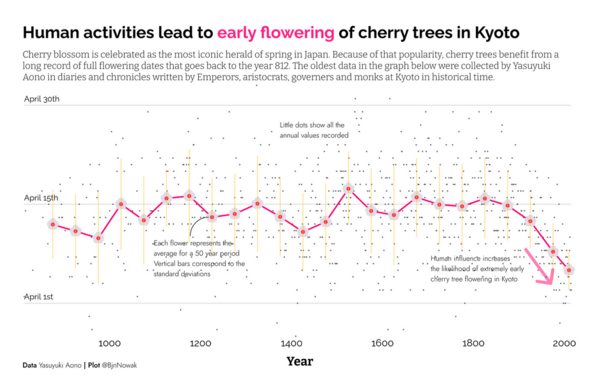
#Day21 of #30DayChartChallenge : Time seriesXDown/Up
A very long time series collected by Y. Aono to highlight the influence of human activities on cherry flowering. Fascinating process for data gathering!
#Rstats code https://github.com/BjnNowak/TidyTuesday/blob/main/SC_cherry.R
#day21 #30DayChartChallenge #rstats
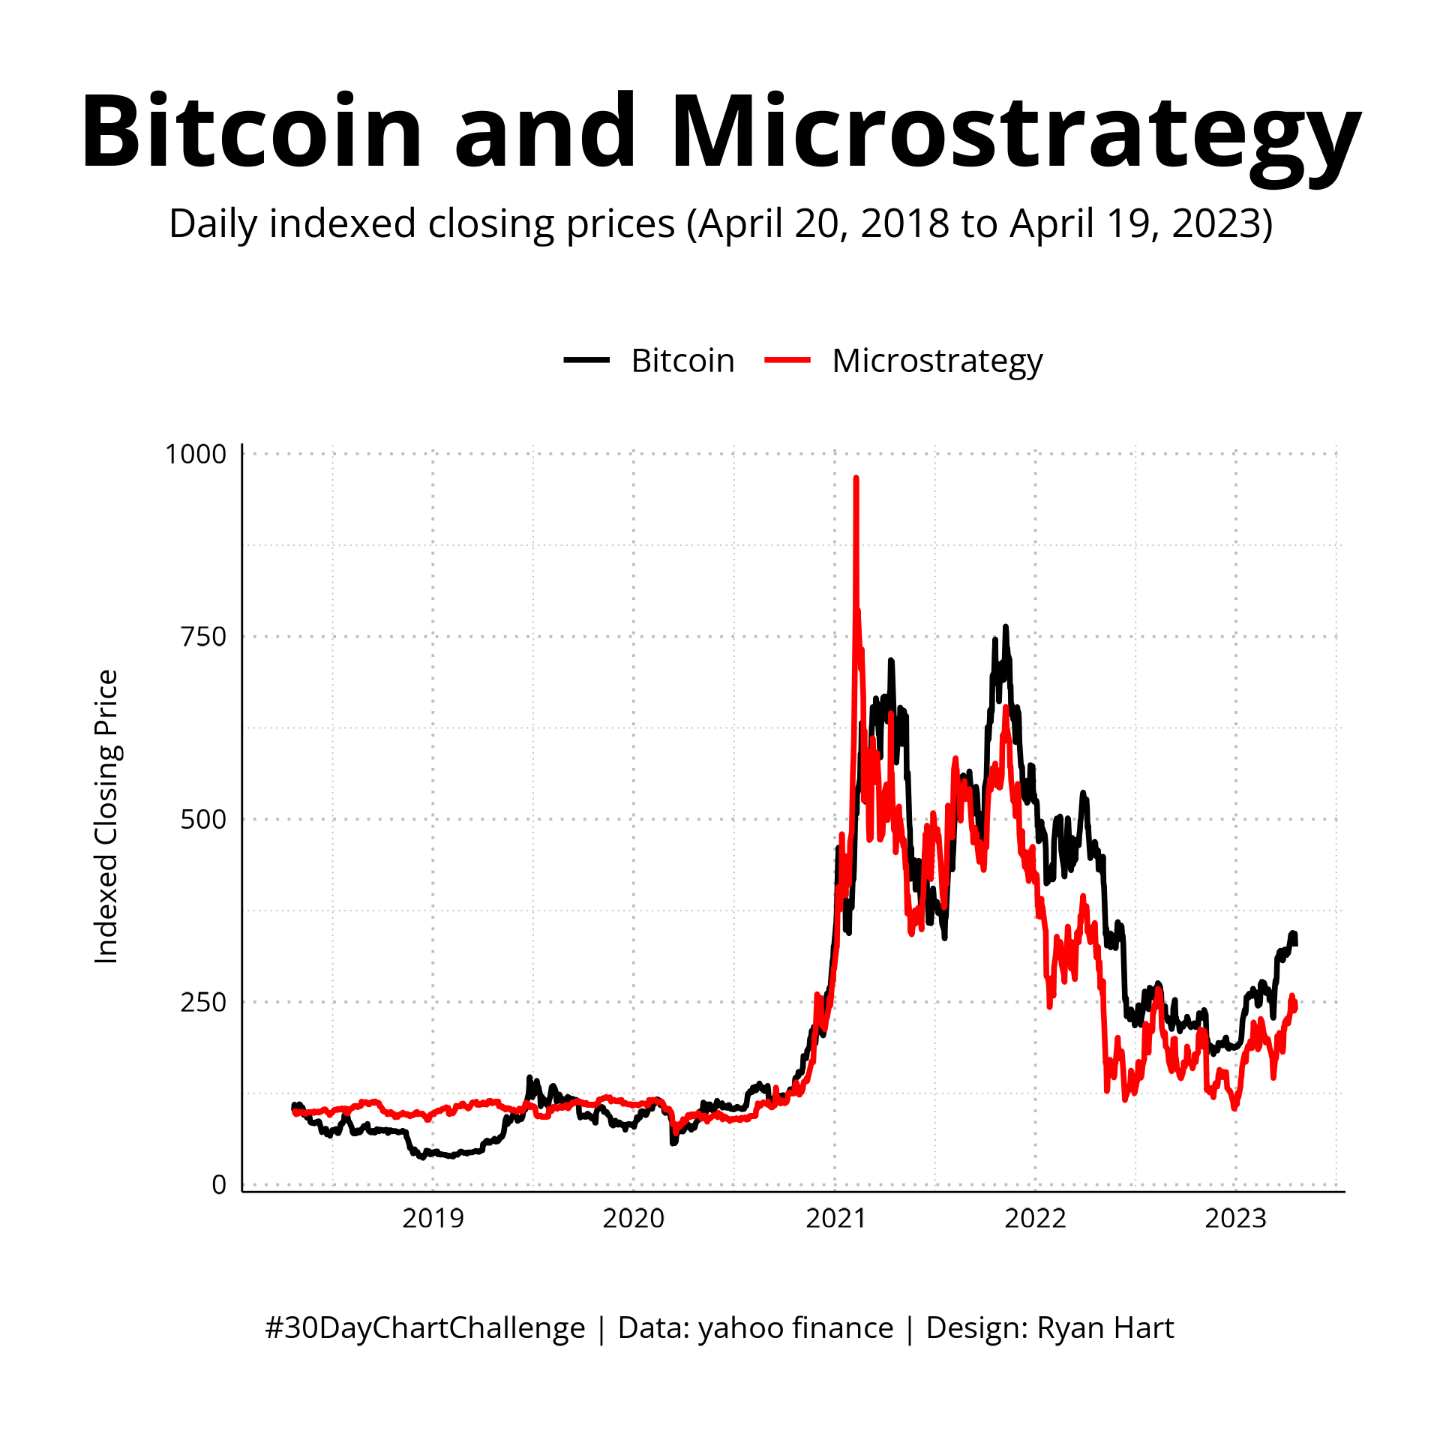
Ryan · @ryanahart
33 followers · 69 posts · Server fosstodon.org
#30DayChartChallenge | April 2023 - Day 20 | correlation
sorta correlated
code: https://github.com/curatedmess/30DayChartChallenge/blob/main/2023/04202023/day_20.R
#30DayChartChallenge #ggplot #rstats #dataviz