
Rafael H M Pereira · @UrbanDemog
543 followers · 319 posts · Server datasci.socialRT @bigdatadipper
#Day28 #30DayChartChallenge I have learned so much Observable Plot for this challenge. Today I wanted to revisit one of my initial plots and completely redesign with what I learned, to celebrate the growth.
@observablehq code: https://observablehq.com/d/7eb1cd4705f3b611
#DataViz @30DayChartChall
#day28 #30daychartchallenge #dataviz

DESUC · @desuc_uc
2 followers · 4 posts · Server lile.cl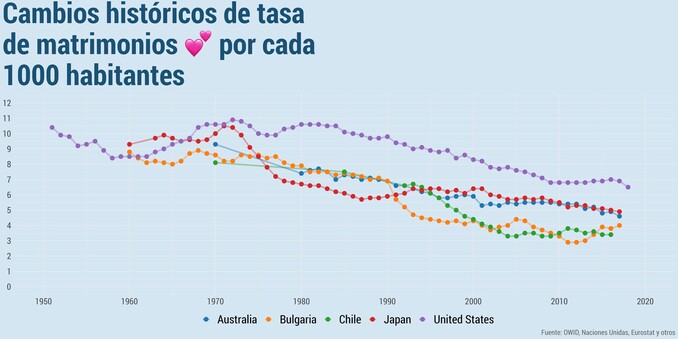
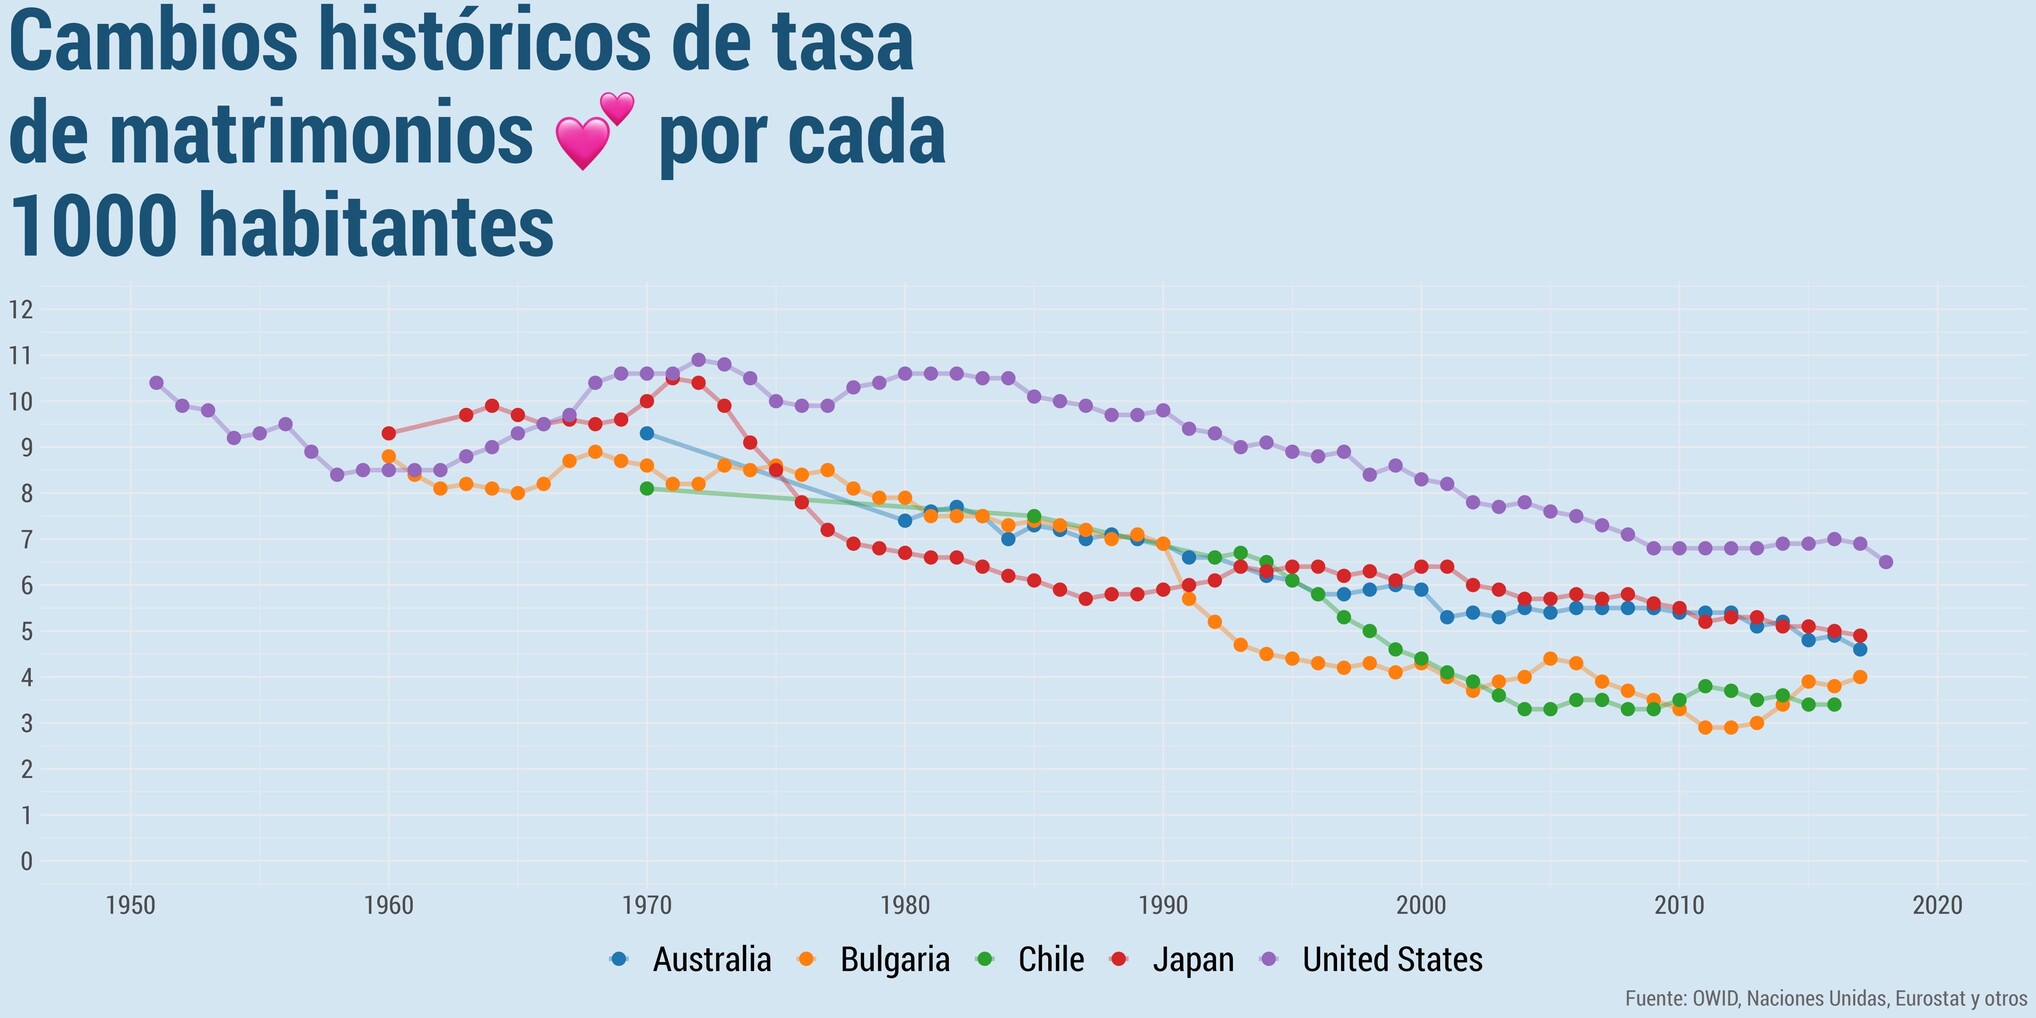
#30DayChartChallenge Día 4 Historical (distributions)📊.
Seguimos con la apasionante demografía, y mostramos los cambios históricos en la tasa de matrimonios por cada 1000 habitantes 💔
¿por qué sucede esto?
🔥Autoría de @CMarchantAraya@twitter.com
#30daychartchallenge #rstats #matrimonio #dataviz
DESUC · @desuc_uc
0 followers · 3 posts · Server lile.cl
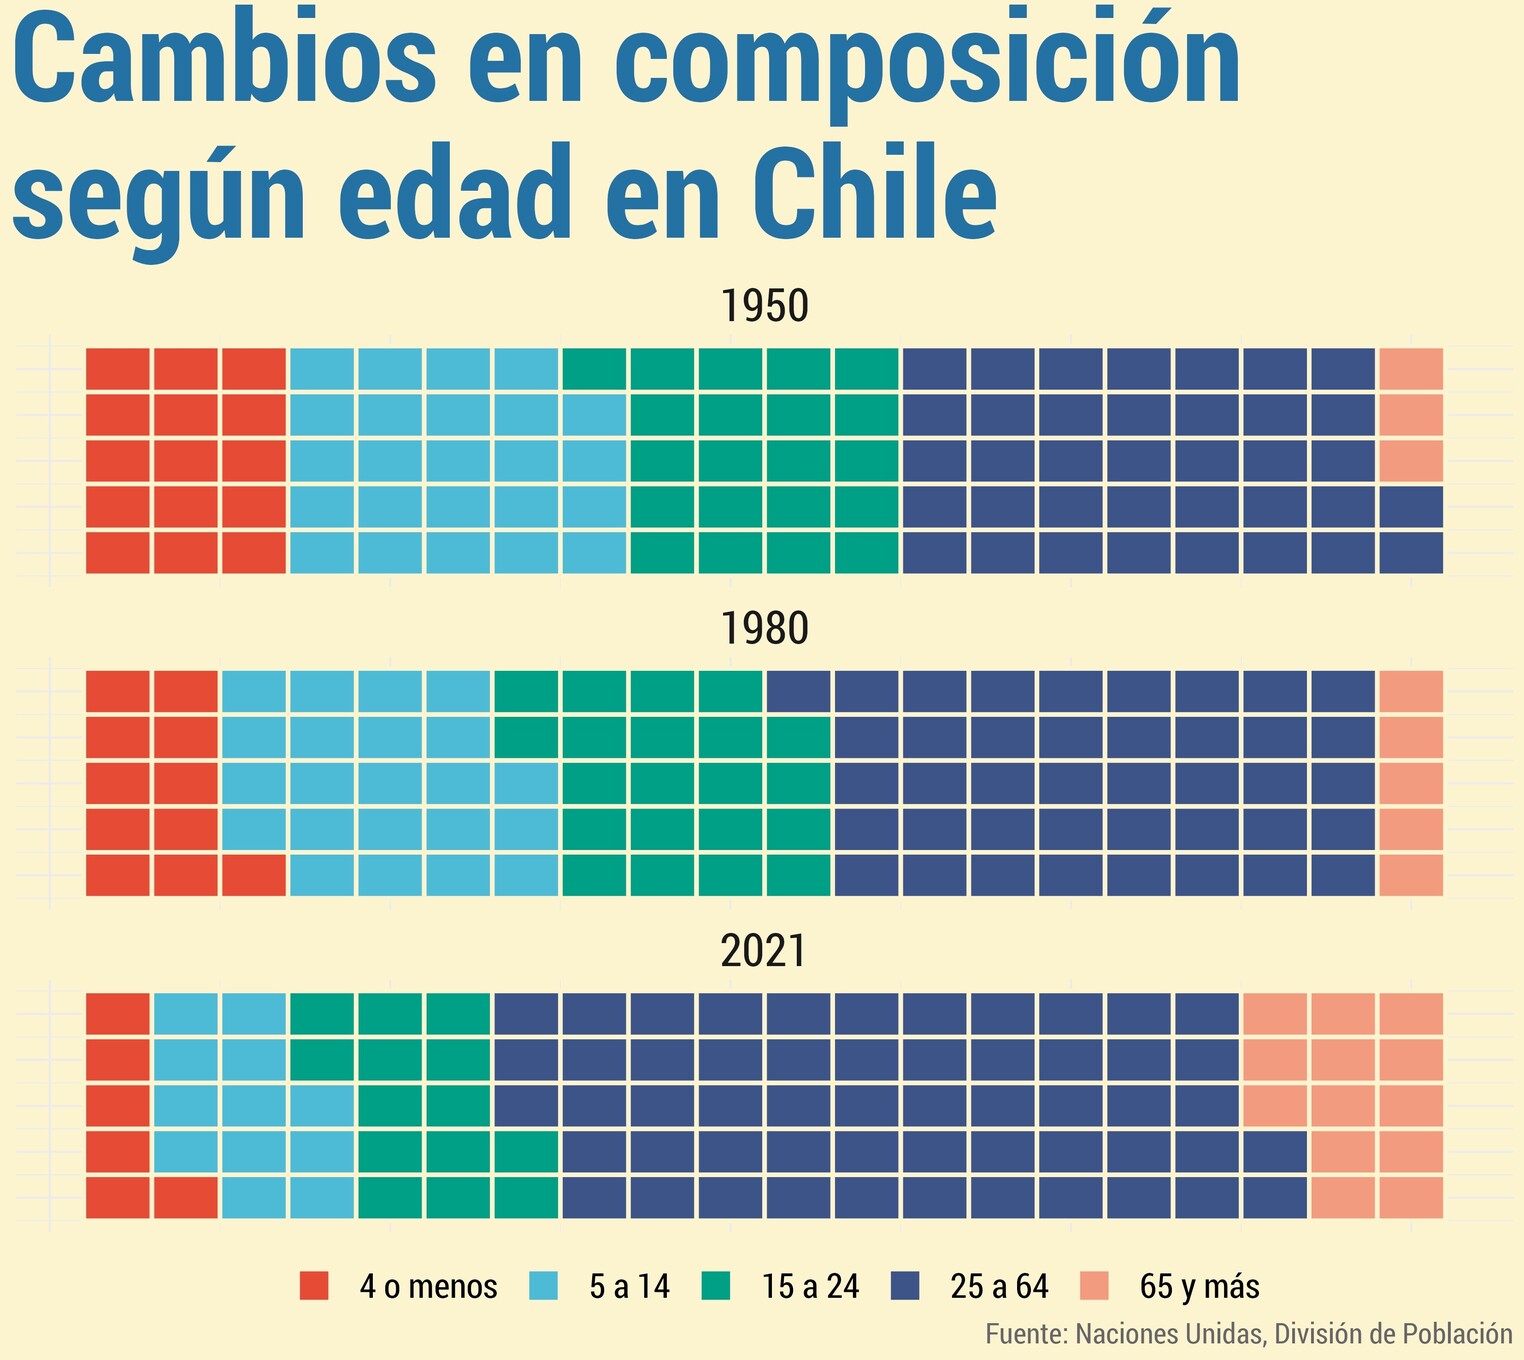
#30DayChartChallenge Día 2 Waffle 🧇
Con datos de Naciones Unidas, el gráfico muestra cambios en la composición de la población según edad en Chile. ¿Cómo irá a ser en unas décadas más?
🔥Autoría de @CMarchantAraya@twitter.com
Script GitHub DESUC https://github.com/DESUC/30DayChartChallenge2023…
#rstats #rstatistics #dataviz
#30daychartchallenge #rstats #rstatistics #dataviz
DESUC · @desuc_uc
0 followers · 2 posts · Server lile.cl#30DayChartChallenge Día 1 comparaciones part-to-whole 📷.
Aquí se muestra la evolución de personas que en Chile señalan ser felices según los datos de la World Value Survey ¿que tal? 📷
autoría @CMarchantAraya@twitter.com
Script en GitHub: https://github.com/DESUC/30DayChartChallenge2023
#rstats #rstatistics #charts #day1 #dataviz
#30daychartchallenge #rstats #rstatistics #charts #day1 #dataviz