
Gustavo · @astromecanik
209 followers · 536 posts · Server mastodon.online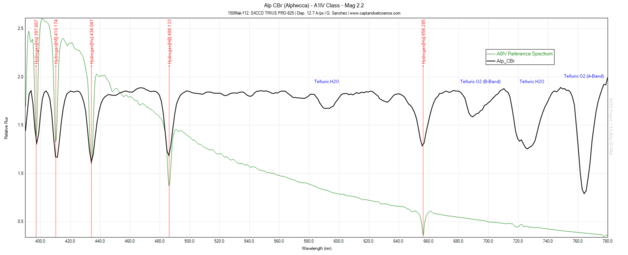
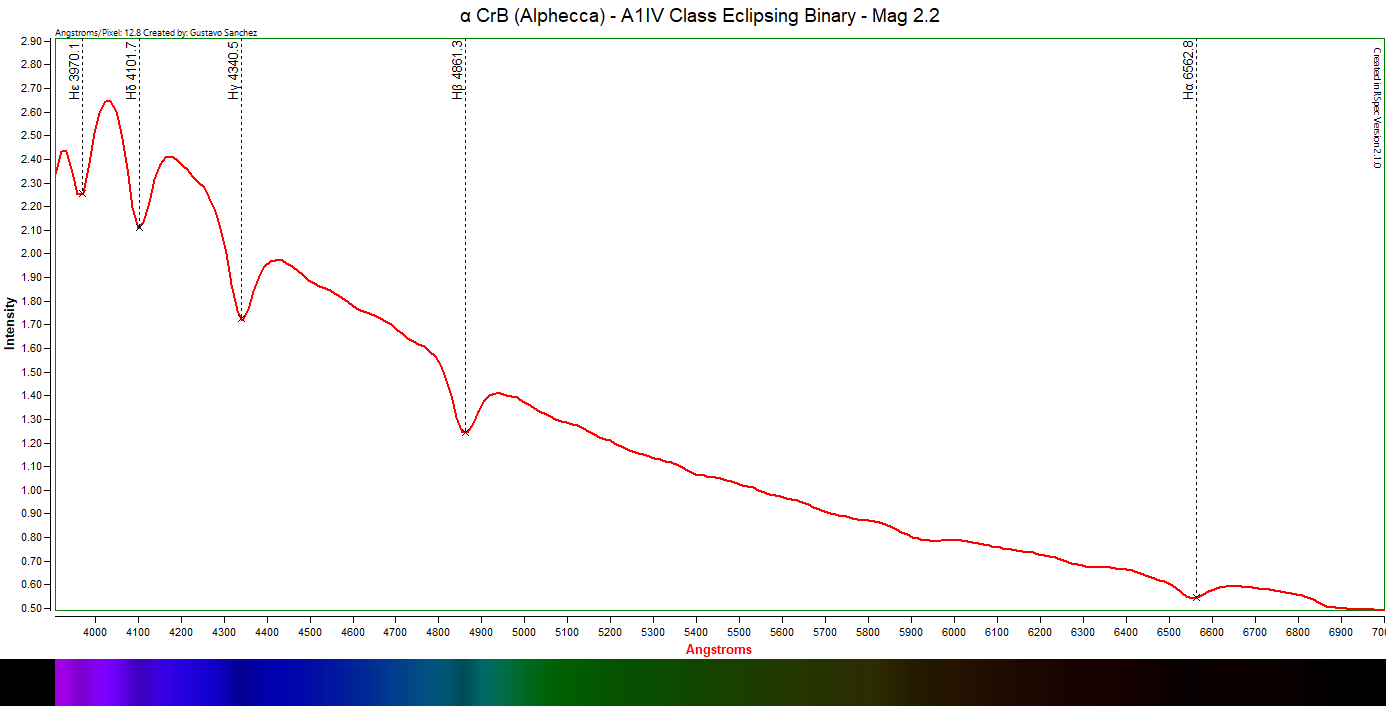
Plotting the same spectrum in a different way, the absorption lines can be easily be seen, and some other features are more apparent than before. See the wider dips to the right of the black curve? They are caused not by atoms on the star's atmosphere, but by Earth's own! The light of #Alphecca, travelling some 75 light years or so to reach us, is blocked at some wavelengths by the oxygen and water molecules in our atmosphere.
Gustavo · @astromecanik
209 followers · 536 posts · Server mastodon.online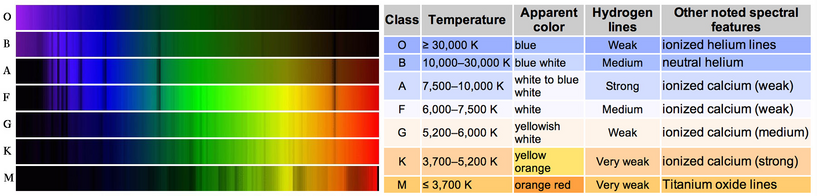
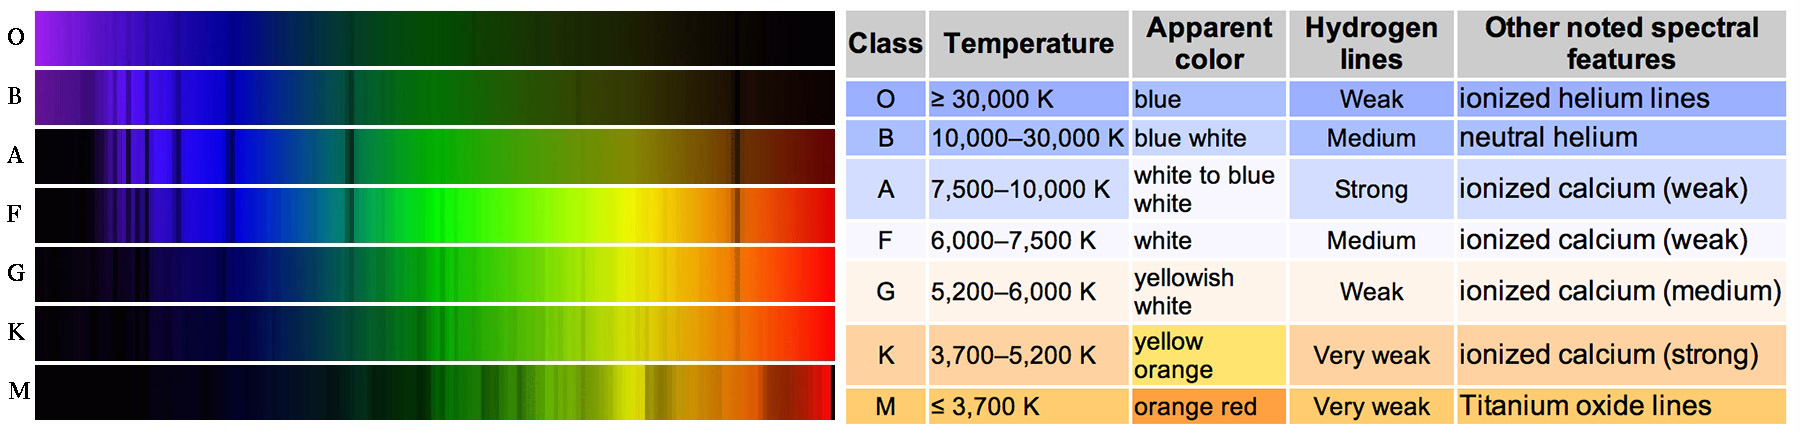
If we compare the absorption lines in our #Alphecca spectrum to the absorption lines of the known star types, it can be seen that our star is a "Class A" star, a "white to blue white" star. In this star class, #Balmer lines are the most prominent, so they can easily identified.
Gustavo · @astromecanik
209 followers · 536 posts · Server mastodon.online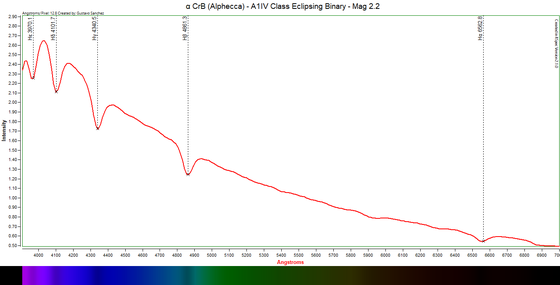
Did you see the small lines in the spectrum to the right? Those are absorption lines (they are called #Balmer lines, a set of absorption lines caused by interaction of the starlight with #hydrogen atoms in its atmosphere)! When properly plotted, these absorption lines are shown as "dips" in the spectrum curve below. The exact location and how "deep" these dips are, and the overall shape of the curve help me determine which star type #Alphecca is.
Gustavo · @astromecanik
209 followers · 536 posts · Server mastodon.online
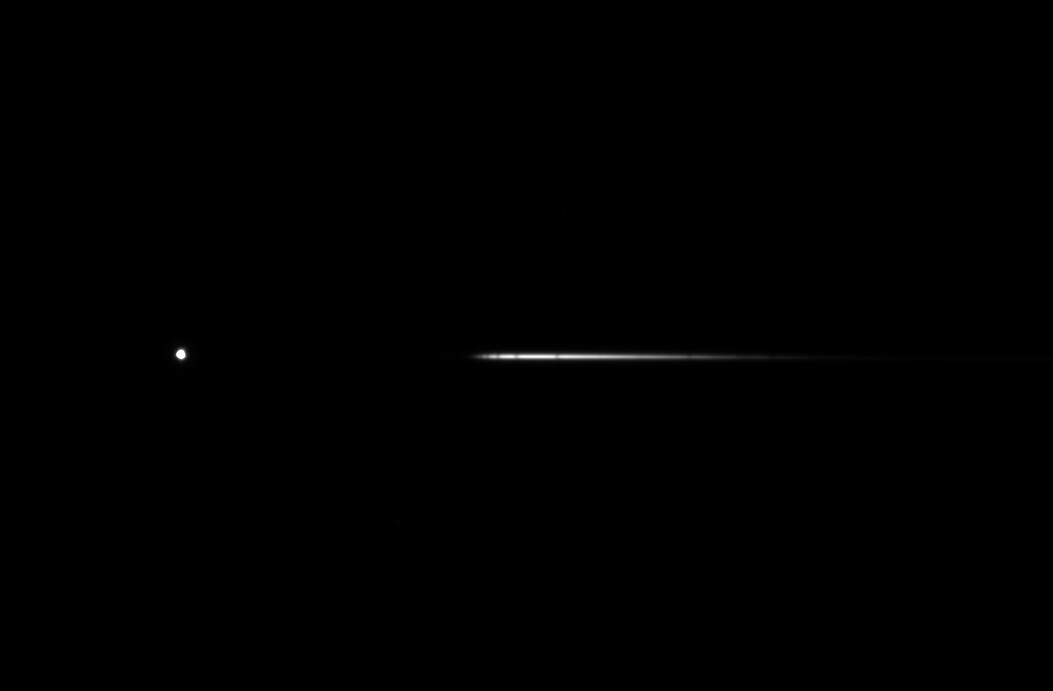
Ok, now let's put the theory aside, and see what a bored amateur astronomer can do. Using a diffraction grating and my scope/camera, I took this image of a star named #Alphecca, the brightest star in the #constellation Corona Borealis. It shows the star itself (on the left) and its spectrum (on the right). This is a black and white camera, so the "rainbow" in in grayscale :/ (this is on purpose, since b/w cameras are more sensitive than color ones).