
Cee · @ceenell
52 followers · 35 posts · Server vis.social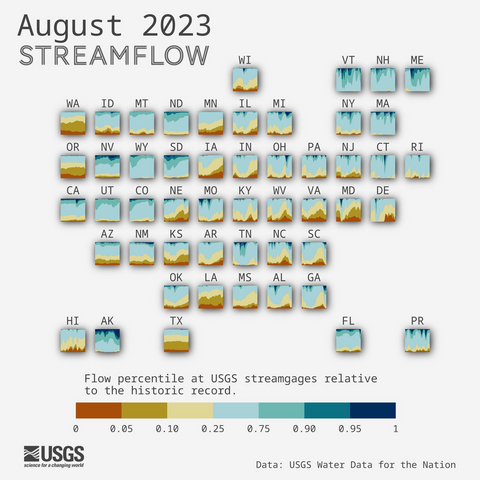
August #streamflow conditions across the U.S. 💧 #DataViz made with #rstats #dataRetrieval https://github.com/DOI-USGS/flow-tilesow-tiles
#DataRetrieval #rstats #dataviz #streamflow

adolflow · @adolflow
90 followers · 21036 posts · Server vis.social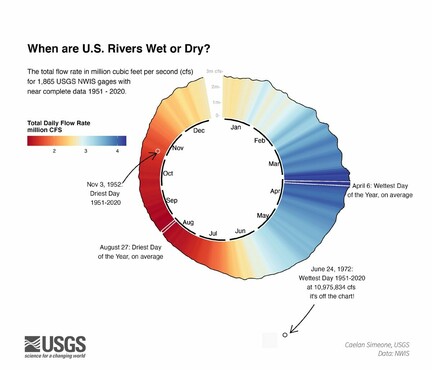
RT @USGS_DataSci@twitter.com
When are rivers wet or dry? To answer this we look at average daily streamflow across 1,865 @USGS_Water@twitter.com gage sites, over 70 years. Day 11 #30DayChartChallenge 📅 Circular by Caelan Simeone from @USGS_OR@twitter.com
#rstats code: https://github.com/USGS-VIZLAB/chart-challenge-22/tree/main/11_circular_csimeone #DataRetrieval
🐦🔗: https://twitter.com/USGS_DataSci/status/1513565235831099394
#DataRetrieval #rstats #30DayChartChallenge
adolflow · @adolflow
82 followers · 21039 posts · Server vis.socialRT @USGS_DataSci@twitter.com
When are rivers wet or dry? To answer this we look at average daily streamflow across 1,865 @USGS_Water@twitter.com gage sites, over 70 years. Day 11 #30DayChartChallenge 📅 Circular by Caelan Simeone from @USGS_OR@twitter.com
#rstats code: https://github.com/USGS-VIZLAB/chart-challenge-22/tree/main/11_circular_csimeone #DataRetrieval
🐦🔗: https://twitter.com/USGS_DataSci/status/1513565235831099394
#DataRetrieval #rstats #30DayChartChallenge