BNHR.XYZ :tux: :qgis: · @bnhrdotxyz
47 followers · 24 posts · Server fosstodon.org3a. For the first visualization:
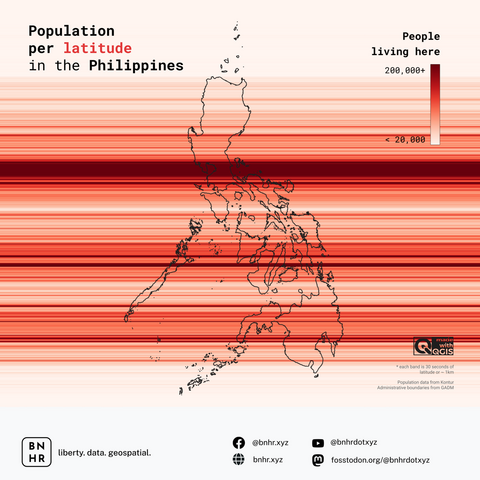
- Apply a graduated symbology or "data-defined" symbology using the pop_sum field.
3b. For the second visualization:
- Use geometry generators and the "scale" expression with pop_sum and max(pop_sum) to create the bar/column graph.
🧵 4/4
#GIS #QGIS #Geospatial #Philippines #Maps #Cartography #MakeBetterMaps #Population #WorldPop #gischat #DataViz #DataVisualization
#gis #qgis #geospatial #philippines #maps #cartography #MakeBetterMaps #population #worldpop #gischat #dataviz #datavisualization
BNHR.XYZ :tux: :qgis: · @bnhrdotxyz
47 followers · 23 posts · Server fosstodon.org1. Used QGIS' "Create grid" algorithm to generate a grid of 30 second (or longitudes) covering the extent of the Philippines.
2. Used the "Zonal Statistics" algorithm to compute for the sum of population (pop_sum) for each latitude (or longitude) using the WorldPop population data.
🧵 3/4
#GIS #QGIS #Geospatial #Philippines #Maps #Cartography #MakeBetterMaps #Population #WorldPop #gischat
#gis #qgis #geospatial #philippines #maps #cartography #MakeBetterMaps #population #worldpop #gischat
BNHR.XYZ :tux: :qgis: · @bnhrdotxyz
47 followers · 22 posts · Server fosstodon.orgThe data used are a population raster (30 second/1km grid) from WorldPop and Philippine admin boundary map from GADM.
The first map visualizes the population per 30 second of latitude (or longitude) using color while the second visualizes the population as a bar/column chart.
The process was once again fairly straightforward.
🧵 2/4
#GIS #QGIS #Geospatial #Philippines #Maps #Cartography #MakeBetterMaps #Population #WorldPop #gischat
#gis #qgis #geospatial #philippines #maps #cartography #MakeBetterMaps #population #worldpop #gischat
BNHR.XYZ :tux: :qgis: · @bnhrdotxyz
47 followers · 21 posts · Server fosstodon.orgFriday is map day! Were you waiting for new maps/visualizations of Philippine population? Well, you're in luck because here's #anotherone (or four really).
This time they are maps of population per latitude (and longitude) in the Philippines. As usual, all the processing and map-making was done in QGIS.
🧵 1/4
#GIS #QGIS #Geospatial #Philippines #Maps #Cartography #MakeBetterMaps #Population #WorldPop #gischat
#anotherone #gis #qgis #geospatial #philippines #maps #cartography #MakeBetterMaps #population #worldpop #gischat
BNHR.XYZ :tux: :qgis: · @bnhrdotxyz
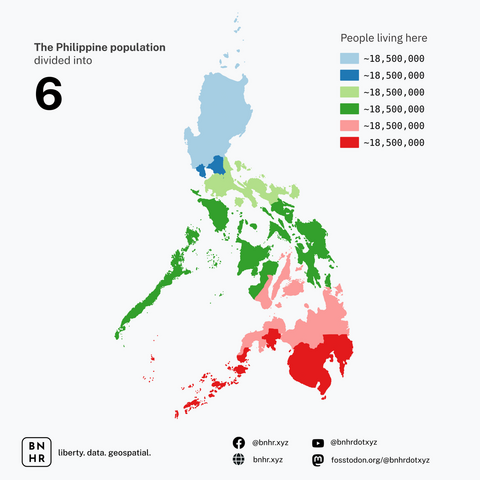
43 followers · 20 posts · Server fosstodon.org- Ran the process dividing the country in 2 to 8 groups.
What do you think?
Note: I included the population of Highly Urbanized Cities and Component Cities in the population of the province/area that they are geographically located in (e.g. Basilan's population includes that of the city of Isabela).
Data from PSA 2020 Census and GADM. Processed in QGIS.
🧵 3/3
#QGIS #GIS #Philippines #Population #Maps #Cartography #MakeBetterMaps #Geospatial #DataViz #gischat #mapstodon
#qgis #gis #philippines #population #maps #cartography #MakeBetterMaps #geospatial #dataviz #gischat #mapstodon
BNHR.XYZ :tux: :qgis: · @bnhrdotxyz
43 followers · 19 posts · Server fosstodon.org- Made a population layer (based on 2020 Census) composed of provinces and NCR cities/municipality.
- Used QGIS' "Order by expression" algorithm to sort the layer features based on their centroid latitude (x(centroid($geometry)).
- Made a script that would divide the sorted features into groups whose population sum was approximately the same (or close to it).
🧵 2/3
#QGIS #GIS #Philippines #Population #Maps #Cartography #MakeBetterMaps #Geospatial #DataViz #gischat #mapstodon
#qgis #gis #philippines #population #maps #cartography #MakeBetterMaps #geospatial #dataviz #gischat #mapstodon
BNHR.XYZ :tux: :qgis: · @bnhrdotxyz
43 followers · 18 posts · Server fosstodon.orgHave you ever wondered what the Philippines would look like if we divided it into areas of equal population? Nope? Only me? Oh well here it is. 😅
The process was fairly straightforward.
🧵 1/3
#QGIS #GIS #Philippines #Population #Maps #Cartography #MakeBetterMaps #Geospatial #DataViz #gischat #mapstodon
#qgis #gis #philippines #population #maps #cartography #MakeBetterMaps #geospatial #dataviz #gischat #mapstodon
BNHR.XYZ :tux: :qgis: · @bnhrdotxyz
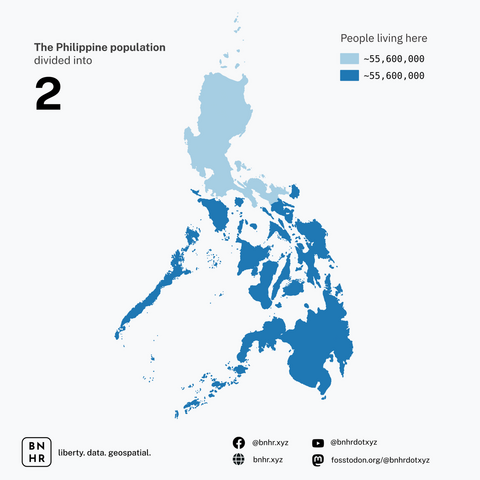
43 followers · 19 posts · Server fosstodon.org- Made a population layer (based on 2020 Census) composed of provinces and NCR cities/municipality.
- Used QGIS' "Order by expression" algorithm to sort the layer features based on their centroid latitude (x(centroid($geometry)).
- Made a script that would divide the sorted features into groups whose population sum was approximately the same (or close to it).
#QGIS #GIS #Philippines #Population #Maps #Cartography #MakeBetterMaps #Geospatial #DataViz #gischat #mapstodon
#qgis #gis #philippines #population #maps #cartography #MakeBetterMaps #geospatial #dataviz #gischat #mapstodon
BNHR.XYZ :tux: :qgis: · @bnhrdotxyz
43 followers · 18 posts · Server fosstodon.orgHave you ever wondered what the Philippines would look like if we divided it into areas of equal population? Nope? Only me? Oh well here it is. 😅
The process was fairly straightforward.
🧵 1/3
#QGIS #GIS #Philippines #Population #Maps #Cartography #MakeBetterMaps #Geospatial #DataViz #gischat
#qgis #gis #philippines #population #maps #cartography #MakeBetterMaps #geospatial #dataviz #gischat
Ben Hur · @benhur07b
112 followers · 165 posts · Server mastodon.social2022 #30DayMapChallenge
Day 3: Polygons
Polygon (legend patches)
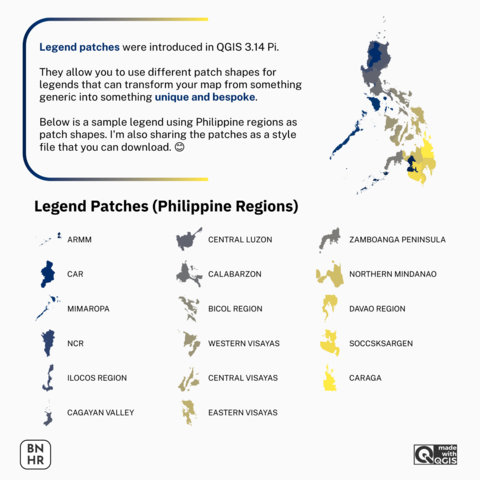
The ability to use custom shapes for legends has been available since QGIS 3.14 Pi. This is a simple way to transform your map from something that looks generic into one that is unique (and sometimes more informative).
1/2
---
#qgis #gis #gischat #polygons #foss4g #philippines #legendpatches #makebettermaps #cartography #maps #spatial
Made with QGIS
Admin boundary data from GADM
#30DayMapChallenge #qgis #gis #gischat #polygons #foss4g #philippines #legendpatches #MakeBetterMaps #cartography #maps #spatial
MapAm💜re · @MapAmore
523 followers · 1021 posts · Server en.osm.townRT @BNHRdotXYZ
#QGIS Actions in action. Loading/managing rasters via index map. This one loads Hillshaded #Taal Open LiDAR DSMs.
h/t to @kgjenkins@twitter.com @spatialthoughts@twitter.com and @klaskarlsson@twitter.com
#qgis #Taal #foss4g #MakeBetterMaps


