
Makie · @makie
12 followers · 3 posts · Server julialang.socialRead about the latest news from the Makie universe:
Our v0.19.5 release, developments within the community, and key takeaways from #MakieCon23,
E.g. how to visualize 2.7 billion points interactively⚡🚀
https://blog.makie.org/blogposts/May-2023-News.html
#JuliaLang #DataViz #Makie
#makiecon23 #julialang #dataviz #Makie

· @cormullion
143 followers · 88 posts · Server julialang.social
Next week, starting Wednesday 18th, the Makie conference, MakieCon.
https://www.youtube.com/watch?v=anpmViaVEtU
More details here:
https://www.bgc-jena.mpg.de/5632072/makiecon.html
#makie #makiecon #makiecon2023 #julia #julialang #julialanguage
#Makie #makiecon #makiecon2023 #julia #julialang #julialanguage
· @cormullion
143 followers · 88 posts · Server julialang.socialNext week, starting Wednesday 18th, the Makie conference, MakieCon.
More details here:
https://www.bgc-jena.mpg.de/5632072/makiecon.html
#makie #makiecon #makiecon2023 #julia #julialang #julialanguage
#Makie #makiecon #makiecon2023 #julia #julialang #julialanguage

Lazaro Alonso · @LazaroAlonso
178 followers · 31 posts · Server julialang.socialAsteroid Impact - 66 Million Years Ago. The next 48 hours after impact. #tsunami #now #Yucatán #Mexico. You can also explore this using #julialang and #makie. See #code (simplified version) https://beautiful.makie.org/dev/extinction_event/
#tsunami #now #yucatan #mexico #julialang #Makie #code
Lazaro Alonso · @LazaroAlonso
157 followers · 21 posts · Server julialang.social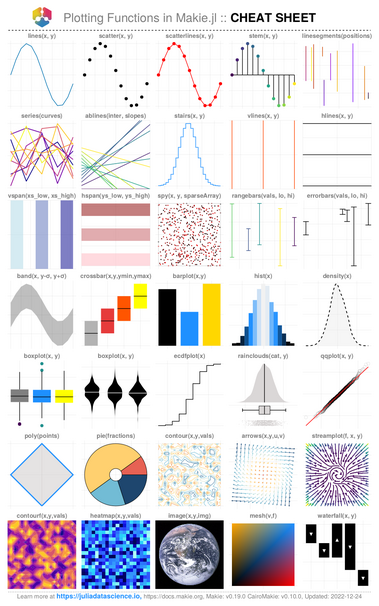
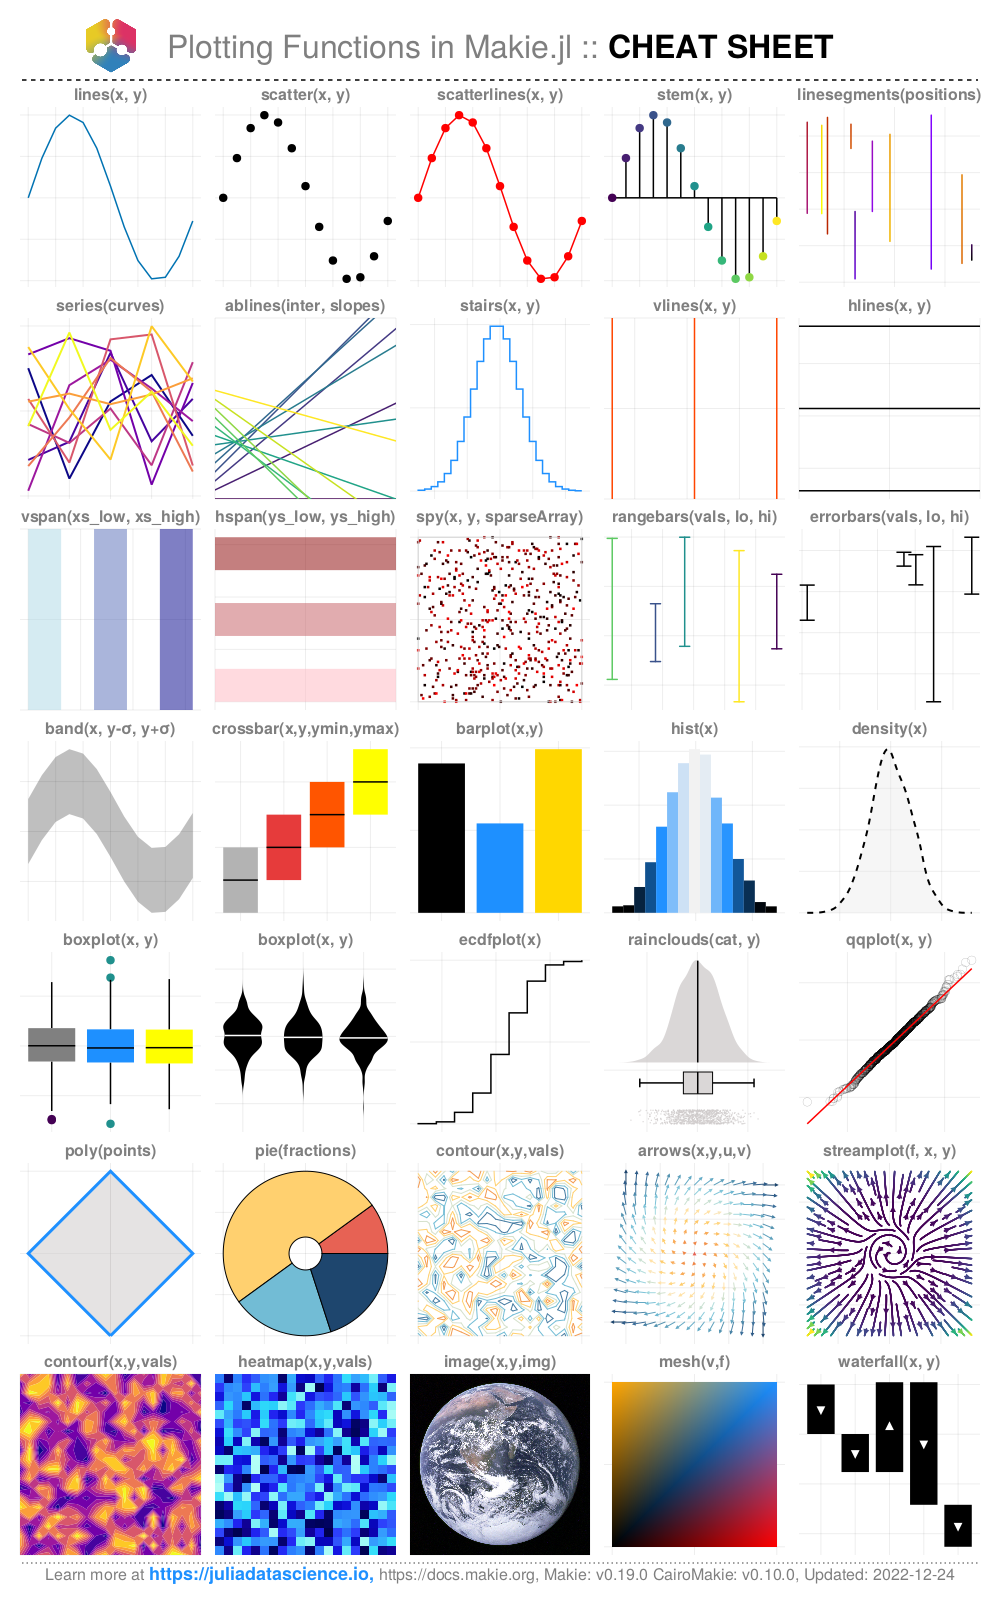
As part of the new added chapters and upcoming updates to https://juliadatascience.io we have new cheat sheets for plotting Makie functions. Second printed edition is coming soon. However, you can support the project today by donating here: https://opencollective.com/juliadatascience #books #coding #datascience #datavis #julialang #makie
#books #coding #datascience #datavis #julialang #Makie

Dr. Cécile Ané :julia: · @cecileane
194 followers · 46 posts · Server julialang.socialI normally use #ggplot2 in #rstat for #DataVisualization.
I gave #julialang another try. Success this time! using #AlgebraOfGraphics.jl (aka #AoG). It has an easy syntax coming from ggplot2. It's based on the super cool package #Makie.jl: faceting, grid plots and nested plots are made easy.
I could have used more help from the AoG documentation, but these tutorials were a fantastic complement: https://tutorials.pumas.ai/html/PlottingInJulia/.
#ggplot2 #rstat #datavisualization #julialang #algebraofgraphics #aog #Makie #juliaplots
Lazaro Alonso · @LazaroAlonso
79 followers · 8 posts · Server julialang.socialFor some time I have meant to show in action Zarr.jl (for cloud store data), YAXArrays.jl and Makie.jl Here an animation doing that with CMIP6 data output, Earth temperature January 2030 [because is freely available].
- code: https://github.com/lazarusA/JuliaProgramming2022/blob/main/Visualization/zarrExample/zarr_ex.jl
- https://juliaio.github.io/Zarr.jl/latest/tutorial/
- https://juliadatacubes.github.io/YAXArrays.jl/dev/
- https://docs.makie.org/stable/
#datavis #dataviz #datavisualization #julialang #makie #coding #programming #cloud #data #science
#datavis #dataviz #datavisualization #julialang #Makie #coding #programming #cloud #data #science

Fábio Sodré · @fabiorsodre
6 followers · 8 posts · Server julialang.social
Makie is a data visualization ecosystem for the Julia programming language, with high performance and extensibility. It is available for Windows, Mac and Linux. Check out!
https://twitter.com/LazarusAlon/status/1591901883169636352?t=5ZQgqo6oU07Rl2p8PbUqNg&s=09
Fábio Sodré · @fabiorsodre
6 followers · 8 posts · Server julialang.social
Makie is a data visualization ecosystem for the Julia programming language, with high performance and extensibility. It is available for Windows, Mac and Linux.
https://twitter.com/LazarusAlon/status/1591901883169636352?t=dJBJkbdzokg4OH1d4wiNmQ&s=09
Dr. Cécile Ané · @cecileane
109 followers · 16 posts · Server julialang.social@LazaroAlonso The more I learn about #Makie, the more I like it. Thanks for such cool work! 🎉