
Corinna Balkow · @coba
39 followers · 145 posts · Server gruene.social
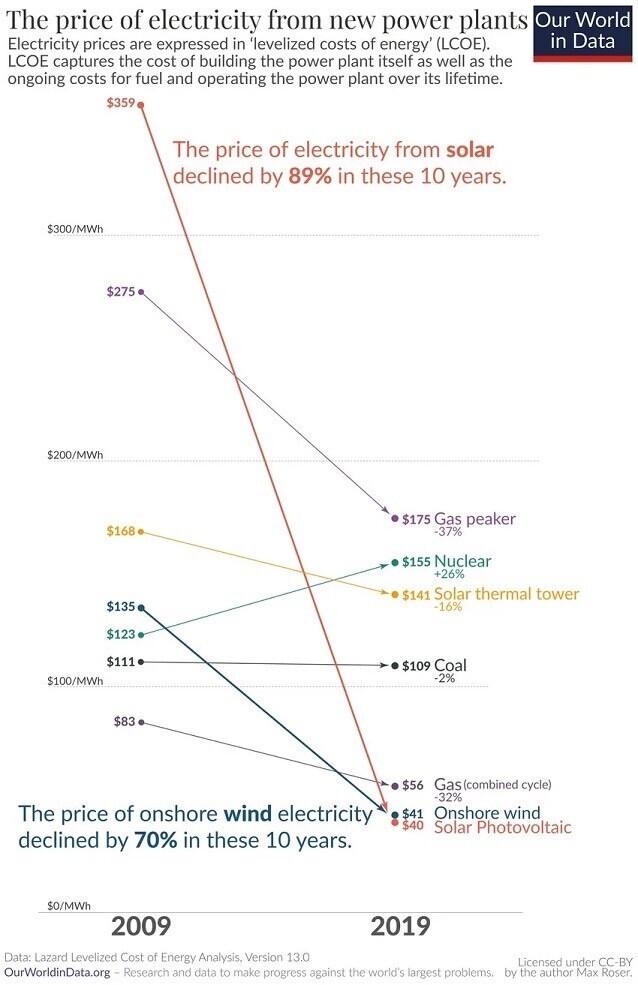
Amazing Graphic to show the price of #electricity from new power plants from #OurWorldInData
Electricity prices are expressed in ‘levelized costs of energy’ (LCOE). LCOE captures the cost of building the power plant itself as well as the ongoing costs for fuel and operating the power plant over its lifetime.
Solar Photovoltaic Price fell from $359 in 2009 to $40 in 2019. That is a decline of 89% !
The price for Gas fell from $275 to $175.
The price for nuclear rose from $123 to $155

Les voix du nucléaire · @voixdunucleaire
467 followers · 885 posts · Server mastodon.cipherbliss.com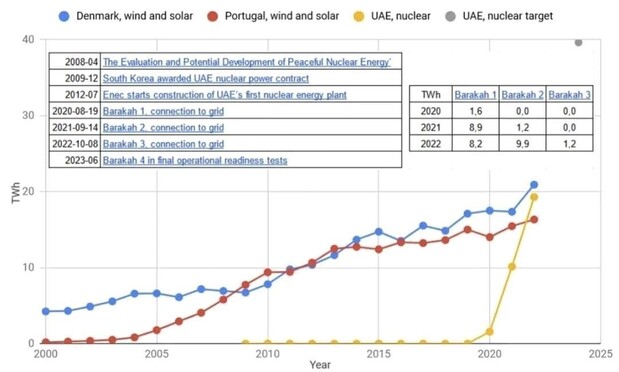
Avec la mise en service de leur première centrale nucléaire construite en une décennie, les Émirats arabes unis #UAE ont déjà dépassé le Portugal, et sont sur le point de dépasser le Danemark en matière de génération d'électricité provenant des nouvelles capacités bas-carbone déployées.
Et il n'y a encore que 3 réacteurs sur 4 qui sont en fonctionnement, le dernier étant dans sa dernière phase de tests avant démarrage.
Ces unités produiront bientôt plus d'#électricité que l'ensemble des installations éoliennes et solaires danoises, et le double en 2024, de manière fiable et pilotable, pour 60 ans au moins.
Se substituant directement au gaz fossile, cette montée en puissance de la centrale nucléaire de #Barakah engendre le recul symétrique de la génération d'électricité au gaz du pays : https://lnkd.in/eJyCchmu (#OurWorldInData)
D'ici un an environ, une fois ses 4 réacteurs en vitesse de croisière, la centrale de Barakah couvrira un quart de l'approvisionnement électrique des Émirats arabes unis.
Le site de cette centrale dispose encore d'espace disponible, et des discussions sont en cours pour la construction de deux autres réacteurs.
On notera enfin que ça n'empêche pas les EAU d'investir dans les énergies renouvelables, le pays développant en parallèle ses capacités solaires, à concentration et photovoltaïques.
#transitionénergétique #décarbonation #casestudy #togetherisbetter
Graphique de Steve Loftus @LoftusSteve@twitter.com
#uae #electricite #barakah #OurWorldInData #transitionenergetique #Decarbonation #casestudy #togetherisbetter

Dick Smiths Fair Go Supporters · @dsfgs
174 followers · 14097 posts · Server activism.openworlds.info@rose_myrtle @TMakarios
There are many ways to lie with statistics.
We don't mean any disrespect, but normally when someone asks this question, someone will quote #OurWorldInData to try to reassure everyone that everything is fine.
So when the same just happened here, we were not surprised. We are sure that Tim has the best of intentions and found what came up in particular search results.

OpenStreetMap BaWü · @OSM_tourism
107 followers · 158 posts · Server en.osm.town
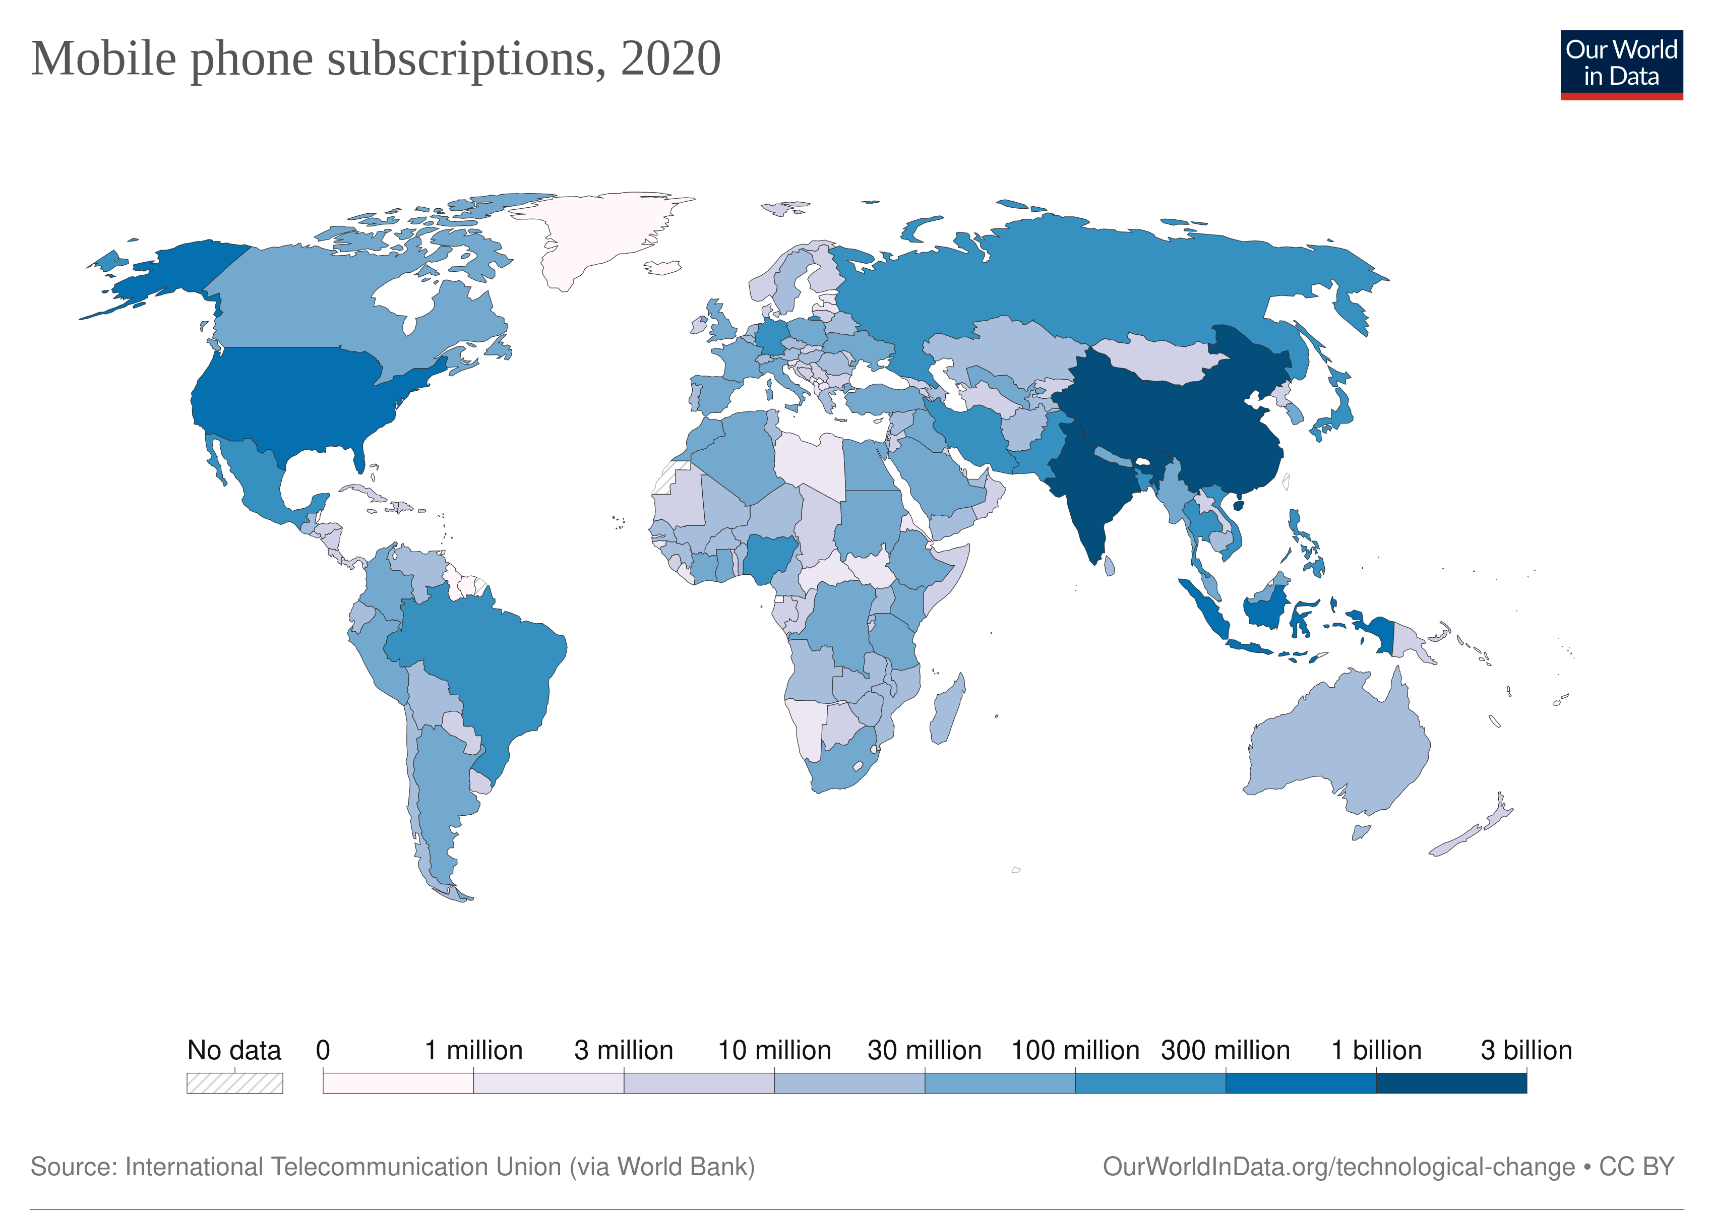
Charts on technological change by #OurWorldinData :
• #Population using the #Internet 🌐 https://ourworldindata.org/grapher/share-of-individuals-using-the-internet
• #Communication 📶 #technologies https://ourworldindata.org/grapher/ict-adoption-per-100-people
• #MobilePhone 📱 subscriptions https://ourworldindata.org/grapher/mobile-cellular-subscriptions-by-country
#Nevertheless there are scores of small businesses with neither a detailed #OpenStreetMap 🗺️ entry https://wiki.openstreetmap.org/wiki/Tourism_tag_overview nor a #website 💻 mentioning what they offer 🤔 (unless the latter is also easy to achieve https://wordpress.com/themes/free)
#OurWorldInData #population #internet #communication #technologies #mobilephone #nevertheless #OpenStreetMap #website
OpenStreetMap BaWü · @OSM_tourism
107 followers · 158 posts · Server en.osm.townCharts on technological change by #OurWorldinData :
• Share of the #population using the #Internet 🌐 https://ourworldindata.org/grapher/share-of-individuals-using-the-internet
• #Communication 📶 #technologies https://ourworldindata.org/grapher/ict-adoption-per-100-people
• #MobilePhone 📱 subscriptions https://ourworldindata.org/grapher/mobile-cellular-subscriptions-by-country
#Nevertheless there are scores of small businesses with neither a detailed #OpenStreetMap 🗺️ entry https://wiki.openstreetmap.org/wiki/Tourism_tag_overview nor a #website 💻 mentioning what they offer 🤔 (unless the latter is also easy to achieve https://wordpress.com/themes/free)
#OurWorldInData #population #internet #communication #technologies #mobilephone #nevertheless #OpenStreetMap #website

Rheintau · @Rheintau
1 followers · 28 posts · Server nrw.social
A positive message on human behavior in respect of preserving our world 🌍.
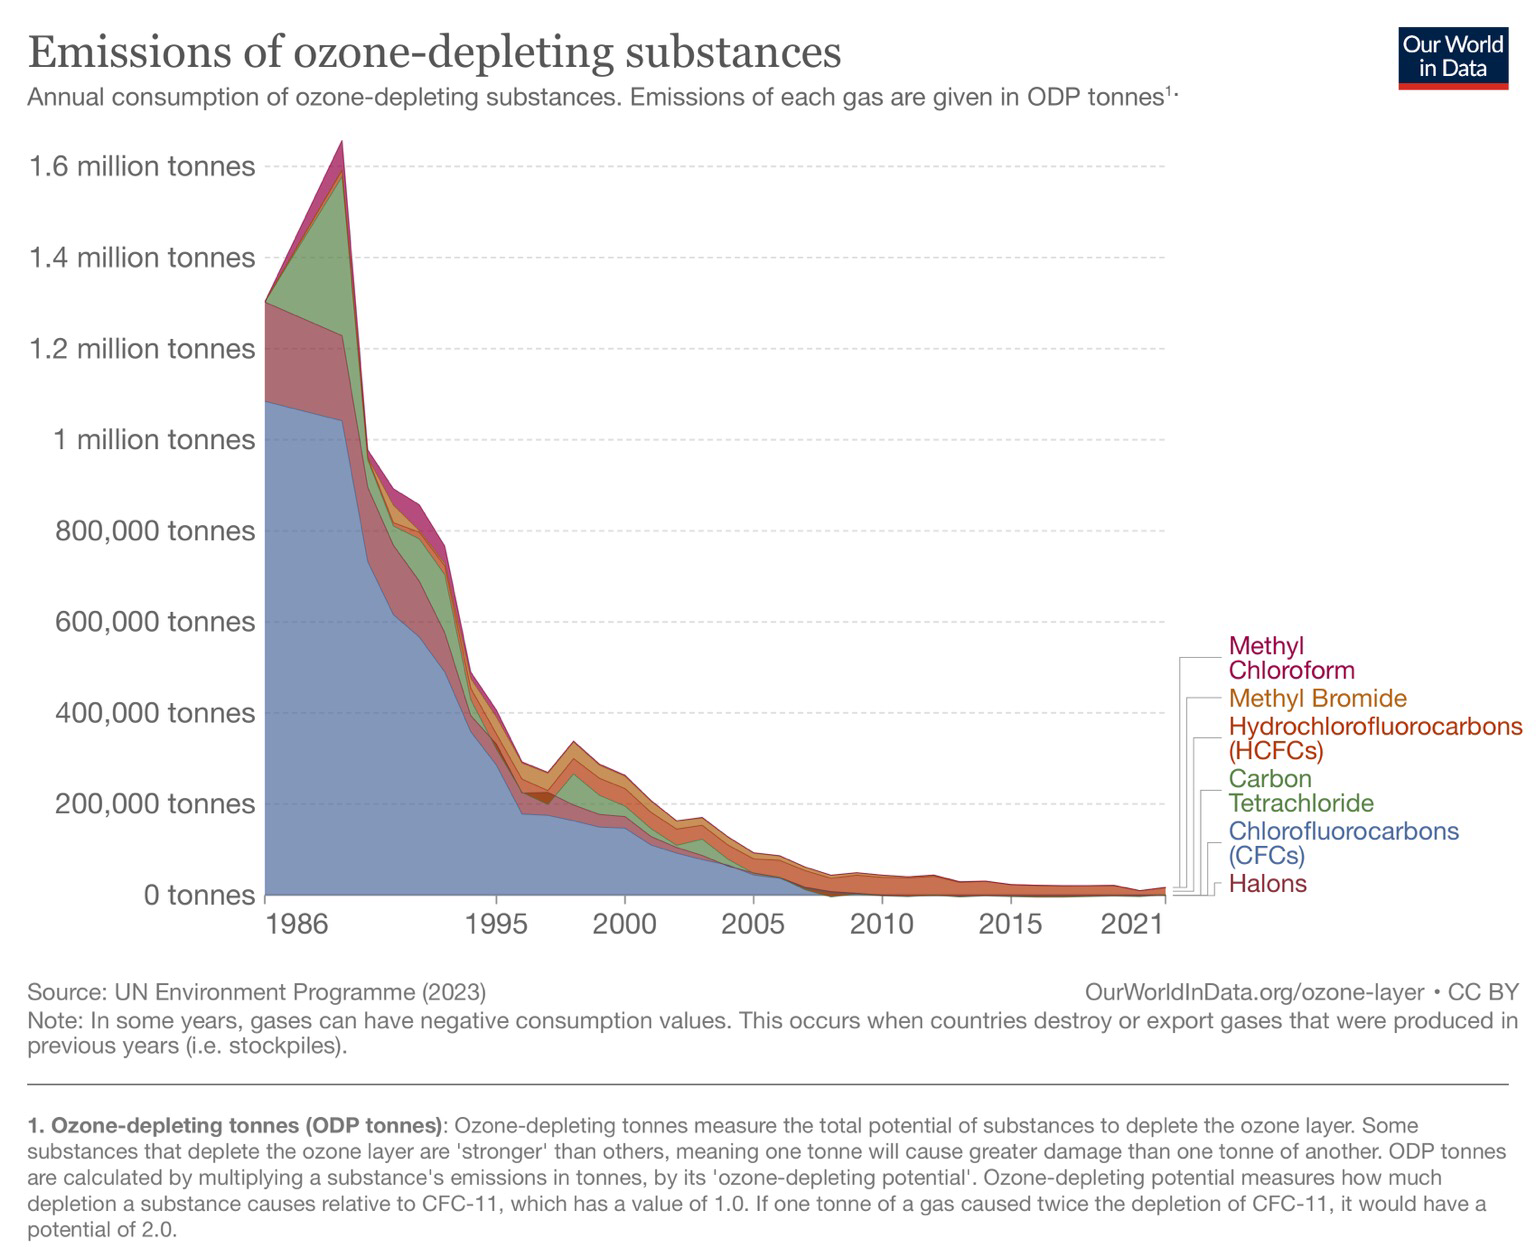
♻️Emissions of substances that deplete the ozone layer have fallen by more than 99%✅
Since the Montreal agreement entered into force in 1989, global emissions of ozone-depleting substances have fallen by more than 99% as manufacturers have substituted them for less harmful alternatives.
A positive message 😀in an often „grey“ reality. Thanks to: #ourworldindata #sustainability #greentech
#OurWorldInData #sustainability #greentech

Albert Cardona · @albertcardona
1380 followers · 756 posts · Server mathstodon.xyz
@photovotary @lhgmk2 For "news" I prefer to read the data directly, as smoothed out into digestible, interactive graphs by "Our world in data" https://ourworldindata.org/ , a product of the UK-based charity Global Change Data Lab. A low pass filter, one gets the interannual trends instead of the latest horror du jour.
#OurWorldInData

anlomedad · @anlomedad_real
339 followers · 1067 posts · Server norden.social@estebanmoro Only a matter of time that #OurWorldInData is going to host a dedicated chapter and charts 😁

Sivathan · @Sivathan
42 followers · 529 posts · Server mas.to
Dr Alessio Veneziano 💀🦧 · @AVeneziano
98 followers · 60 posts · Server mastodon.online
Plant-based meat substitutes have lower carbon footprint than most meat and dairy products!
Let's give an hooray to #vegetarians and #vegans!
The analysis is from Hanna Ritchie from #OurWorldInData @ourworldindata (She is absolutely great with data and communication!)
https://hannahritchie.substack.com/p/carbon-footprint-meat-substitutes
#OurWorldInData #vegans #vegetarians
Dr Alessio Veneziano 💀🦧 · @AVeneziano
78 followers · 44 posts · Server mastodon.online
Plant-based meat substitutes have lower carbon footprint than most meat and dairy products!
Let's give an hooray to #vegetarians and #vegans!
The analysis is from Hanna Ritchie from #OurWorldInData @ourworldindata (She is absolutely great with data and communication!)
https://hannahritchie.substack.com/p/carbon-footprint-meat-substitutes
#OurWorldInData #vegans #vegetarians
Dr Alessio Veneziano 💀🦧 · @AVeneziano
79 followers · 44 posts · Server mastodon.online
Plant-based meat substitutes have lower carbon footprint than most meat and dairy products!
Let's give an hooray to #vegetarians and #vegans!
The analysis is from Hanna Ritchie from #OurWorldInData @ourworldindata (She is absolutely great with data and communication!)
https://hannahritchie.substack.com/p/carbon-footprint-meat-substitutes
#OurWorldInData #vegans #vegetarians

Joop #AlleBurgers #zerocovid · @joopdelfijn
291 followers · 548 posts · Server mstdn.social@jbond True. Only, in the Netherlands there is not even a possibility to report a positive RAT, as I believe in the UK there is.
Until last spring the Dutch #ZeroCovid movement @Containmentnu - @alleburgers - @AlleHandenSamen regularly checked the world #covid19 infection statistics, e.g. #OurWorldInData , bc it offered useful comparisons. No more. Especially the Dutch data have become utterly useless. All we have left is wastewater reports.
#OurWorldInData #COVID19 #ZeroCovid
gentlegardener · @gentlegardener
111 followers · 464 posts · Server mastodon.scot@Pam17 @sociology @conradhackett am sure your Dept of Ag and #ourworldindata have some inkling for CA.
gentlegardener · @gentlegardener
111 followers · 464 posts · Server mastodon.scot@Pece @BeTongLen @conradhackett @sociology Thanks for sourcing #ourworldindata.org info.

lukyluket · @lukyluket
21 followers · 18 posts · Server scipost.social
Looking closer to the data https://ourworldindata.org/explorers/co2?tab=map&time=2021&facet=none&country=CHN~USA~IND~GBR~OWID_WRL&Gas=CO%E2%82%82&Accounting=Production-based&Fuel+or+Land+Use+Change=All+fossil+emissions&Count=Per+capita there is in Europe one gold medal....
Can you spot it out?
#Emissions #OurWorldInData #ClimateChange #ClimateJustice
#emissions #OurWorldInData #climatechange #ClimateJustice

Tykayn · @tykayn
-1 followers · 35083 posts · Server mastodon.cipherbliss.com
bel outil qui vient de sortir pour comparer les futurs énergétiques des différents scénarios. vous pouvez y comparer les mix énergétiques et électriques, l'énergie primaire et finale, récupérer les données en format json, comparer l'empreinte carbone et la demande en métaux critiques des différentes trajectoires. ça s'appelle #Metawatt, c'est porté par un bénévole qui reprend les données de différents rapports, Thimothée Jaussoin, le tout à source ouverte :
#giec #rte #ademe #belfort #cop27 #negawatt #climat #chatbongaz #sortirDesFossiles #snbc #carbon4 #urgenceClimatique #énergie #opendata #ourworldindata
#Metawatt #giec #rte #ademe #belfort #COP27 #negawatt #climat #chatbongaz #sortirDesFossiles #snbc #carbon4 #urgenceclimatique #énergie #opendata #OurWorldInData
Dick Smiths Fair Go Supporters · @dsfgs
178 followers · 12399 posts · Server activism.openworlds.info
Dick Smiths Fair Go Supporters · @dsfgs
178 followers · 12399 posts · Server activism.openworlds.info
xriss · @xriss
198 followers · 3982 posts · Server troet.cafe@SebastianGallehr
Genau die von Dir geforderten Zahlen findest du aggregiert beim RKI und mehr oder weniger gut bei den Landkreisen und Ländern. Die Zeitungen leisten hier auch hervorragende Arbeit.
Projekte wie #OurWorldInData erlauben dir, eigene Ansichten zu erzeugen.
Kennzahlen gibt es auch, sind die Ampel oder Warnstufensysteme der Länder.
Wenn die aber ständig angezweifelt werden, dann bekomme ich Panik.