Michael Sumner · @mdsumner
402 followers · 3023 posts · Server fosstodon.orgWill Deakin · @wnd
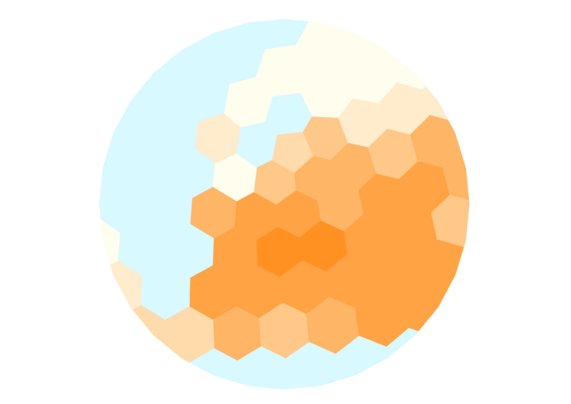
47 followers · 198 posts · Server fosstodon.orgI have been working on a set of hierarchical hexagonal European population projections based on @WorldPopProject using @qgis @geopandas and #rasterio
Will Deakin · @wnd
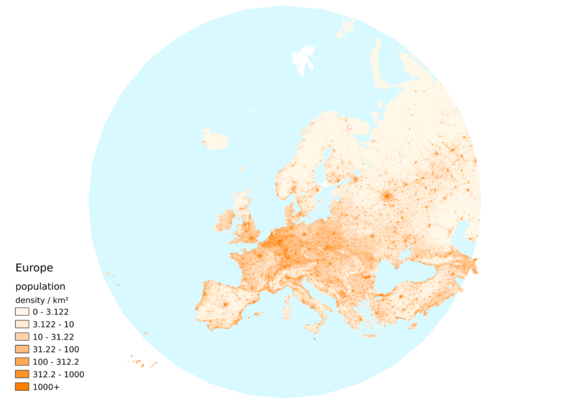
47 followers · 195 posts · Server fosstodon.orgThis is then a population density render using @qgis @geopandas and #rasterio 1km² #population data at an #European scale including a reasonable chunk of #EasternEurope
#Rasterio #population #european #easterneurope
Luke Seelenbinder🇨🇭🇪🇪🇺🇸 · @ls
77 followers · 64 posts · Server hachyderm.ioJust 😍
I couldn't wait, so here's a work-in-progress #mosaic of #SwissTOPO aerial imagery. All thanks to #Python, #RasterIO, #GDAL, and a few late night coding sessions.
I can't get over the quality of these images, especially that water. ✨
#mosaic #swisstopo #python #Rasterio #gdal
Bill · @bil
436 followers · 174 posts · Server vis.socialHas anyone in the maphive used #GDAL or #rasterio to sieve *a targeted value* in a #raster
I'm having some success with these tools to weed out small polygons globally, but I'm actually aiming to affect one DN/class and not the others.
Luke Seelenbinder🇨🇭🇪🇪🇺🇸 · @ls
73 followers · 43 posts · Server hachyderm.ioAfter fighting #GDAL, #RasterIO, and a million other tools for a couple evenings, I finally have a pipeline that can create unified Slippy #map tiles from a mix of #GeoTIFFs and other tiles, all across multiple projections!
It feels like a huge win on the way to a scalable raster pipeline.
I'm sure this is child's play for experienced raster data wranglers, but it feels so good for my first major success!
#gdal #Rasterio #map #geotiffs
Richard · @richardvenusfo
229 followers · 1640 posts · Server fosstodon.org@TheRealJimShady Yeah, thanks had not seen that #rasterio #python #geopandas
Javed Ali · @javedali
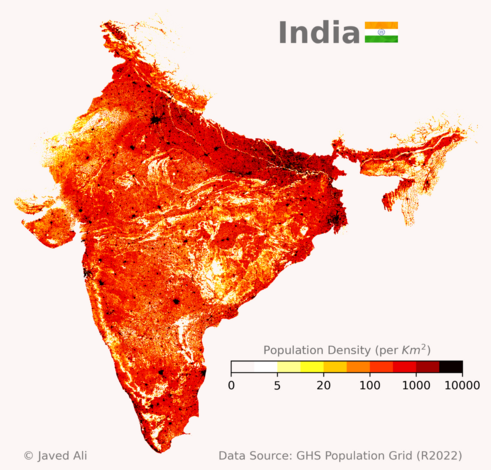
114 followers · 6 posts · Server fediscience.orgPopulation density map of #India 🇮🇳.
On the map, you can see many dark hotspots denoting densely populated cities and towns, mixed in with lighter regions with less people. All major #Indian cities show high population densities, including #NewDelhi, #Kolkata, #Chennai, #Bengaluru, #Hyderabad, and #Mumbai.
I created this map in #python using #matplotlib #geopandas #rasterio packages. For population data, I used the 2022 GHS population grid data.
#dataviz #datavisualization #30DayMapChallenge #Rasterio #geopandas #matplotlib #python #mumbai #Hyderabad #bengaluru #Chennai #kolkata #newdelhi #indian #india
Vikki :verified: · @DataScienceNot2
590 followers · 126 posts · Server tech.lgbt#30DayMapChallenge day 15 - Food/Drink
Feeling pretty proud of myself to have made it to the halfway point. I feel like I've learned a lot so far but there have been some really cool maps I've seen others do which has #inspired me to explore new tools😊
Today I used raster data to create a #topography map of the #Champagne region of #France. I used #QGIS to manually draw a .shp to clip the raster and then #rasterio, #matplotlib, #earthpy and #numpy to build the map.
#30DayMapChallenge #inspired #topography #champagne #france #qgis #Rasterio #matplotlib #earthpy #numpy #datadon #datascience
sirhc · @sirhc
57 followers · 94 posts · Server fosstodon.orgsometimes you go to do a quick thing and it turns into a long thing that should have been a quick thing if you had remembered a thing. Anyway... here's a tale of reprojecting a epsg:4326 geoTIFF to web mercator https://chrishavlin.github.io/post/to_web_mercator_1/ #python #rasterio #maps


