
Steven P. Sanderson II, MPH · @stevensanderson
163 followers · 781 posts · Server mstdn.social
Do you want to visualize specific trends or patterns in your data? Try plotting a subset of your data in R!
Here are some examples:
🚀 Plot a subset of the mtcars dataset that contains only cars with a horsepower of greater than 150.
🚀 Plot a subset of the iris dataset that contains only setosa flowers.
🚀 Plot a subset of the mpg dataset that contains only cars from the United States.
I encourage you to try plotting a subset of your data in R.
Post: https://www.spsanderson.com/steveondata/posts/2023-09-07/

Twiteryeanot 🏴 · @Twiteryeanot
98 followers · 1141 posts · Server mastodon.scot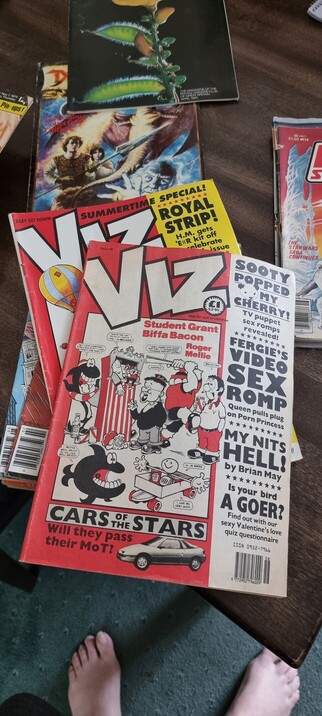

Stoat · @Stoat
660 followers · 5228 posts · Server mastodon.scot

Matthew Black · @NoirMJ
417 followers · 910 posts · Server mstdn.social
Matthew Black · @NoirMJ
414 followers · 890 posts · Server mstdn.social
Matthew Black · @NoirMJ
412 followers · 876 posts · Server mstdn.social
Matthew Black · @NoirMJ
411 followers · 875 posts · Server mstdn.social

nuclearconvoy · @nuclearconvoy
33 followers · 1284 posts · Server mstdn.social
#DanDaDan continues to be a 🔥 read, every volume. #Viz shoukd really fast track the translations, I can't get these fast enough. The art is effortlessly cool, with a whole array of outfits and moods for every character, and the story keeps tugging you along. Silly & dire events
nuclearconvoy · @nuclearconvoy
31 followers · 1269 posts · Server mstdn.social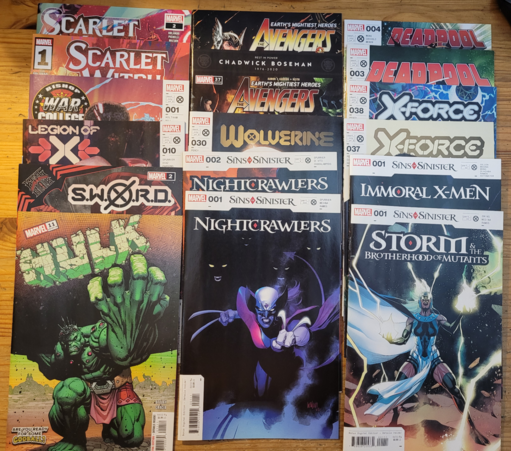
Looking at this, it looks like I've been reading a LOT of comics lately, but you should see my "to read" piles! #comicbooks #Marvel #Viz #indiecomics #image #Spawn #SavageDragon
#savagedragon #spawn #Image #indiecomics #Viz #Marvel #comicbooks

Matthew Black · @NoirMJ
388 followers · 771 posts · Server mstdn.social

Razlo :verified: · @Razlo
85 followers · 473 posts · Server mstdn.social
I haven't read Zom 100, but this anime preview definitely has me interested!

Matthew Black · @NoirMJ
367 followers · 585 posts · Server mstdn.social
Matthew Black · @NoirMJ
351 followers · 550 posts · Server mstdn.social
Matthew Black · @NoirMJ
344 followers · 529 posts · Server mstdn.social
