Ariadne · @ariadne
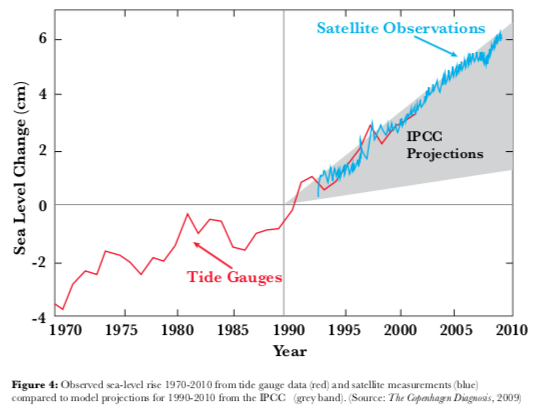
800 followers · 195 posts · Server kolektiva.socialDo you think the the #IPCC and #climate scientists' predictions of #GlobalWarming are far too conservative? Are they fearful of being too alarmist, when alarmed is precisely what we need to be? Always erring on the side of "least drama"?
"Over the past two decades, skeptics of the reality and significance of #anthropogenic climate change have frequently accused climate scientists of ‘‘alarmism’’: of over-interpreting or overreacting to evidence of human impacts on the climate system. However, the available evidence suggests that scientists have in fact been conservative in their projections of the impacts of climate change. In particular, we discuss recent studies showing that at least some of the key attributes of global warming from increased atmospheric greenhouse gases have been under-predicted, particularly in IPCC assessments of the physical science, by Working Group I. We also note the less frequent manifestation of over-prediction of key characteristics of climate in such assessments. We suggest, therefore, that scientists are biased not toward alarmism but rather the reverse: toward cautious estimates, where we define caution as erring on the side of less rather than more alarming predictions. We call this tendency ‘‘erring on the side of least drama (ESLD).’’
- Keynyn Brysse, Naomi Oreskes, Jessica O’Reilly, Michael Oppenheimer,
Climate change prediction: Erring on the side of least drama?,
Global Environmental Change,
Volume 23, Issue 1,
2013,
Pages 327-337,
ISSN 0959-3780,
https://doi.org/10.1016/j.gloenvcha.2012.10.008.
https://sci-hub.hkvisa.net/10.1016/j.gloenvcha.2012.10.008
#ClimateCrisis #AGW #AnthropogenicGlobalWarming #GlobalWarming #Climate #Klima #KlimaKrise #Erderwärmung
#ipcc #climate #globalwarming #anthropogenic #ClimateCrisis #agw #anthropogenicglobalwarming #klima #klimakrise #erderwarmung
Ariadne · @ariadne
739 followers · 156 posts · Server kolektiva.socialHere are the highlights (lowlights) of the #AR6 #IPCC report released today (20. March 2023). At this point, the "Summary for Policymakers" is only available; the longer (full) report is "coming soon" according to the IPCC website. You can download the Summary from the link below.
Observed Warming and its Causes - Global surface temperature was 1.09°C [0.95°C–1.20°C] higher in 2011–2020 than 1850–19006, with larger increases over land (1.59°C [1.34°C–1.83°C]) than over the ocean (0.88°C [0.68°C–1.01°C]).
- Global surface temperature in the first two decades of the 21st century (2001-2020) was 0.99 [0.84 to 1.10]°C higher than 1850-1900. Global surface temperature has increased faster since 1970 than in any other 50-year period over at least the last 2000 years (high confidence).
- The likely range of total human-caused global surface temperature increase from 1850–1900 to 2010–
13 2019 is 0.8°C–1.3°C, with a best estimate of 1.07°C. Over this period, it is likely that well-mixed greenhouse gases (#GHGs) contributed a warming of 1.0°C–2.0°C, and other human drivers (principally aerosols) contributed a cooling of 0.0°C–0.8°C, natural (solar and volcanic) drivers changed global surface temperature by –0.1°C to +0.1°C, and internal variability changed it by –0.2°C to +0.2°C.
- Observed increases in well-mixed #GHG concentrations since around 1750 are unequivocally caused by GHG emissions from human activities over this period. Historical cumulative net #CO2 #emissions from 1850 to 2019 were 2400±240 GtCO2 of which more than half (58%) occurred between 1850 and 1989, and about 42% occurred between 1990 and 2019 (high confidence). In 2019, atmospheric CO2 concentrations (410 parts per
22 million) were higher than at any time in at least 2 million years (high confidence), and concentrations of methane
23 (1866 parts per billion) and nitrous oxide (332 parts per billion) were higher than at any time in at least 800,000 years (very high confidence).
- Global net anthropogenic GHG emissions have been estimated to be 59±6.6 GtCO2-eq9 in 2019, about 12% (6.5 GtCO2-eq) higher than in 2010 and 54% (21 GtCO2-eq) higher than in 1990, with the largest share and growth in gross GHG emissions occurring in CO2 from fossil fuels combustion and industrial processes (CO2-FFI) followed by methane, whereas the highest relative growth occurred in fluorinated gases (F-gases),
30 starting from low levels in 1990. Average annual GHG emissions during 2010-2019 were higher than in any previous decade on record, while the rate of growth between 2010 and 2019 (1.3% year-1) was lower than that
32 between 2000 and 2009 (2.1% year-1). In 2019, approximately 79% of global GHG emissions came from the sectors of energy, industry, transport and buildings together and 22%10 from agriculture, forestry and other land use (AFOLU). Emissions reductions in CO2-FFI due to improvements in energy intensity of GDP and carbon intensity of energy, have been less than emissions increases from rising global activity levels in industry, energy supply, transport, agriculture and buildings. (high confidence)
https://www.ipcc.ch/report/ar6/syr/
video here - https://www.ipcc.ch/report/ar6/syr/
#Climate #ClimateCrisis #GHG #CO2 #Methane #FossilFuels #Earth #GlobalWarming #AGW #AnthropogenicGlobalWarming
#AR6 #ipcc #ghgs #ghg #co2 #emissions #climate #ClimateCrisis #methane #fossilfuels #earth #globalwarming #agw #anthropogenicglobalwarming
