
Joseph Elfelt · @mappingsupport
575 followers · 500 posts · Server m.ai6yr.org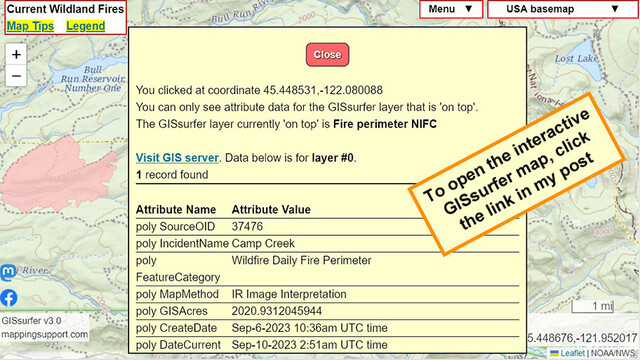
@ai6yr @WXFanatic @bretthoover
GISsurfer uses the #ArcGIS REST API.
For ArcGIS MapServer data that supports 'dynamic layers' that API makes it fairly easy to add labels to the map.
For ArcGIS FeatureServer data that API does not support labels.
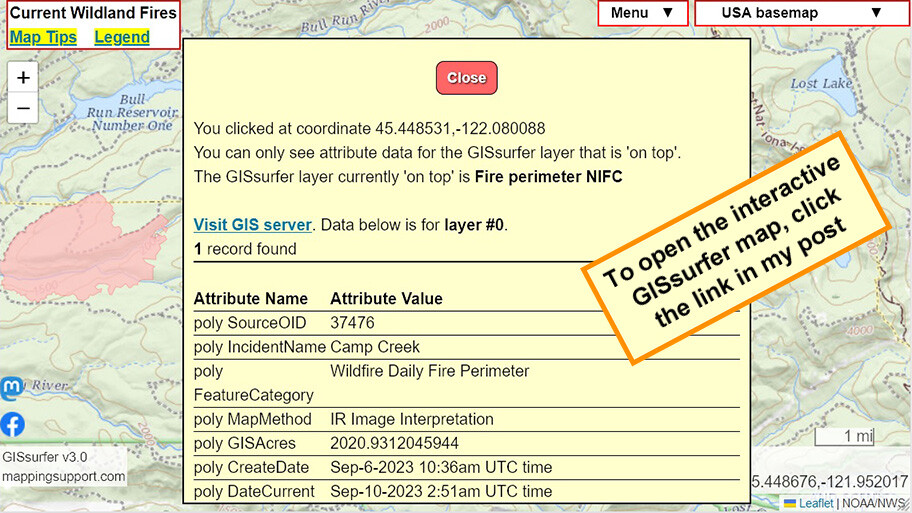
So the only way to see the fire name on a GISsurfer map is to click inside a perimeter. Note that the fire perimeter has to be the 'top' layer. #Wildfire
Open #GISsurfer map:
https://mappingsupport.com/p2/gissurfer.php?center=45.448676,-121.952017&zoom=12&basemap=USA_basemap&overlay=VIIRS_7_day,MODIS_7_day,State_boundary,Fire_perimeter_NIFC&data=https://mappingsupport.com/p2/special_maps/disaster/USA_wildland_fire.txt
AI6YR · @ai6yr
4707 followers · 32081 posts · Server m.ai6yr.org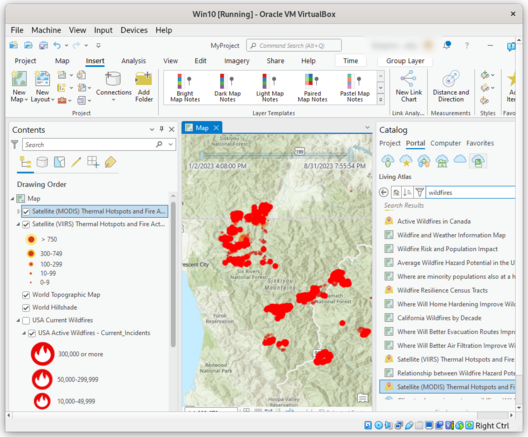
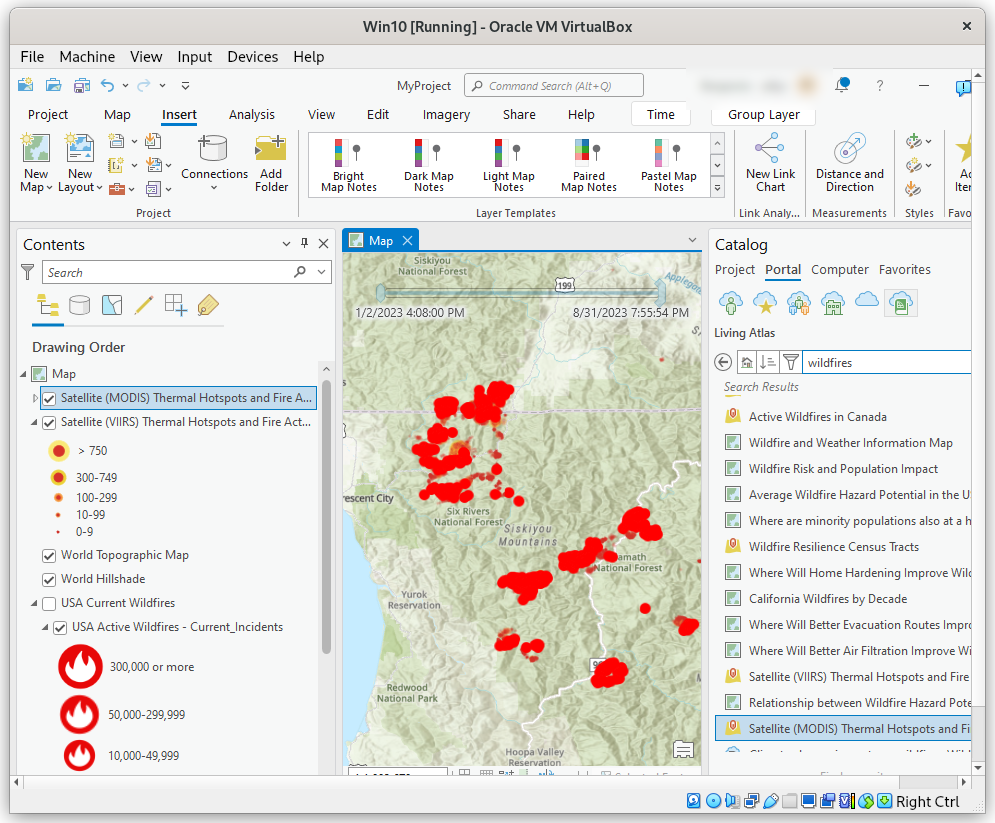
Yay, #ArcGIS Pro runs in #VirtualBox (virtualized Windows on #Linux). Runs pretty fast, and I don't use it too much, so that will work fine.

Kendra K. Levine · @kklevine
734 followers · 1267 posts · Server union.place#map #arcgis #iamtiredandlazyandmybrainisfried
Joseph Elfelt · @mappingsupport
509 followers · 441 posts · Server m.ai6yr.org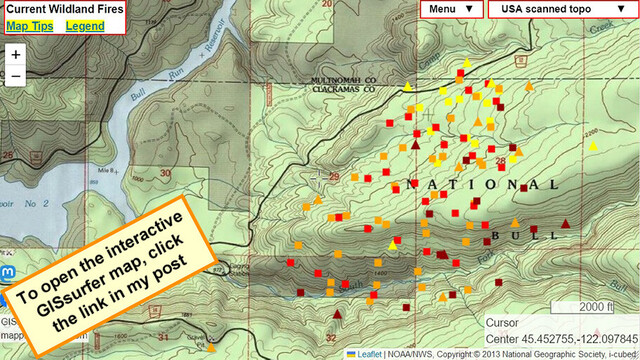
Interactive #GIS map for #CampCreekFire SE of #Portland Oregon and near that town’s water supply.
Dark red symbols are *heat* detections by MODIS and VIIRS satellites within prior 6 hours. This data is not real time, locations are approximate and sometimes ‘false positive”. Two links in upper left corner have more info.
#ORwx #ORfire #WildlandFire #Geospatial #Maps #Mapping #Leaflet #ArcGIS #WebMap
Open #GISsurfer map:
https://mappingsupport.com/p2/gissurfer.php?center=45.452755,-122.097845&zoom=14&basemap=USA_scanned_topo&overlay=VIIRS_7_day,MODIS_7_day,State_boundary&data=https://mappingsupport.com/p2/special_maps/disaster/USA_wildland_fire.txt
#gis #campcreekfire #portland #orwx #orfire #wildlandfire #geospatial #maps #mapping #leaflet #arcgis #webmap #gissurfer
Joseph Elfelt · @mappingsupport
507 followers · 437 posts · Server m.ai6yr.org
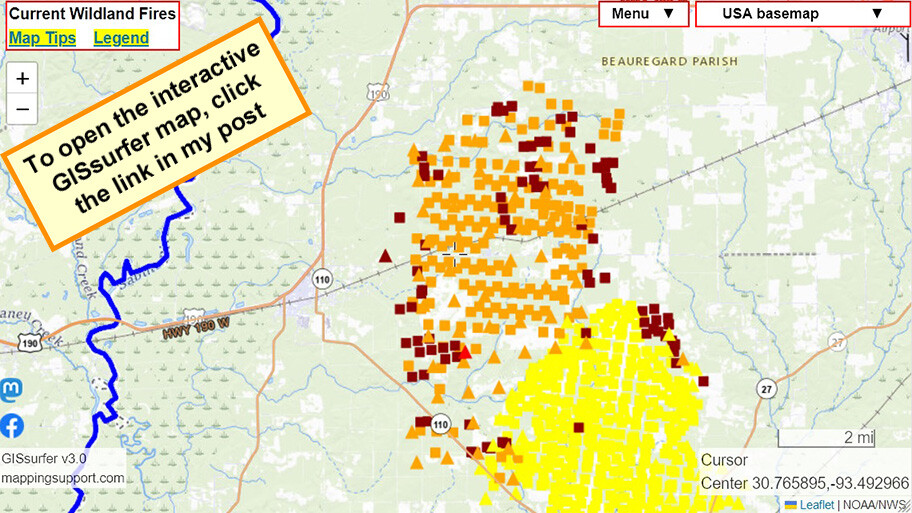
Interactive #GIS map for #TigerIslandFire in SW part of #Louisiana. Town of #Merryville just west of the fire has been evacuated.
Dark red symbols are *heat* detections by MODIS and VIIRS satellites within prior 6 hours. This data is not real time, locations are approximate and sometimes ‘false positive”. Two links in upper left corner have more info.
#LAwx #LAfire #WildlandFire #Geospatial #Maps #Mapping #Leaflet #ArcGIS #WebMap
Open #GISsurfer map:
https://mappingsupport.com/p2/gissurfer.php?center=30.765895,-93.492966&zoom=12&basemap=USA_basemap&overlay=VIIRS_7_day,MODIS_7_day,State_boundary,USA_roads&data=https://mappingsupport.com/p2/special_maps/disaster/USA_wildland_fire.txt
#gis #tigerislandfire #louisiana #merryville #lawx #lafire #wildlandfire #geospatial #maps #mapping #leaflet #arcgis #webmap #gissurfer
Joseph Elfelt · @mappingsupport
498 followers · 430 posts · Server m.ai6yr.org
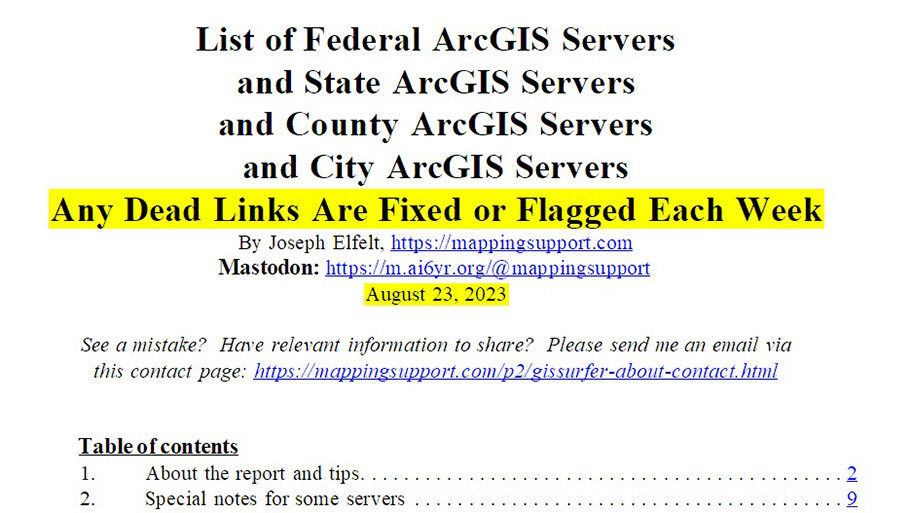
New feature added to curated list of 3,000+ government #ArcGIS server addresses.
The entry for every federal ArcGIS server and state ArcGIS server now shows whether or not that server is hosting any tiled data. #GIS savvy software can display this type of data with XYZ syntax.
See p.5 of the PDF for more information including how to do a google search to check any county/city ArcGIS server for tiled data.
#Spatial #Geospatial #Maps #Mapping #URISA #QGIS
Open PDF:
https://mappingsupport.com/p/surf_gis/list-federal-state-county-city-GIS-servers.pdf
#arcgis #gis #spatial #geospatial #maps #mapping #urisa #qgis
Joseph Elfelt · @mappingsupport
479 followers · 410 posts · Server m.ai6yr.org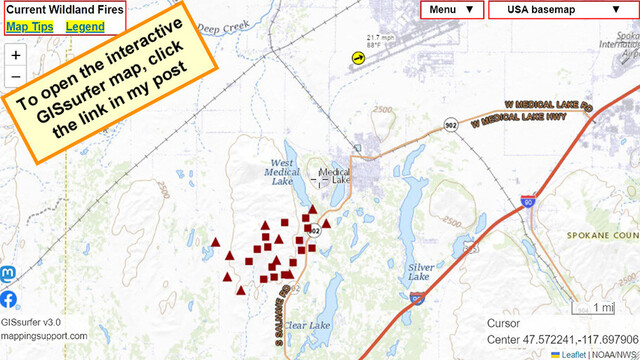
Interactive #GIS map for #GrayFire Spokane County, WA. Town of #MedicalLake (pop 5,000+) ordered to evacuate *now*.
Weather station at airport just to the north shows WSW wind gusting to 31mph. I see reports fire has already jumped the lake on the west side of town.
To get the most benefit from the map see 2 links upper left corner.
#WAfire #WAwx #Wildfire #GIS #Geospatial #Maps #Mapping #Leaflet #ArcGIS #WebMap
Open #GISsurfer map:
https://mappingsupport.com/p2/gissurfer.php?center=47.568592,-117.688465&zoom=13&basemap=USA_imagery&overlay=State_boundary,USA_roads,MODIS_7_day,VIIRS_7_day,Fire_perimeter_NIFC&data=https://mappingsupport.com/p2/special_maps/disaster/USA_wildland_fire.txt
#gis #grayfire #medicallake #wafire #wawx #Wildfire #geospatial #maps #mapping #leaflet #arcgis #webmap #gissurfer

Venya · @venya
313 followers · 623 posts · Server musicians.todayChatting with one of the junior analysts today who is now thinking seriously about pivoting from an application development path he wasn't really enjoying to #GIS and #geospatial analysis just because I showed him some basic cool shit you could do with #ArcGIS server (all we have access to at work) and he found it terribly fun and rewarding.
My main function these days is showing the junior kids cool shit they may not have seen before. I live for these kind of moments.

Tim :dotnet: :csharp: :blazor: · @TimPurdum
617 followers · 103 posts · Server dotnet.social
#GeoBlazor Release v2.3.0 is now available! It includes an array of new features, layers, widgets and more that will take your GeoBlazor experience to new heights. #dotnet #blazor #gis #arcgis
#GeoBlazor #dotnet #blazor #gis #arcgis
Joseph Elfelt · @mappingsupport
477 followers · 408 posts · Server m.ai6yr.org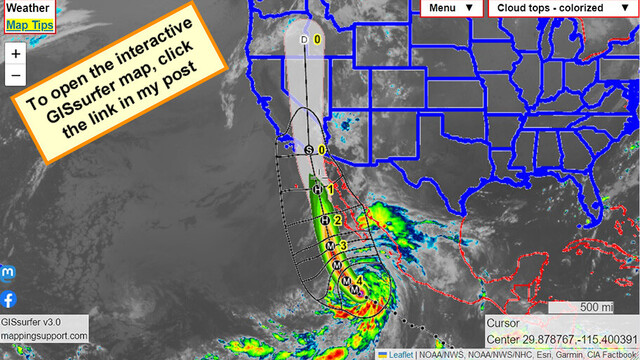
If you open this #HurricaneHilary map and zoom in a bit then labels will appear on the black lines showing the most likely time that tropical storm wind will arrive. Tropical storm wind speeds are in the range 39mph to 73mph.
Map has *lots* of other layers of #GIS weather data you can turn on. Click “Map tips” in upper left corner for help.
#hilary #hurricane #FlashFlood #Geospatial #Maps #Mapping #Leaflet #ArcGIS #WebMap
Open #GISsurfer map:
https://mappingsupport.com/p2/gissurfer.php?center=29.878767,-115.400391&zoom=4&basemap=Cloud_tops_-_colorized&overlay=Country,State_boundary,Forecast_error_cone,Hurricane_wind_64kts_plus,Hurricane/Storm_observed_track,Hurricane/Storm_observed_position,Hurricane/Storm_forecast_track,TS_wind_most_likely_time,Hurricane/Storm_forecast_position&data=https://mappingsupport.com/p2/special_maps/disaster/USA_weather.txt
#hurricanehilary #gis #hilary #hurricane #flashflood #geospatial #maps #mapping #leaflet #arcgis #webmap #gissurfer

Josh Carlson :qgis: · @jcarlson
464 followers · 876 posts · Server mapstodon.spaceThe response from #Esri support contained 5 "workarounds" for their web adaptor not doing the only job it exists to do.
None have worked.
The web adaptor has gone down 32 times in 24 hours under modest loads.
Still using #ArcGIS Enterprise as best we can in spite of sporadic blips in connectivity, but alternatives are actively being investigated.
Can't wait for #FOSS4GNA to attend the #GeoNode / #GeoServer sessions!
#esri #arcgis #foss4gna #geonode #geoserver
Joseph Elfelt · @mappingsupport
478 followers · 398 posts · Server m.ai6yr.org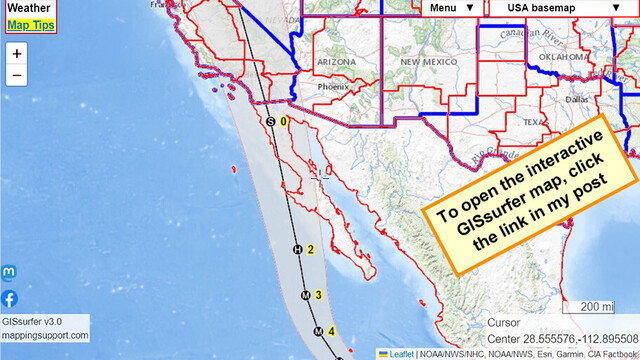
#HurricaneHilary interactive #GIS map. When the map opens the layer with NOAA’s forecast discussion is on top. Click inside any red-outlined area and follow the link. Screenshot from #SanDiego area discussion.
Map has *lots* of weather layers you can turn on but only the ‘top’ layer is clickable. For help please read the “Map tips” link in the upper left corner.
#Geospatial #Maps #Mapping #Leaflet #ArcGIS #WebMap
Open #GISsurfer map:
https://mappingsupport.com/p2/gissurfer.php?center=28.555576,-112.895508&zoom=5&basemap=USA_basemap&overlay=Forecast_error_cone,Hurricane/Storm_observed_track,Hurricane/Storm_observed_position,Hurricane/Storm_forecast_track,Country,State_boundary,Hurricane/Storm_forecast_position,Forecast_discussion&data=https://mappingsupport.com/p2/special_maps/disaster/USA_weather.txt
#hurricanehilary #gis #sandiego #geospatial #maps #mapping #leaflet #arcgis #webmap #gissurfer
Joseph Elfelt · @mappingsupport
473 followers · 396 posts · Server m.ai6yr.org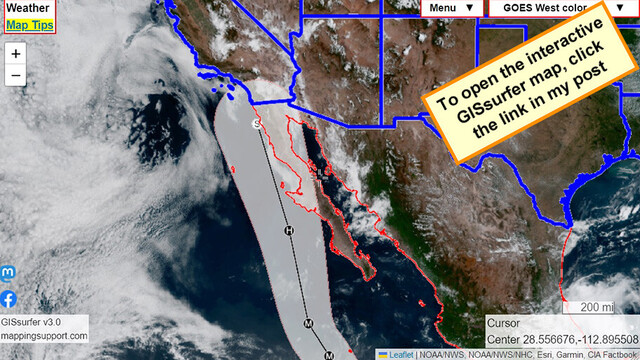
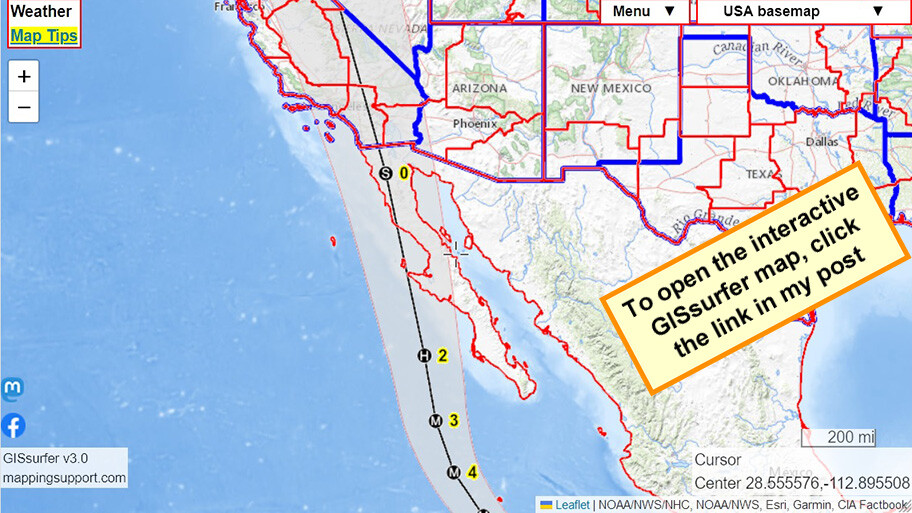
Interactive #GIS map always displays latest forecast for Tropical Storm #Hilary - soon to be #HurricaneHilary. The ‘forecast position’ overlay can be clicked for details.
When the map opens it displays the most recent image from the GOES West satellite. At night - guess what - that image is dark. Of course you can then change to a different basemap.
#SanDiego #CAwx #NVwx #Geospatial #Maps #Mapping #Leaflet #ArcGIS #WebMap
Open #GISsurfer map:
https://mappingsupport.com/p2/gissurfer.php?center=28.556676,-112.895508&zoom=5&basemap=GOES_West_color&overlay=Forecast_error_cone,Hurricane/Storm_observed_track,Hurricane/Storm_observed_position,Hurricane/Storm_forecast_track,Country,State_boundary,Hurricane/Storm_forecast_position&data=https://mappingsupport.com/p2/special_maps/disaster/USA_weather.txt
#gis #hilary #hurricanehilary #sandiego #cawx #nvwx #geospatial #maps #mapping #leaflet #arcgis #webmap #gissurfer
Josh Carlson :qgis: · @jcarlson
462 followers · 873 posts · Server mapstodon.spaceUpdate on the #ArcGIS Enterprise business.
Not one but TWO patches for Web Adaptor IIS reliability, and the problem persists. Server goes incommunicado at entirely modest levels of traffic.
For now, we've just got a PowerShell script running at all times to ping, wait, and possibly recycle the application pool as soon as these shenanigans happen. And to keep a tally of how often this happens. We're at three so far today.
Currently moving as much as we can out of the Data Store and into S3.
Josh Carlson :qgis: · @jcarlson
459 followers · 870 posts · Server mapstodon.spaceGot my hopes up too soon. My #ArcGIS web adaptor continued to freeze up. But they released another web adaptor patch *today*, so let's see if it helps tomorrow when the traffic picks up.
11.0 was able to handle our server traffic without breaking a sweat, so I'm struggling to understand what changed at 11.1 to make it freeze up and quit so much.
#GeoNode, you're looking mighty attractive right now. Contemplating a "both / and" setup, maybe.
Joseph Elfelt · @mappingsupport
464 followers · 382 posts · Server m.ai6yr.org
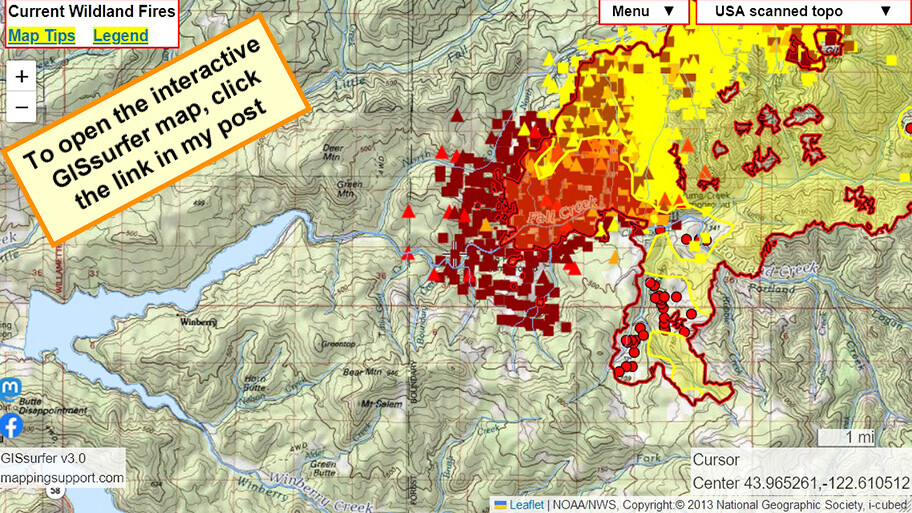
August 14 morning. #BedrockFire east of Eugene Oregon.
Infrared flight last night 10:25pm. IR analyst determined 22,026 acres burned.
Significant fire expansion to the west last night after that IR flight. #RedFlagWarning continues today.
Map has multiple #GIS basemaps and overlays you can turn on/off. For help click “Map tips” upper left corner.
#ORwx #ORfire #Wildfire#Geospatial #Maps #Mapping #Leaflet #ArcGIS #WebMap
Open #GISsurfer map:
https://mappingsupport.com/p2/gissurfer.php?center=43.967733,-122.621155&zoom=12&basemap=USA_scanned_topo&overlay=VIIRS_7_day,MODIS_7_day,State_boundary,Lake_river_stream,USA_roads&fire=OR,Bedrock&data=https://mappingsupport.com/p2/special_maps/disaster/USA_wildland_fire.txt
#bedrockfire #redflagwarning #gis #orwx #orfire #Wildfire #maps #mapping #leaflet #arcgis #webmap #gissurfer
Joseph Elfelt · @mappingsupport
464 followers · 382 posts · Server m.ai6yr.org
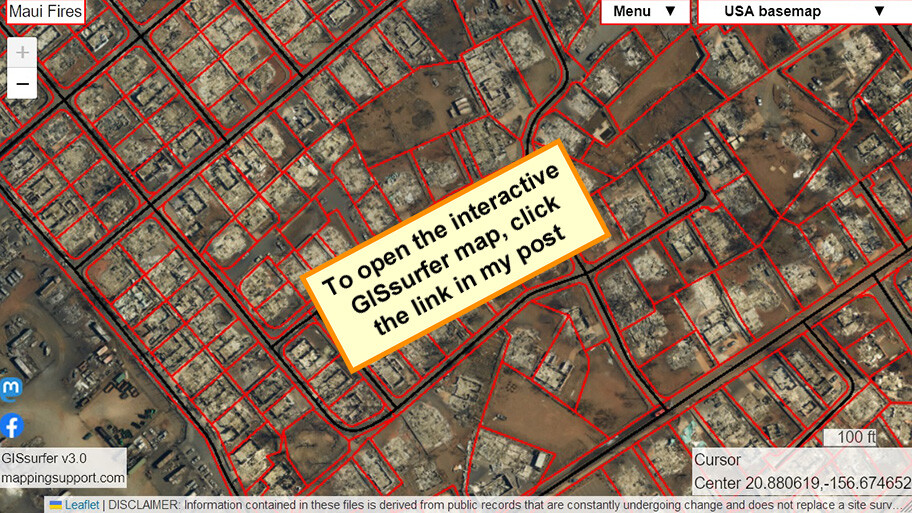
Interactive map showing high resolution aerial photos of the area burned in the #MauiFires. The photos were taken by NOAA on August 11.
Map also shows parcels. Click a parcel to see attribute data.
I am still working to add street names.
#Lahaina #GIS #Geospatial #Maps #Mapping #Leaflet #ArcGIS #WebMap
Open #GISsurfer map:
https://mappingsupport.com/p2/gissurfer.php?center=20.880619,-156.674652&zoom=18&basemap=USA_basemap&overlay=August_11,Maui_roads,Maui_parcels&data=https://mappingsupport.com/p2/disaster/2023/hawaii/Maui_fire_NOAA_aerials.txt
#mauifires #lahaina #gis #geospatial #maps #mapping #leaflet #arcgis #webmap #gissurfer
Joseph Elfelt · @mappingsupport
464 followers · 382 posts · Server m.ai6yr.org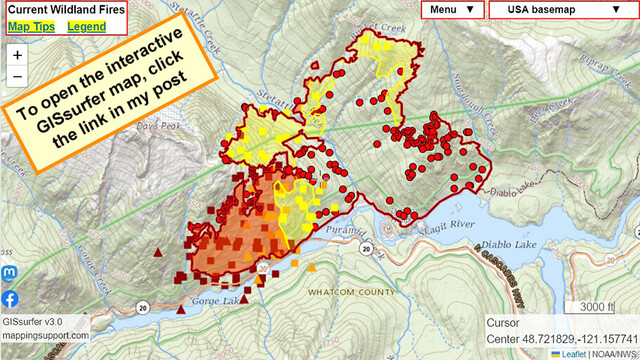
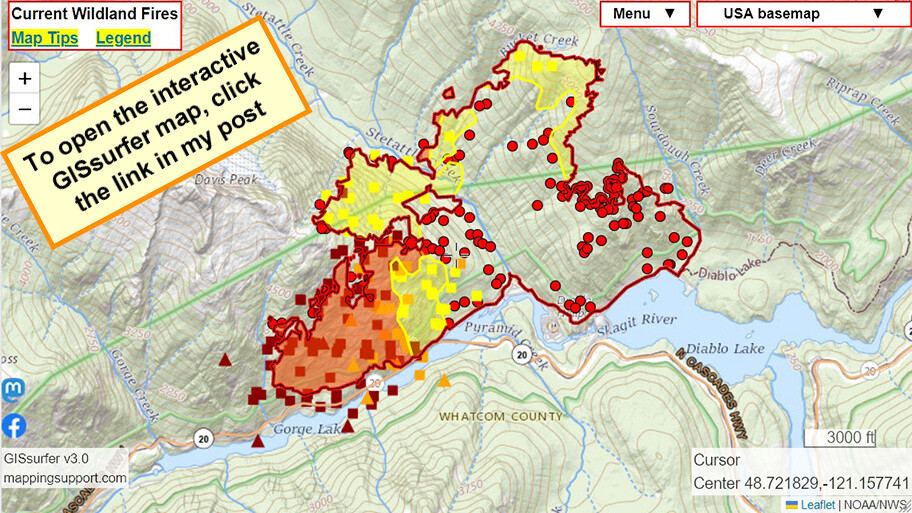
August 13 morning. #SourdoughFire, Diablo WA.
Infrared flight last night 8:52pm. IR analyst determined 2,586 acres burned.
#RedFlagWarning until Tuesday evening.
Highway 20 is closed.
See “Map tips” and “Legend” links in upper left corner.
#WAwx #WAfire #Wildfire #GIS #Geospatial #Maps #Mapping #Leaflet #ArcGIS #WebMap
Open #GISsurfer map:
https://mappingsupport.com/p2/gissurfer.php?center=48.721829,-121.157741&zoom=13&basemap=USA_basemap&overlay=VIIRS_7_day,MODIS_7_day,State_boundary,USA_roads&fire=WA,Sourdough&data=https://mappingsupport.com/p2/special_maps/disaster/USA_wildland_fire.txt
#sourdoughfire #redflagwarning #wawx #wafire #Wildfire #gis #geospatial #maps #mapping #leaflet #arcgis #webmap #gissurfer
Josh Carlson :qgis: · @jcarlson
457 followers · 862 posts · Server mapstodon.spaceHoly flippity farts, that was one of the most gut-wrenching hours of my life.
Turns out the #ArcGIS Enterprise upgrade went nearly perfectly, but my browser was caching some JS files that the upgrade changed, so when I tested things, it *looked* like I'd completely broken our GIS system.
Clear the cache, refresh. All that worry for naught.
But hey! It means I stayed up late enough to catch the #perseids!
Joseph Elfelt · @mappingsupport
459 followers · 373 posts · Server m.ai6yr.org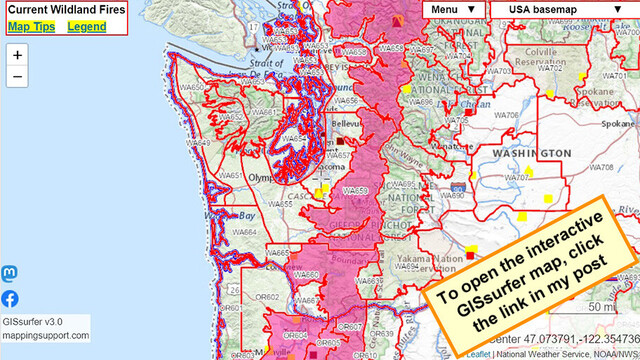
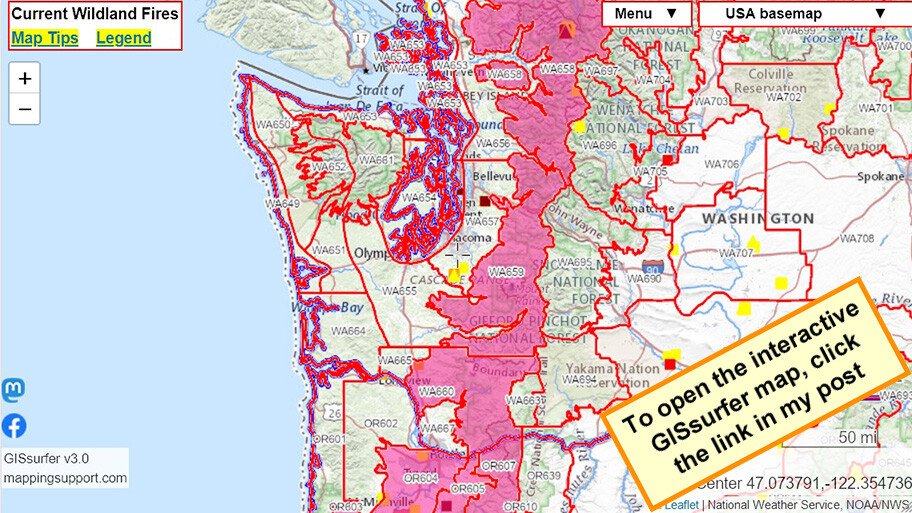
#RedFlagWarning for *west* slopes of Cascade Mountains. Typically, this is the soggy side, but not now.
To read NOAA’s “fire weather forecast” open the map, click in any red-outlined zone and follow the link.
Map has *lots* of fire related layers you can turn on/off. Click “Map tips” upper left corner for help.
#PNW #WAfire #WAwx #ORfire #ORwx #Wildfire #Geospatial #Maps #Mapping #Leaflet #ArcGIS #WebMap
Open #GISsurfer map:
https://mappingsupport.com/p2/gissurfer.php?center=47.604368,-121.854858&zoom=8&basemap=USA_basemap&overlay=VIIRS_7_day,MODIS_7_day,State_boundary,Red_flag_warning,NOAA_fire_weather_forecast&data=https://mappingsupport.com/p2/special_maps/disaster/USA_wildland_fire.txt
#redflagwarning #pnw #wafire #wawx #orfire #orwx #Wildfire #geospatial #maps #mapping #leaflet #arcgis #webmap #gissurfer