
Debian Astro · @DebianAstro
102 followers · 108 posts · Server astrodon.social#AstroTools #AstronomySoftware #ScienceSoftware #DebianBookworm
Random #Debian Astro package of the week is funtools. Funtools, is a "minimal buy-in" FITS library and utility package developed at the High Energy Astrophysics Division of SAO. The Funtools library provides simplified access to a wide array of file types: standard astronomical FITS images and binary tables, raw arrays and binary event lists, and even tables of ASCII column data.
1/2⤵
#astrotools #astronomysoftware #sciencesoftware #debianbookworm #debian
Debian Astro · @DebianAstro
69 followers · 75 posts · Server astrodon.socialThis package contains the asdf command line tool.
https://github.com/asdf-format/asdf
#AstroTools #AstronomySoftware #ScienceSoftware #DebianBookworm
2/2
#astrotools #astronomysoftware #sciencesoftware #debianbookworm

d0ct0r :verified: · @the_data_chat_of_astronomy
9 followers · 193 posts · Server universeodon.comMy favourite resource for variable star theory, at an entry level that could be useful to amateur astronomers.
AAVSO observing sections: https://www.aavso.org/observing-sections
VSX vartypes: https://www.aavso.org/vsx/index.php?view=about.vartypes
OGLE ATLAS: http://ogle.astrouw.edu.pl/atlas/index.html
ASAS-SN ATLAS: https://asas-sn.osu.edu/atlas
Useful free tools for light curve analysis (time-domain series).
VStar: https://www.aavso.org/vstar
Period04: http://period04.net/
Useful photometry archives to download data of variable stars.
ASAS-SN Variable Star Database: https://asas-sn.osu.edu/variables
ASAS-SN Sky Patrol: https://asas-sn.osu.edu/
ASAS-SN Sky Patrol 2.0: http://asas-sn.ifa.hawaii.edu/skypatrol/
MAST archive: https://mast.stsci.edu/portal/Mashup/Clients/Mast/Portal.html
OGLE IV archive: http://ogledb.astrouw.edu.pl/~ogle/OCVS/
ZTF archive: https://irsa.ipac.caltech.edu/cgi-bin/Gator/nph-scan?submit=Select&projshort=ZTF
ATLAS archive: https://fallingstar-data.com/forcedphot/
Debian Astro · @DebianAstro
68 followers · 72 posts · Server astrodon.socialBecause XPA works both at the programming level and the shell level, it is a powerful tool for unifying any analysis environment: users and programmers have great flexibility in choosing the best level or levels at which to access XPA services, and client access can be extended or modified easily at any time.
This package contains the additional tools.
https://hea-www.harvard.edu/RD/xpa/
#AstroTools #AstronomySoftware #ScienceSoftware #DebianBookworm
2/2
#astrotools #astronomysoftware #sciencesoftware #debianbookworm
d0ct0r :verified: · @the_data_chat_of_astronomy
9 followers · 183 posts · Server universeodon.com
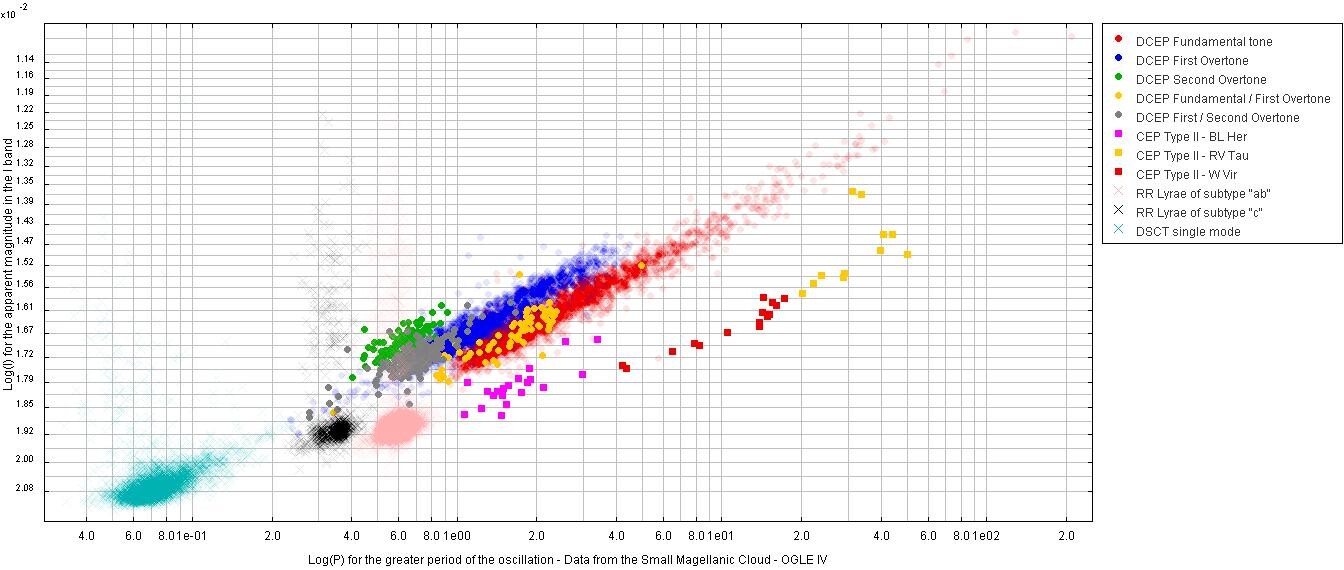
Subject: Log(I) vs Log(P) Diagram.
This diagram shows the clear relation between the apparent magnitude in I-band (infrared), that stands for an equivalent measure for the brightness, and the pulsation period for many types of variable (pulsating) stars.
These stars are collected from the Small Magellanic Cloud, a Milky Way satellite galaxy: therefore, all these stars are actually almost at the same distance from us. So, the apparent magnitude is a good parameter correlated with the absolute magnitude.
Credits: OGLE - The Optical Gravitational Lensing Experiment - Phase IV; TOPCAT.
http://ogledb.astrouw.edu.pl/~ogle/OCVS/
http://www.star.bris.ac.uk/~mbt/topcat/
d0ct0r :verified: · @the_data_chat_of_astronomy
9 followers · 183 posts · Server universeodon.com
Subject: Log(I) vs Log(P) Diagram.
This diagram shows the clear relation between the apparent magnitude in I-band (infrared), that stands for an equivalent measure for the brightness, and the pulsation period for many types of variable (pulsating) stars.
These stars are collected from the Large Magellanic Cloud, a Milky Way satellite galaxy: therefore, all these stars are actually almost at the same distance from us. So, the apparent magnitude is a good parameter correlated with the absolute magnitude.
Credits: OGLE - The Optical Gravitational Lensing Experiment - Phase IV; TOPCAT.
http://ogledb.astrouw.edu.pl/~ogle/OCVS/
http://www.star.bris.ac.uk/~mbt/topcat/
d0ct0r :verified: · @the_data_chat_of_astronomy
7 followers · 59 posts · Server universeodon.comSome tricks to analyse astronomical images with JS9 from SDSS DR12 data.
Open https://www.legacysurvey.org/viewer
Point at: 249.135696 39.027874
Search at the right menu in the SkyViewer "+More surveys", click it and choose SDSS data.
Left click at the center of the object
Right click on Data > new window
Right click on Detail > new window > search the object in the JPG quick look image.
If there is not the object, choose another link at the Detail page.
When you found the object, down the JPG there are the links from which you can download the image in the compressed format .bz2 (you can unpack it, for example, with 7-zip).
Open https://js9.si.edu/
Menu File > open local > load the FITS image
All of the other instructions are identical as in the case about DECaLS images.
d0ct0r :verified: · @the_data_chat_of_astronomy
7 followers · 56 posts · Server universeodon.comSome tricks to analyse astronomical images with JS9 from DECaLS data.
Open https://www.legacysurvey.org/viewer
Point at: 249.135696 39.027874
Left click at the center of the object
Right click on Data > new window
Right click on Coadded Images > new window
Copy the link for the FITS file named as "legacysurvey-XXX-image-g.fits.fz"
Open https://js9.si.edu/
Menu File > open remote > paste the URL
Menu zoom > zoom to fit
Menu scale > data limits > scale z1/data max
Menu color > turbo
Menu view > Magnifier
Menu view > Bin/Filter (enlarge its window)
Use the Magnifier to point at the center of the object
Read and copy the coordinates (find them down the menu bar) into the Bin panel and choose a Size > Get Data
Menu zoom > zoom to fit
Menu scale > Log
Menu scale > data limits... > data min/max
Menu color > more colormaps > color
Menu color > invert
Menu analysis > blur=1
Explore the flux levels from the Magnifier
Menu scale > histeq
Explore the morphology from the Magnifier
d0ct0r :verified: · @the_data_chat_of_astronomy
3 followers · 7 posts · Server universeodon.comA tool for image analysis on the web: https://js9.si.edu/
Follow me for many images.
With images taken by PanSTARRS you can load the FITS-cutout URL into the JS9:
1. Menu File > open remote > URL from PanSTARRS FITS-cutout
2. Menu Scale > choose a scale
3. Menu Color > choose a colormap
4. Menu Analysis > do some blur with sigma parameter greater than 0 to minimize the noise
5. Menu View > Contours > do some choice for isophotal analysis
6. Menu Save > PNG (in local)