Elias Dabbas :verified: · @elias
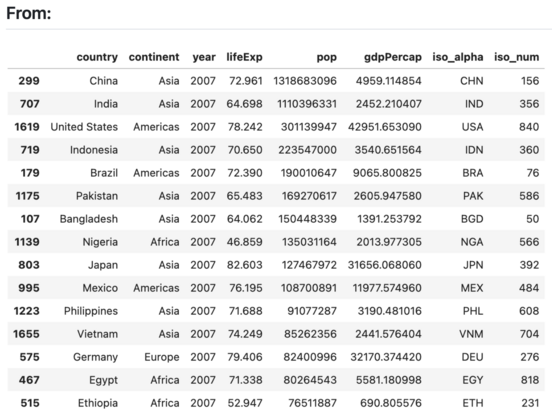
55 followers · 81 posts · Server seocommunity.socialFirst steps at visualizing tables in a clear and (hopefully) beautiful way.
Get/edit the code here:
#DataScience #DataVisualization #Plotly #Barchart #Heatmap #Python
#datascience #datavisualization #plotly #barchart #heatmap #python
Vielauge · @Vielauge
45 followers · 60 posts · Server muenchen.social#bayern #barchart #temperature
Klimakatastrophe ist jetzt. #wakeup .
Und wenn ich an die Gewitterwand über Augsburg denke und an die Schulkinder die gerade heimfahren, wird mir ganz anders. Und die Häufigkeit wird zu nehmen und die Häufigkeit von noch katastrophaleren Wetterereignissen wird auch zu nehmen, überall auf der Welt.
Höre mich an wie Hiob. Gruselig.
#bayern #barchart #temperature #wakeup
Summer · @yoloshe302
0 followers · 2 posts · Server me.dmIn the modern data world, a data person often generates a graph/chart/plot that can tell a story to appeal to a great mass of the audience visually. The #barchart race comes into today’s #storytelling. In this article, I will cover an end-to-end tutorial on generating a bar chart race on #Databricks
Article: https://medium.com/@yoloshe302/everything-you-need-to-know-about-bar-chart-racevisualization-dadbed4cdf72
Bar Chart Race:
https://public.flourish.studio/visualisation/12405668/
#barchart #storytelling #databricks
Hello57vis · @Hello57
28 followers · 363 posts · Server vis.socialGottfried Szing :unverified: · @kjoo
355 followers · 938 posts · Server fosstodon.orgDon't trust a bar chart that you haven't completely f*cked up yourself 😂😂😂
Nati Labadie (she/her) · @natilabadie
212 followers · 63 posts · Server masto.aiJust found out about this page and I'm laughing too much.
Thinking about using "why is this a bar chart?" as motto.
https://viz.wtf/post/664499451583430656/trying-to-understand-the-salary-range-for-my
#dataviz #datascience #barchart
Christian Gebhard · @basepair
314 followers · 256 posts · Server vis.social#30DayChartChallenge #30DCCNov22Reposts #Day3 - Topic: historical
Back to the Shakespeare data! I wanted to compare the length of his plays.
Tool: #rstats @rstats Data: kaggle users LiamLarsen, aodhan
Color-Scale: MetBrewer "Isfahan2"
Fonts: Niconne, Noto Sans (+Mono)
Code: https://github.com/nucleic-acid/30DayChartChallenge_2022
#datavis #dataviz #shakespeare #distribution #typography #monospace #barchart
#barchart #monospace #typography #distribution #shakespeare #dataviz #datavis #rstats #day3 #30DCCNov22Reposts #30DayChartChallenge
Peponi · @pep0ni
53 followers · 596 posts · Server swiss-chaos.social> Streamlit — The fastest way to build data apps in #Python
#python #web #nofrontend #graph #barchart #table #html5


