
Lulu Powerful · @lulu_powerful
129 followers · 550 posts · Server fosstodon.org@StatGenDan Thanks for linking this. It looks really interesting, and will form my "reward reading" when I'm done studying today.
(that's right - I reward study by doing more study lol)
I can't say whether or not I'll agree with the entire argument, but I can say that learning #baseR before introducing other packages suited me very well.
Lulu Powerful · @lulu_powerful
129 followers · 550 posts · Server fosstodon.org@edyhsgr Potentially controversial, but I agree!
I was annoyed when the code demos for a particular uni course relied on #tidyR, because I felt that I hadn't learned enough #baseR yet.
So I stuck to base for my big assignment, only bringing in other packages where needed. It's not that I dislike tidy; it's just that I want to be in control of the packages - I don't want the packages to be in control of me.

Juli Nagel · @juli_nagel
522 followers · 126 posts · Server fosstodon.org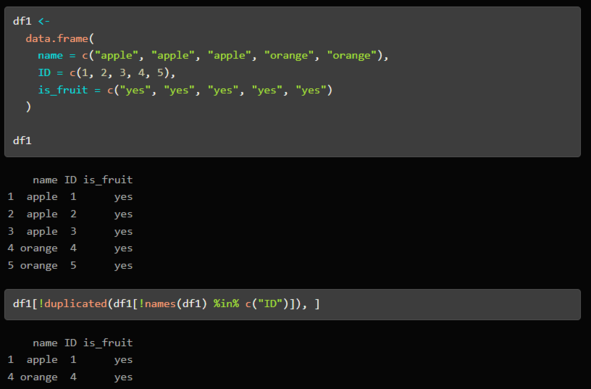
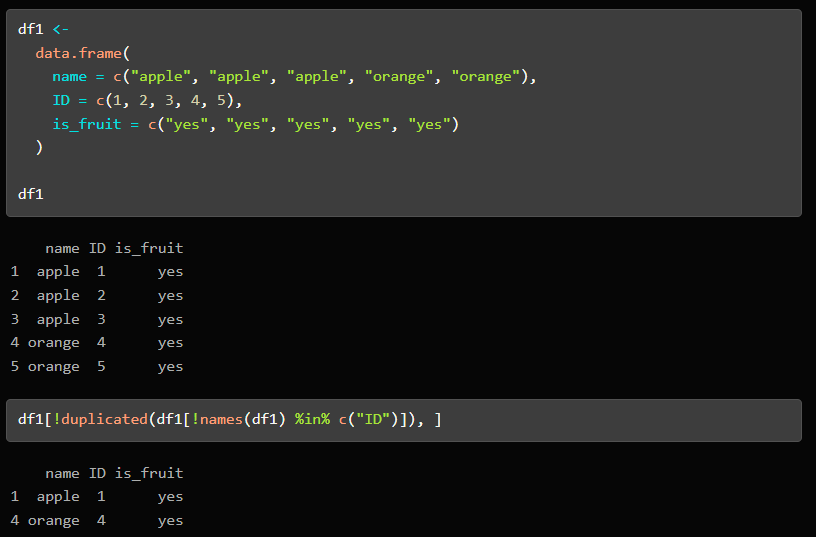
Get unique rows of a dataframe in #rstats, but ignore some columns (e.g., ID in this df)?
df1 <-
data.frame(
name = c("apple", "apple", "apple", "orange", "orange"),
ID = c(1, 2, 3, 4, 5),
is_fruit = c("yes", "yes", "yes", "yes", "yes")
)
If you're a #baseR fan like me, you might want:
df1[!duplicated(df1[!names(df1) %in% c("ID")]), ]

Jo Etzel · @JosetAEtzel
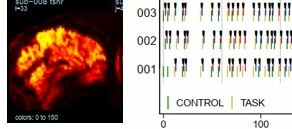
322 followers · 421 posts · Server fediscience.orgMajor thanks to @tannguyen for spotting and reporting a bug in my niftiPlottingFunctions.R plot.volume() function!
The code at https://osf.io/k8u2c is updated; see https://mvpa.blogspot.com/2023/03/bugfix-for-niftiplottingfunctionsr.html for info and examples.
(This #baseR #rstats function is for plotting #fMRI #nifti images in #knitr documents.)
... it is painful to find out there was a bug, but so much better to fix it than to continue its propagation! I am grateful to @tannguyen and hope anyone else seeing something odd lets me know.
#knitr #nifti #fmri #rstats #baseR
Jo Etzel · @JosetAEtzel
322 followers · 421 posts · Server fediscience.org@milesmcbain "... the users are actually readers of the code rather than just runners ..." is a great way to put it!
With the #academic #programming that's my job, I assume most everything will eventually contribute to a publication, and so be shared. The logic of the code needs to be apparent to others in the future (and hopefully useable); imo avoiding dependencies and sticking to the most stable codebase (#baseR #rstats, in my case) is worth the effort.
#rstats #baseR #programming #academic
Jo Etzel · @JosetAEtzel
307 followers · 346 posts · Server fediscience.orgA methods paper of mine is now at https://doi.org/10.3389/fnimg.2023.1070274 . This little #NewNeuroPaper demonstrates human task #fMRI quality control, as part of the FMRI Open QC Project (which I hope to discuss at #OHBM and elsewhere as it wraps up).
Its supplemental (https://doi.org/10.17605/OSF.IO/HT543) may be of interest to #rstats folks, particularly if looking for examples of #baseR #knitr #graphics and/or scripts aiming to minimize dependencies and maximize long-term usability.
#graphics #knitr #baseR #rstats #OHBM #fmri #newneuropaper

Argos de Core · @Argos_DeCore
106 followers · 336 posts · Server mastodon.galHai un ano estiven nunha situación kafkiana semellante, no meu caso coa compañía Unión #Fenosa Distribución e #Baser (unha comercializadora eléctrica de bono social) tirándose a pelota para non arranxar un problema de falta de potencia, isto no máis frío do inverno e pasando o COVID na casa.
A "atencion" telefónica, de tolos.
E o encanto de tecno-feudalismo que padecemos os súbditos dos #oligopolios .
¡Nacionalización de servizos básicos xa!
Jo Etzel · @JosetAEtzel
299 followers · 317 posts · Server fediscience.org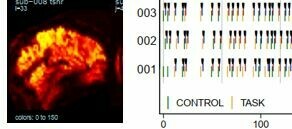
@ERDonnachie @tgtads @datamaps
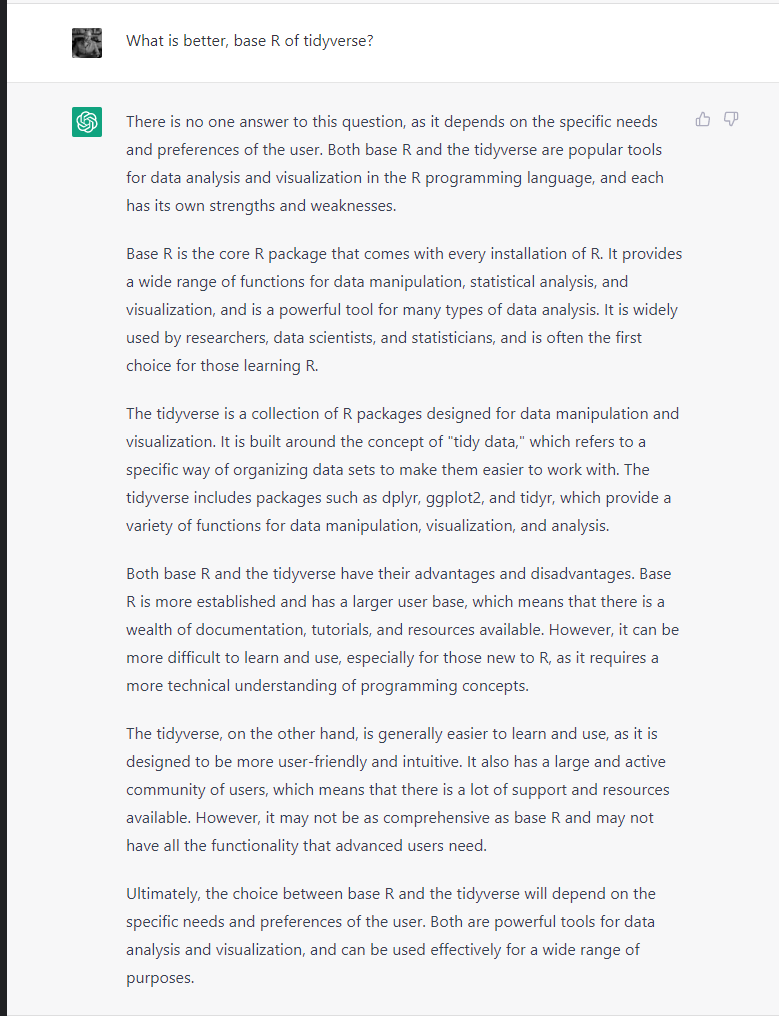
I can't resist a #tidyverse vs. #baseR #rstats thread. 😅
It is totally possible to work without tidyverse, and base R graphics can be incredibly flexible. If you'd like some examples, just this morning I uploaded yet another set of all-base #knitr supplemental files (https://osf.io/ht543), with very pretty (and highly useful) graphics, if I say so myself. (Tidyverse can be ok, but it's not at all required.)
#knitr #rstats #baseR #tidyverse

Romain Barthélémy · @rombarthelemy
117 followers · 235 posts · Server critcare.socialMaybe it’s time to remove dplyr from my Rprofile
https://lorentzen.ch/index.php/2023/01/09/dplyr-style-without-dplyr/
Jo Etzel · @JosetAEtzel
272 followers · 206 posts · Server fediscience.org
@domliebl Nice #baseR graphing introduction!
I use base #rstats pretty much exclusively, and am probably more biased than you are against ggplot ... I used it for a few years when it first came out, but got frustrated by its limitations and the need for constant updating and dependencies.
If you are looking for base R graphics tutorials (plus #knitr), try https://mvpa.blogspot.com/2020/03/introductory-knitr-tutorial.html

Alexandre Blanchet · @AlexBlanchet
309 followers · 71 posts · Server mastodon.world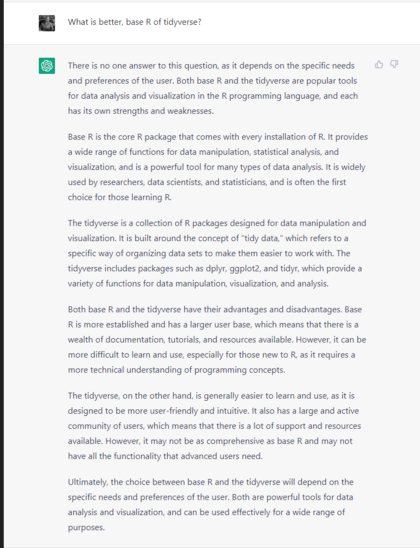
Juli Nagel · @juli_nagel
407 followers · 90 posts · Server fosstodon.org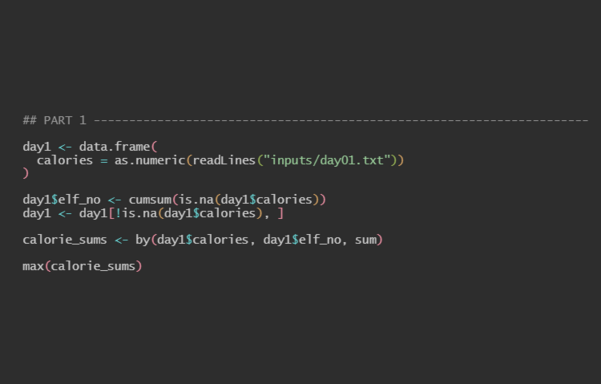
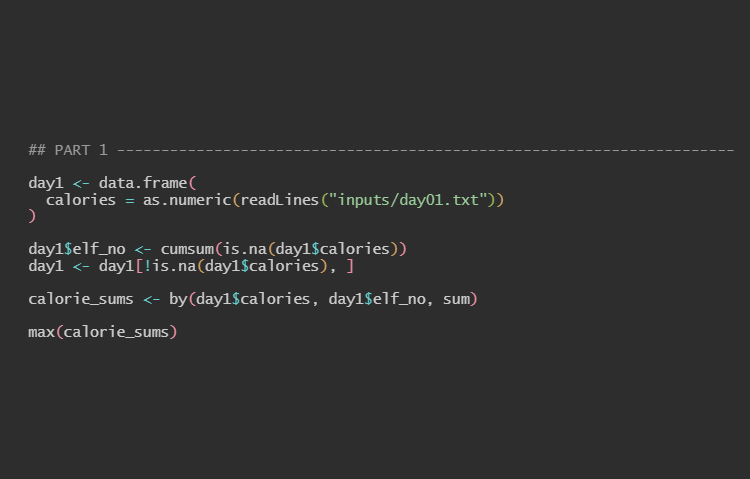
As usually, the code for day 1 is still short enough to fit into a toot. And as usually, I try to solve the puzzles in #baseR until I get too lazy.
Day 1 was still a piece of cake in base R, with one of my all time favourites `by()` taking the center stage.
day1 <- data.frame(
calories = as.numeric(readLines("inputs/day01.txt"))
)
day1$elf_no <- cumsum(is.na(day1$calories))
day1 <- day1[!is.na(day1$calories), ]
calorie_sums <- by(day1$calories, day1$elf_no, sum)
max(calorie_sums)
Jo Etzel · @JosetAEtzel
75 followers · 14 posts · Server fediscience.orgI'm a staff scientist at Washington U in St Louis (#Missouri, USA), mostly working with human task fMRI datasets. I'm a big fan of #baseR, #knitr, #QC, and very extensive #supplementary materials. I insist on looking at data early and often; some #tutorials and examples on my blog. (#GotBrains?)
I'm a #FirstGen college grad, #IowaStateU; BS in #forestry. I do #knitting (plus #crochet, #sewing, etc.), not just knitr-ing. I haven't before posted cat pictures, but no guarantees.
#sewing #crochet #knitting #forestry #IowaStateU #FirstGen #GotBrains #tutorials #supplementary #qc #knitr #baseR #missouri #introduction
Juli Nagel · @juli_nagel
407 followers · 90 posts · Server fosstodon.org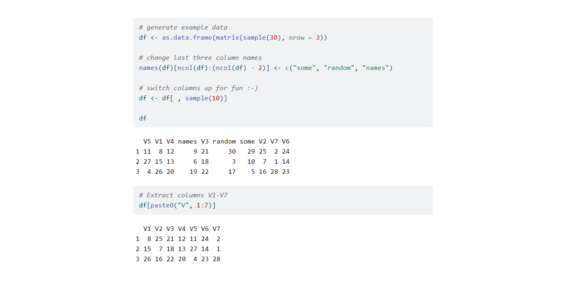
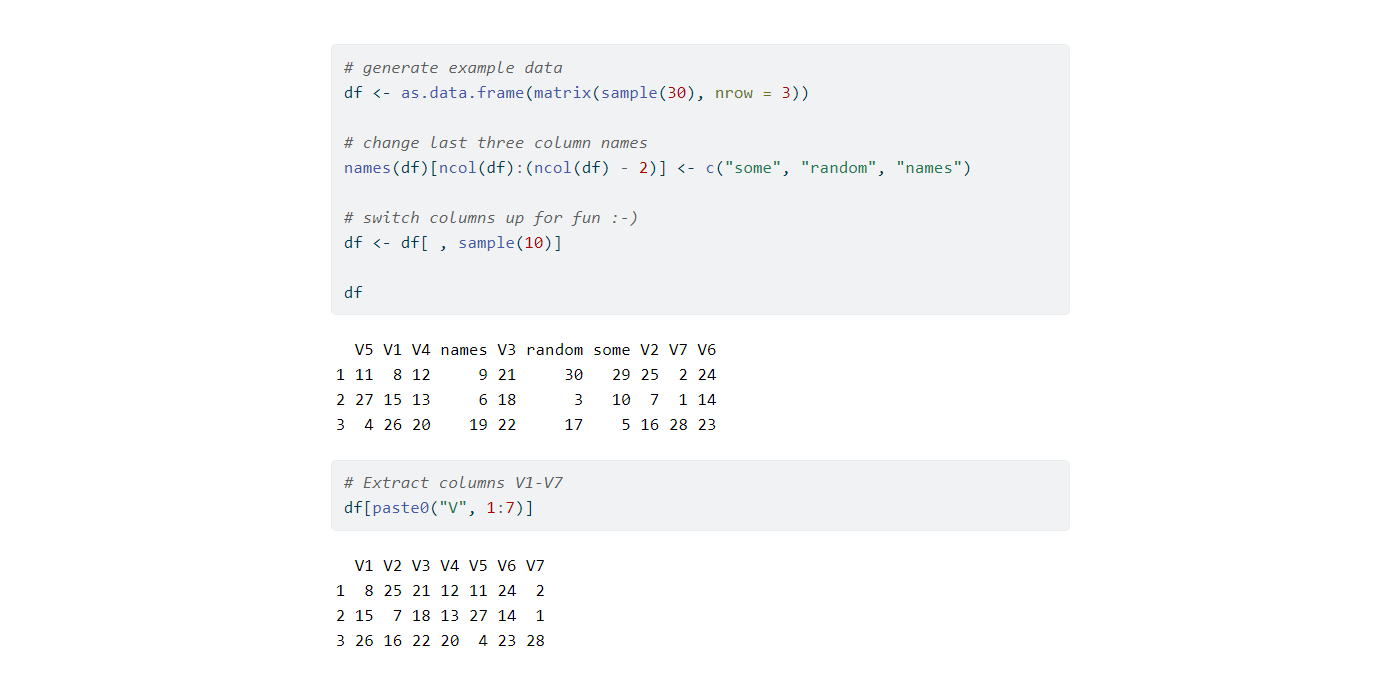
:rstats: `paste0()` can help you select columns in a df, base R style.
# generate example data
df <- as.data.frame(matrix(sample(30), nrow = 3))
# change last three column names
names(df)[ncol(df):(ncol(df) - 2)] <- c("some", "random", "names")
# switch columns up for fun :-)
df <- df[ , sample(10)]
# Extract columns V1-V7
df[paste0("V", 1:7)]

mary beth ☑️ · @maryErudis
81 followers · 71 posts · Server fosstodon.org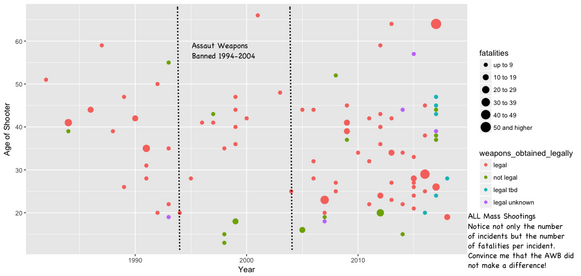
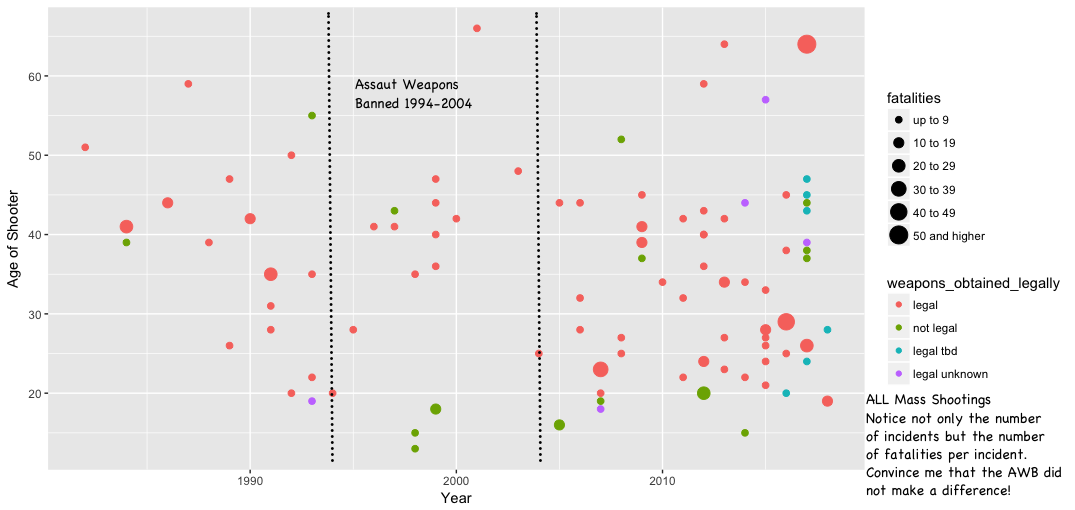
#rstats #dataviz just gonna drop this here: I need to update this to the most recent data. Source was #MotherJones and is legitimate data. Not sure if this needs a content warning, but I'm not advocating for anything in particular. Just let the data speak for itself. If anyone wants the #Rcode I used, it uses #BaseR and I can put all of it into Github
#rstats #dataviz #motherjones #Rcode #baseR

Uwe Remer · @uweremer
320 followers · 56 posts · Server fediscience.orgIntroduction:
Hi, I’m a political science postdoc researcher at the Computational Social Science Lab @Uni_Stuttgart
My roots are research on attitudes, #participation, and #voting behavior. My dissertation on participatory and #deliberative #democracy on local level brought me to python, webscraping and machine learning. #AI
I consider causal reasoning to be the most important part of statistical modeling. #DAG #DGP
#baseR #rstats #DGP #dag #ai #democracy #deliberative #voting #participation
devSJR :python: :rstats: · @devSJR
124 followers · 117 posts · Server fosstodon.orgATM, we have approximately 6 people who use something other thand #dplyr, #datatable or #baseR. What do you use? #poorman?
#dplyr #datatable #baseR #poorman #rstats