medio pocillo ☕ · @mediopocillo
238 followers · 1548 posts · Server spore.social#TIL sobre las barras para ilustrar la pérdida de la #biodiversidad.
#clima
#ShowYourStripes #BiodiversityStripes
h/t @empiricism
#til #biodiversidad #clima #showyourstripes #biodiversitystripes

Empiricism · @empiricism
194 followers · 519 posts · Server sustainability.masto.host
The #Sustainability Mastodon server is for people that are interested in reversing the trend of Human activities that are heating up the Planet's atmosphere & causing a 6th mass #extinction event. https://sustainability.masto.host/
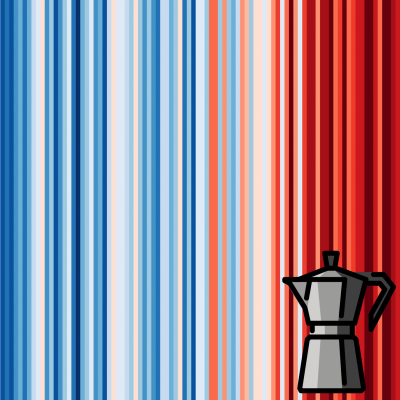
The image visually represents the data on human-caused global warming & #UK biodiversity loss between 1970 to 2018.
Data: LPI 2022. Living Planet Index database; DEFRA UK & UK Biodiversity Indicators https://biodiversitystripes.info/global
#sustainability #extinction #uk #climate #showyourstripes #biodiversitystripes
Empiricism · @empiricism
194 followers · 520 posts · Server sustainability.masto.hostThe #Sustainability is for people that are interested in reversing the trend of Human activities that are heating up the Planet's atmosphere & causing a 6th mass #extinction event.
The image visually represents the data on human-caused global warming & #UK biodiversity loss from 1970 to 2018.
Data: LPI 2022. Living Planet Index database; Department for Environment, Food and Rural Affairs, UK & UK Biodiversity Indicators https://biodiversitystripes.info/global
#sustainability #extinction #uk #climate #showyourstripes #biodiversitystripes

Olivier Blond · @olireiv
947 followers · 1886 posts · Server zeroes.ca
#ShowYourStripes
#BiodiversityStripes
To describe this graph, I would say that the lines running from green to yellow to grey are an estimate of the loss of biodiversity over a given period. The grey is the worst.
The decline in biodiversity in Latin America is 94% between 1970 and 2018.
NB: there is nothing that can increase biodiversity, every loss of species is definitive.
Sources: biodiversitystripes.info and Living Planet Index database 2022 - livingplanetindex.org
#showyourstripes #biodiversitystripes

Dr. Alexandre Santerne 🌍 · @AlexSanterne
1855 followers · 747 posts · Server astrodon.social
Do you already know the #ShowYourStripes (by @ed_hawkins), which highlights #GlobalWarming of the #Earth's #climate ? (if not, look here: https://showyourstripes.info/)
Below is the equivalent #BiodiversityStripes, highlighting the #biodiversity loss, in terms of global biodiversity (69% decline since 1970) and #freshwater biodiversity (83% decline since 1970).
Do you really think we can continue living like that ? 😳
#showyourstripes #globalwarming #earth #climate #biodiversitystripes #biodiversity #Freshwater #climatecrisis #biodiversitycrisis #sustainability