
Joseph Elfelt · @mappingsupport
509 followers · 442 posts · Server m.ai6yr.org
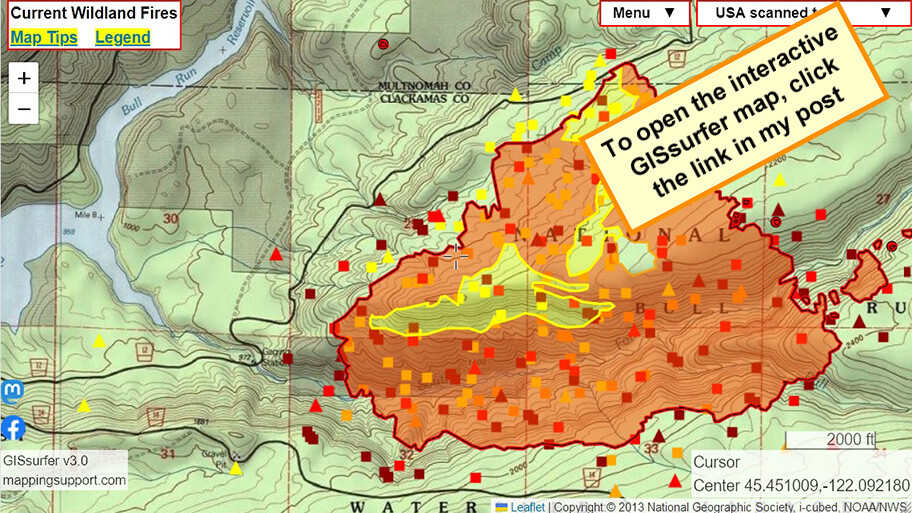
8/27 morning.
Interactive #GIS map for #CampCreekFire SE of #Portland Oregon
Infrared flight last night 10:19pm. IR analyst determined 1,226 acres burned.
Red shading = intense heat.
This watershed is #Portland water supply.
See links for “Map Tips” and “Legend” in upper left corner.
#ORwx #ORfire #WildlandFire
Open #GISsurfer map:
https://mappingsupport.com/p2/gissurfer.php?center=45.451009,-122.092180&zoom=14&basemap=USA_scanned_topo&overlay=VIIRS_7_day,MODIS_7_day,State_boundary&fire=OR,Campcreek&data=https://mappingsupport.com/p2/special_maps/disaster/USA_wildland_fire.txt
#gis #campcreekfire #portland #orwx #orfire #wildlandfire #gissurfer
Joseph Elfelt · @mappingsupport
509 followers · 441 posts · Server m.ai6yr.org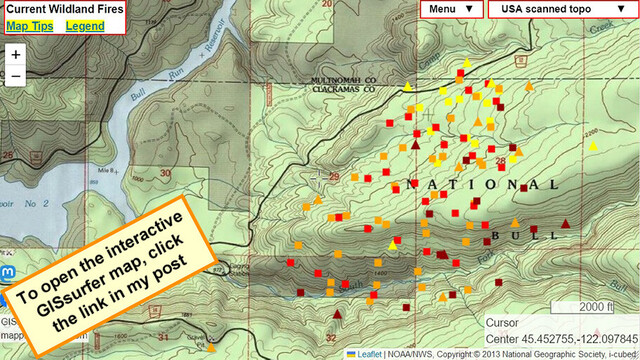
Interactive #GIS map for #CampCreekFire SE of #Portland Oregon and near that town’s water supply.
Dark red symbols are *heat* detections by MODIS and VIIRS satellites within prior 6 hours. This data is not real time, locations are approximate and sometimes ‘false positive”. Two links in upper left corner have more info.
#ORwx #ORfire #WildlandFire #Geospatial #Maps #Mapping #Leaflet #ArcGIS #WebMap
Open #GISsurfer map:
https://mappingsupport.com/p2/gissurfer.php?center=45.452755,-122.097845&zoom=14&basemap=USA_scanned_topo&overlay=VIIRS_7_day,MODIS_7_day,State_boundary&data=https://mappingsupport.com/p2/special_maps/disaster/USA_wildland_fire.txt
#gis #campcreekfire #portland #orwx #orfire #wildlandfire #geospatial #maps #mapping #leaflet #arcgis #webmap #gissurfer