Stuart :progress_pride: · @slowe
932 followers · 2361 posts · Server mastodon.me.ukI've written up a blog post about v1.0 of a 2023 constituency hex layout and how you can help improve it https://open-innovations.org/blog/2023-08-03-hexes-for-the-next-general-election
#hex #hexmap #cartogram
Asjad Naqvi :stata: · @asjadnaqvi
440 followers · 367 posts · Server econtwitter.netAdding two more #Stata #cartogram #maps for the #USA. The geography is based on the #NYTimes version.
Data is extracted from the #ACS 2021 population estimates using the #getcensus package. Right map uses the new version of #bimap.
#Stata #cartogram #maps #usa #nytimes #acs #getcensus #bimap
Chuck Purvis · @charleypurvis
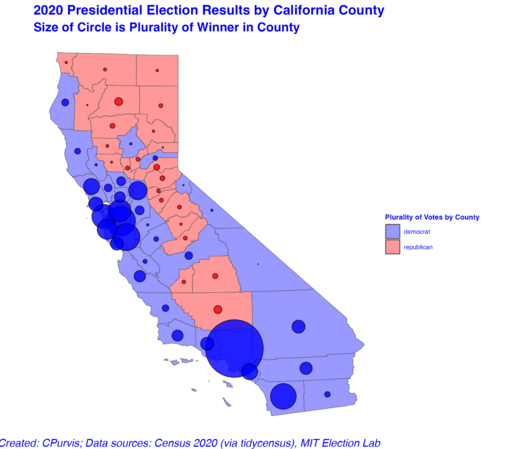
59 followers · 125 posts · Server sfba.socialToday I learned a new #rstats package: #cartogram . This allows creation of Dorling cartograms (non-overlapping bubbles).
It's using the same 2020 presidential election county-level databased I created merging MIT Election Lab data with #tidycensus -derived files from the #census2020
The California Dorling plot is better by showing non-overlapping circles, especially in the Bay Area.
The Texas Dorling plot shows Harris County (Houston) nudged into the Gulf of Mexico. Dallas County and Travis County (Austin) have pushed (repelled) the little red bubbles to be more prominent.
All maps were created with the #tidyverse package #ggplot2
This is a lot of fun, for me, at least!
#rstats #cartogram #tidycensus #Census2020 #tidyverse #ggplot2
Blandine Le Cain · @blandinelc
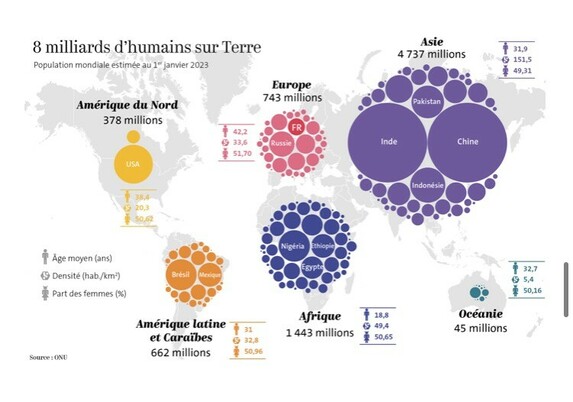
69 followers · 43 posts · Server mastodon.socialSur ce sujet, une question en particulier : comment représenter visuellement la répartition entre continents en se détachant un peu de la géographie, sans la perdre ? Ce qui a donné, à gauche, une infographie réalisée avec Illustrator par notre service infographie. A droite, une version animée réalisée grâce au package assez magique {cartogram} #cartogram #gganimate [3/8]
ConstantOrbit · @constantorbit
77 followers · 113 posts · Server mastodon.socialAnd I had to look up #cartogram, I knew the concept but not the right term. #TIL
ConstantOrbit · @constantorbit
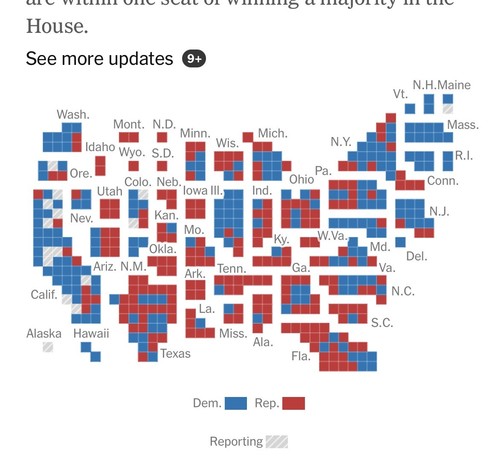
77 followers · 111 posts · Server mastodon.socialFinally! #NewYorkTimes showing #USElection results in a #cartogram, not skewed by empty land that doesn't vote. #maps
#newyorktimes #uselection #cartogram #maps
Sébastien Fibla · @Cboy13
704 followers · 33733 posts · Server mamot.frRT @julgaf
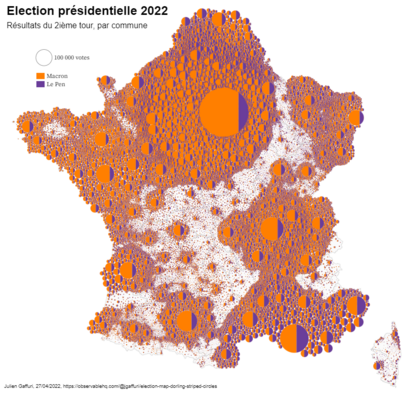
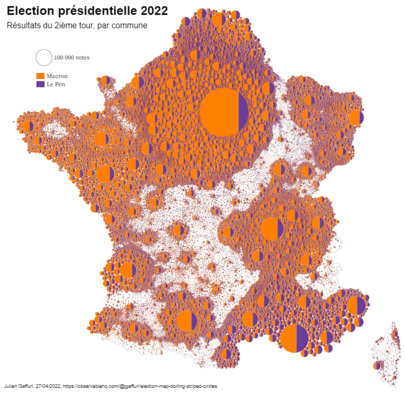
C'est prêt ! Voilà la #carte des résultats de #Presidentielles2022 entre #LePen et #Macron au niveau des communes, #dorling #cartogram #cartography #observablehq
https://tinyurl.com/32t9y4ub
#observablehq #cartography #cartogram #dorling #macron #lepen #presidentielles2022 #carte
Pierre Bataille · @pierre_bat
776 followers · 8290 posts · Server mastodon.socialPlastiquement, on dirait du Moebius non? je crois que c'est pas mal dû aux couleurs.
---
RT @julgaf
C'est prêt ! Voilà la #carte des résultats de #Presidentielles2022 entre #LePen et #Macron au niveau des communes, #dorling #cartogram #cartography #observablehq
https://tinyurl.com/32t9y4ub
https://twitter.com/julgaf/status/1519266310458421248
#carte #presidentielles2022 #lepen #macron #dorling #cartogram #cartography #observablehq
Utopiah (Fabien Benetou) · @utopiah
185 followers · 5477 posts · Server mastodon.pirateparty.beRT @julgaf@twitter.com
C'est prêt ! Voilà la #carte des résultats de #Presidentielles2022 entre #LePen et #Macron au niveau des communes, #dorling #cartogram #cartography #observablehq
https://tinyurl.com/32t9y4ub
#carte #presidentielles2022 #lepen #macron #dorling #cartogram #cartography #observablehq
cseiler · @cs
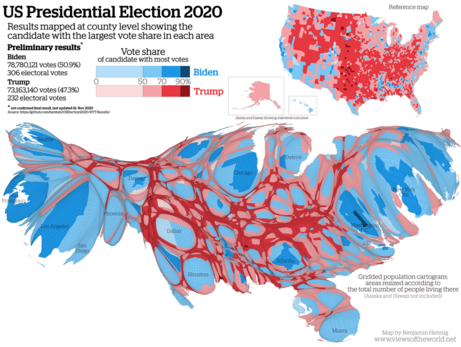
327 followers · 6341 posts · Server mastodon.sdf.org#Cartogram of 2020 Presidential election. Counties sized by population while colors indicate vote results. It is helpful in pointing out the old adage that "land doesn't vote, people do."
Raf · @Raf
298 followers · 5913 posts · Server mastodon.socialRT @worldmapper@twitter.com
It's #WorldOceansDay2020: Here is a cartogram of Ocean Chlorophyll Concentration https://worldmapper.org/maps/grid-oceanchlorophyll-2014/ #WorldOceansDay #oceans #sea #water #maps #cartogram #blueplanet
🐦🔗: https://twitter.com/worldmapper/status/1269975157533224960
#WorldOceansDay2020 #worldoceansday #oceans #sea #water #maps #cartogram #blueplanet
Jonatan Hildén · @jhilden
175 followers · 243 posts · Server vis.socialThis #cartogram library for R is pretty nifty.
https://github.com/sjewo/cartogram
Just make a shapefile with the appropriate data in @QGIS and voilá! (Bachelor students in the Nordics & Baltics, NUTS2. Of course, non-contiguous cartograms are *a bit* dodgy for irregular regions)


