
ItzTrain :aim_logo: · @train
152 followers · 1625 posts · Server hachyderm.ioSo the monitoring story in #SmartOS is starting to become a little clearer. It sounds like without #triton you are stuck rolling your own if you want to monitor all of the resources of zones from a central location. The closest, I came to monitoring the host holistically was to run #collectd in the global zone.
The problem I faced there was it doesn't look like the services (SMF's are the terminology I think) survive reboots. I needed to create a custom one.
#SmartOS #triton #collectd #homelab #selfhosted #selfhosting

ベンツくん · @bentsukun
82 followers · 122 posts · Server mastodon.sdf.org
jhx · @jhx
109 followers · 181 posts · Server fosstodon.org@ezaquarii A TIG stack is nice - used that before to!
Did you build the dashboard in #Grafana yourself?
I've never tried #collectd so far.

ezaquarii · @ezaquarii
13 followers · 58 posts · Server techhub.social
James Cuff :verified: · @james
530 followers · 312 posts · Server cuff.social

Solène :flan_hacker: · @solene
1990 followers · 1255 posts · Server bsd.network
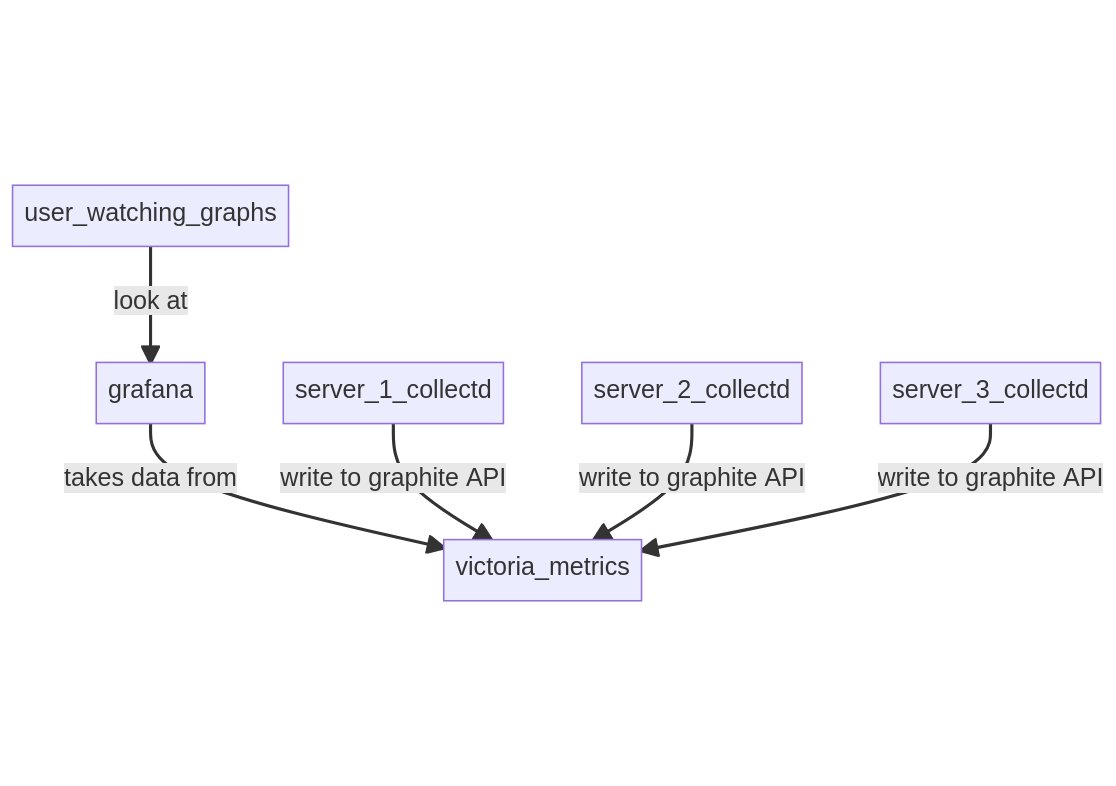
Playing with "nowdays" metrics stack with #NixOS
I found four setups to gather data for #grafana:
- the minimalist one using #collectd + #victoriametrics exposing a graphite API
model: push (agents to graphite API)
pros:
very little memory used
cons:
require to create the dashboards :/
configuration required for collectd
not much information
data isn't easy to process by grafana because of the structure from graphite (you can't find hosts)
- the full #prometheus + node exporter
model: pull (prometheus is connecting to all servers)
pros:
seems industry standard
can use the "node exporter full" grafana dashboard
cons:
use memory
need to reach all the remote nodes
- the victoriametrics server + a central victoriametrics agents + node exporter
model: pull (victoriametrics is gathering data from remote node exporters and send it to victoriametrics)
pros:
can use the "node exporter full" grafana dashboard
memory efficient, victoriametrics is awesome
cons:
need to reach all the remote nodes
- the victoriametrics server + a victoriametrics agent on each remote server + node exporter
model: push (victoriametrics agents connects to the local node exporter and send it to the remote victoriametrics)
pros:
can use the "node exporter full" grafana dashboard
memory efficient, victoriametrics is awesome
cons:
a bit more maintenance
security? you need to allow remote agents to write to your database
#nixos #grafana #collectd #VictoriaMetrics #prometheus

Gergely Nagy 🐁 · @algernon
1147 followers · 7563 posts · Server trunk.mad-scientist.clubTruth be told, what I have in mind is very similar to what #collectd does. I pull in data at various - smallish - intervals, and then do stuff with it. The main difference is that I find #collectd pretty limiting, it doesn't allow me to do some more complicated collection.
Like, I want to collect network stats from a bunch of docker containers. I could write a custom collectd plugin for that, perhaps in Perl. But it doesn't really fit the mental model I have.
Gergely Nagy 🐁 · @algernon
1147 followers · 7563 posts · Server trunk.mad-scientist.clubFor my #monitoring setup, I pretty much settled on #collectd + #riemann + #riemann-dash. The big remaining question is: where do I run the dashboard?
Do I run it on the server, slap some http basic auth on top and call it a day?
Or do I run it on my PC, and access Riemann through a port forward or VPN or something? (if so, which one?)
#monitoring #collectd #riemann
Gergely Nagy 🐁 · @algernon
1147 followers · 7563 posts · Server trunk.mad-scientist.clubMy current thinking is that I can pretty easily get this done with #Riemann. I'd use #collectd for the basic server stats, and custom tools for service health & letsencrypt certs.
For certs, I can just hook into the certbot cron jobs, and whenever a cert is refreshed, I'll push a status to #riemann with long expiration time. To make sure I have all the hosts, I'd write another tool that looks at all the certs, and pushes a status to riemann for any that doesn't have one yet.

Frehi · @frehi
64 followers · 499 posts · Server fosstodon.org
cr0n0s :tux: 📡🇵🇪 · @cr0n0s
480 followers · 2533 posts · Server social.tchncs.de
Graficar métricas de #collectd con #Grafana https://www.linuxito.com/cloud/1116-graficar-metricas-de-collectd-con-grafana
