CopernicusECMWF · @CopernicusECMWF
377 followers · 45 posts · Server masto.ai
Join the #CopernicusAtmosphere Monitoring Service upcoming Policy User Workshop (PUW) 7th edition, co-organized by the Joint Research Center.
🗓️ 4 October 2023
📍🇬🇷 Athens, Greece
Check the agenda & register here 👉 https://atmosphere.copernicus.eu/7th-cams-policy-user-workshop?utm_source=socialmedia&utm_medium=ma&utm_campaign=event-7thcamspuw
#copernicusatmosphere #cleanair #airquality #workshop
CopernicusECMWF · @CopernicusECMWF
334 followers · 40 posts · Server masto.aiIs cutting emissions contributing to #GlobalWarming?
An analysis from #CopernicusAtmosphere Monitoring Service & #C3S scientists, concludes that it is too early to attribute the 2023 warm temperatures to the recent reductions in aerosols.
#globalwarming #copernicusatmosphere #c3s
CopernicusECMWF · @CopernicusECMWF
334 followers · 40 posts · Server masto.ai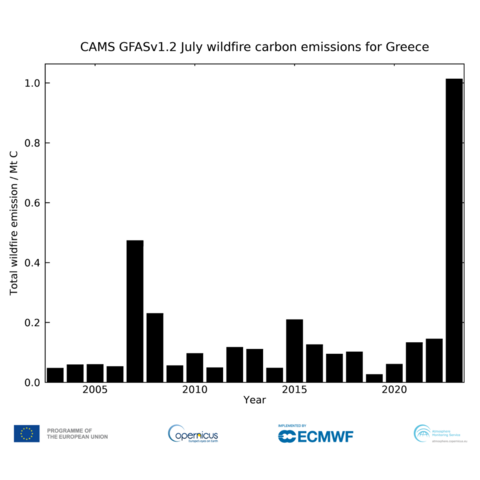
🔥🇬🇷 #Greece #wildfire emissions have been the highest for a month of July in two decades, according to data from the #CopernicusAtmosphere Monitoring Service’s Global Fire Assimilation System.
Read more about the wildfires in the Mediterranean 👉https://atmosphere.copernicus.eu/greece-sees-its-most-intense-wildfire-emissions-july-record?utm_source=socialmedia&utm_medium=ma&utm_campaign=news-mediterraneanfires
#greece #wildfire #copernicusatmosphere

Mark Parrington · @m_parrington
876 followers · 263 posts · Server airpollution.scienceNumerous #wildfires across Canada and easter Russia and generating huge amounts of thick smoke which is being transported thousands of kilometres, including to the high #Arctic in the #CopernicusAtmosphere 5-day aerosol optical depth forecast initialized 16 July 00 UTC https://ads.atmosphere.copernicus.eu/cdsapp#!/dataset/cams-global-atmospheric-composition-forecasts?tab=overview
#wildfires #arctic #copernicusatmosphere #arcticfires #wildfire #smoke #aerosol
CopernicusECMWF · @CopernicusECMWF
287 followers · 33 posts · Server masto.ai
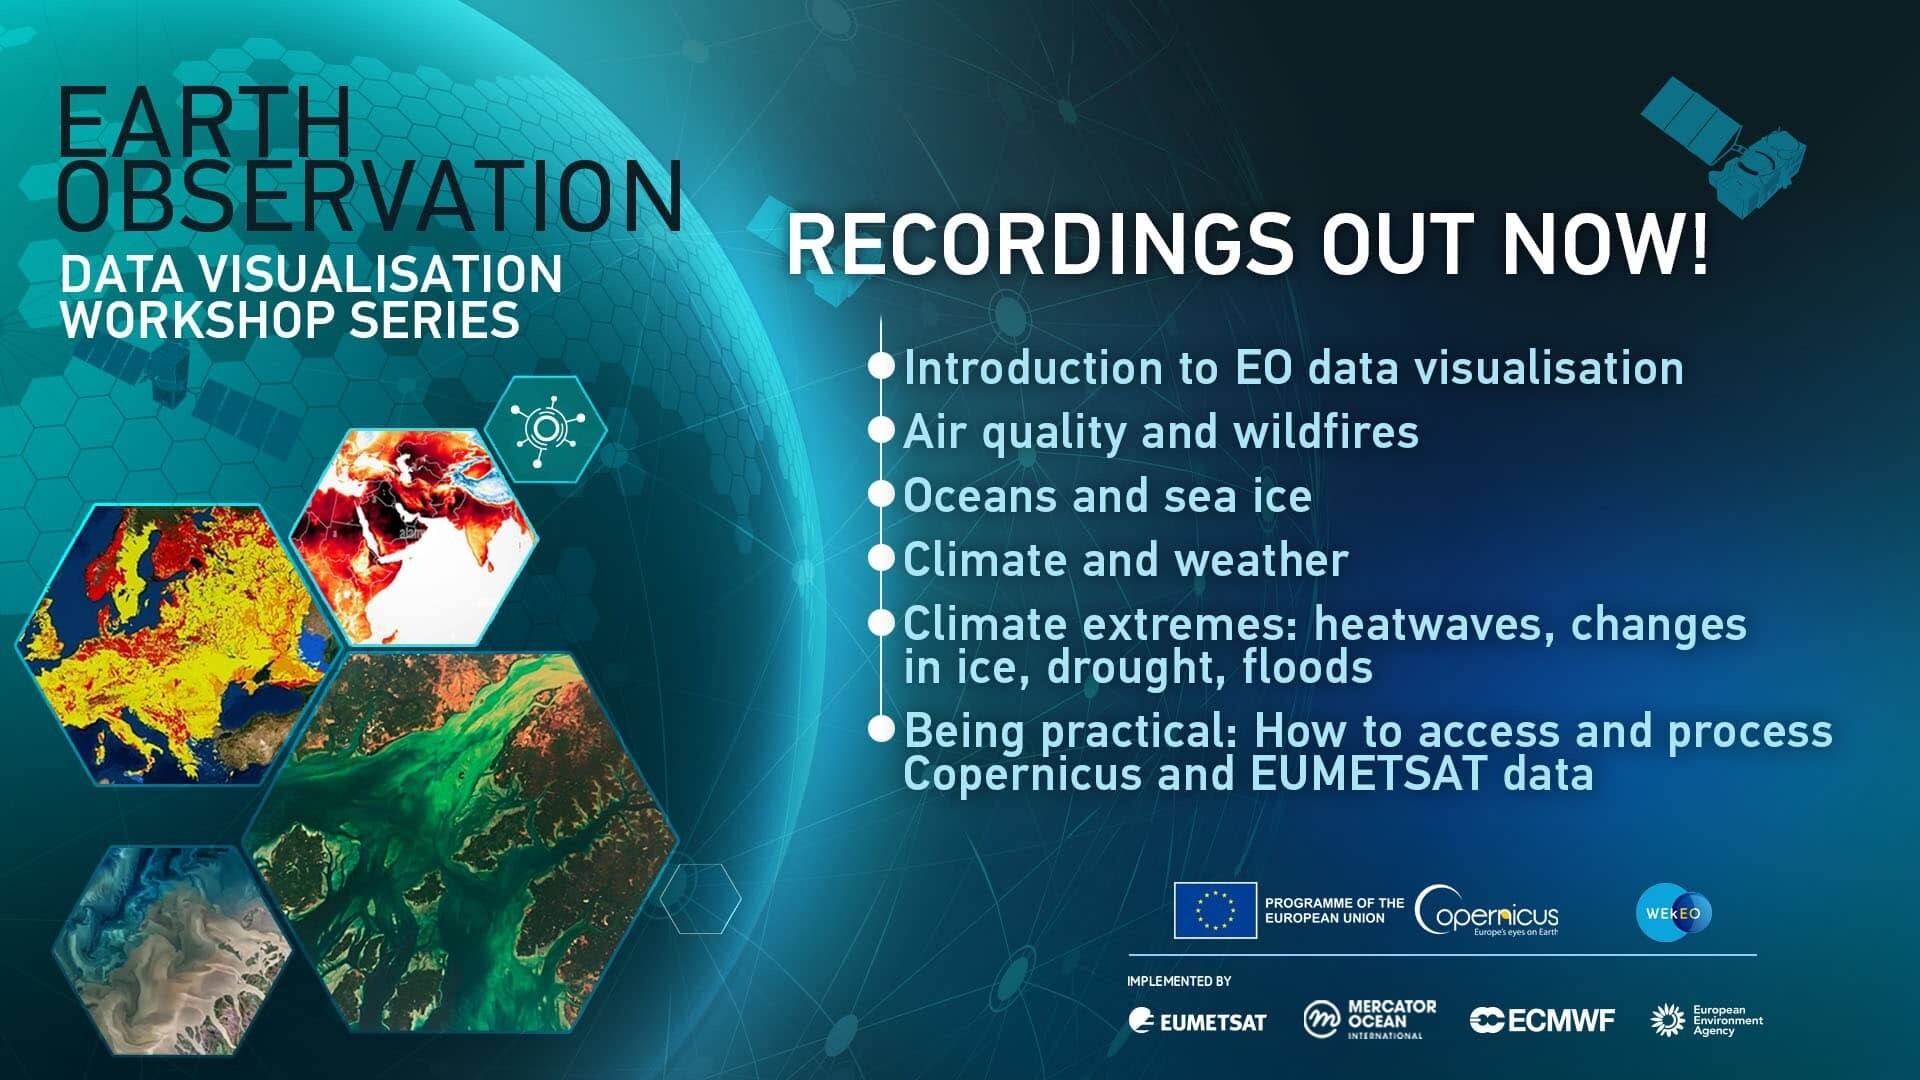
#CopernicusAtmosphere Monitoring Service and #CopernciusClimate Change Service (#C3S) contributed their expertise to a workshop series on visualisation and storytelling using Copernicus and EUMETSAT #EO data.
Check out the recordings and tell your own EO story:
#C3S 👉https://climate.copernicus.eu/workshops-explore-data-visualisation-copernicus-and-eumetsat?utm_source=socialmedia&utm_medium=ma&utm_campaign=news-journalistsworkshops
CAMS 👉 https://atmosphere.copernicus.eu/workshops-explore-data-visualisation-copernicus-and-eumetsat?utm_source=socialmedia&utm_medium=ma&utm_campaign=news-journalistsworkshops
#copernicusatmosphere #copernciusclimate #c3s #eo
CopernicusECMWF · @CopernicusECMWF
61 followers · 19 posts · Server masto.ai
Did you miss our last #TwitterSpaces episode on seasonal allergies? 🍃
🎙️ You can check the replay in our Youtube channel and learn about the #CopernicusAtmosphere Monitoring Service' tools ☞ https://bit.ly/3LrzOv2
#twitterspaces #copernicusatmosphere
DisastersRadix · @DisastersRadix
126 followers · 492 posts · Server sciences.social
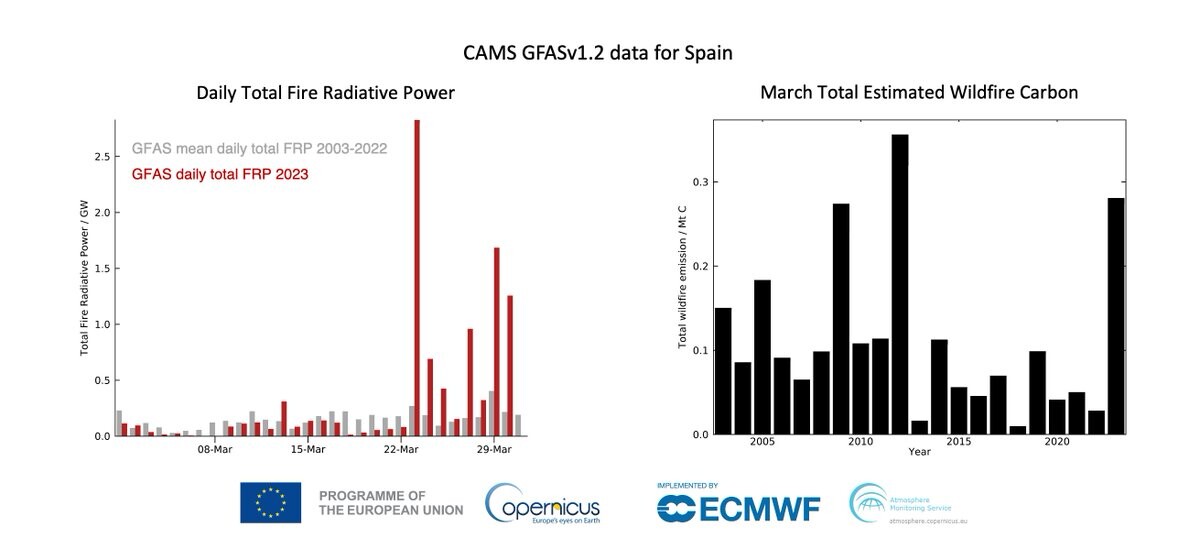
Winter was dry in Spain this year, and recent temperatures unusually high for the season.
This contributes to very high fire risks. And brings us back to earlier tweets, on links between #LandUse and #Wildfires.
---
RT @CopernicusECMWF
#Wildfires 🔥 of unusual intensity for the season have hit areas of Spain 🇪🇸 , according to data from the #CopernicusAtmosphere Monitoring Service. GFAS shows this to be the highest wildfire emissio…
https://twitter.com/CopernicusECMWF/status/1641810305637396481
#landuse #wildfires #copernicusatmosphere
CopernicusECMWF · @CopernicusECMWF
33 followers · 10 posts · Server masto.ai#CopernicusAtmosphere monitoring 1st #SaharanDust transport to Europe this year 🔎💨
Our forecasts predict long-range transport across #Portugal #Spain & #France towards north & east Europe in the coming days.
Stay tuned for updates and read more here: http://bit.ly/3xEhnNh
#copernicusatmosphere #saharandust #portugal #spain #france
Mark Parrington · @m_parrington
876 followers · 263 posts · Server airpollution.science#SaharanDust transport episode predicted across the Iberian Peninsula, France and on to northern & central Europe over the coming few days in the #CopernicusAtmosphere Monitoring Service aerosol optical depth forecast initialized 19 February at 00 UTC.
More info: https://atmosphere.copernicus.eu/
Data access: https://ads.atmosphere.copernicus.eu/cdsapp#!/dataset/cams-global-atmospheric-composition-forecasts?tab=overview
#Dust #AirPollution #AirQuality #Aerosol #EarthObservation #Atmosphere #MineralDust
#saharandust #copernicusatmosphere #dust #airpollution #airquality #aerosol #earthobservation #atmosphere #mineraldust
Mark Parrington · @m_parrington
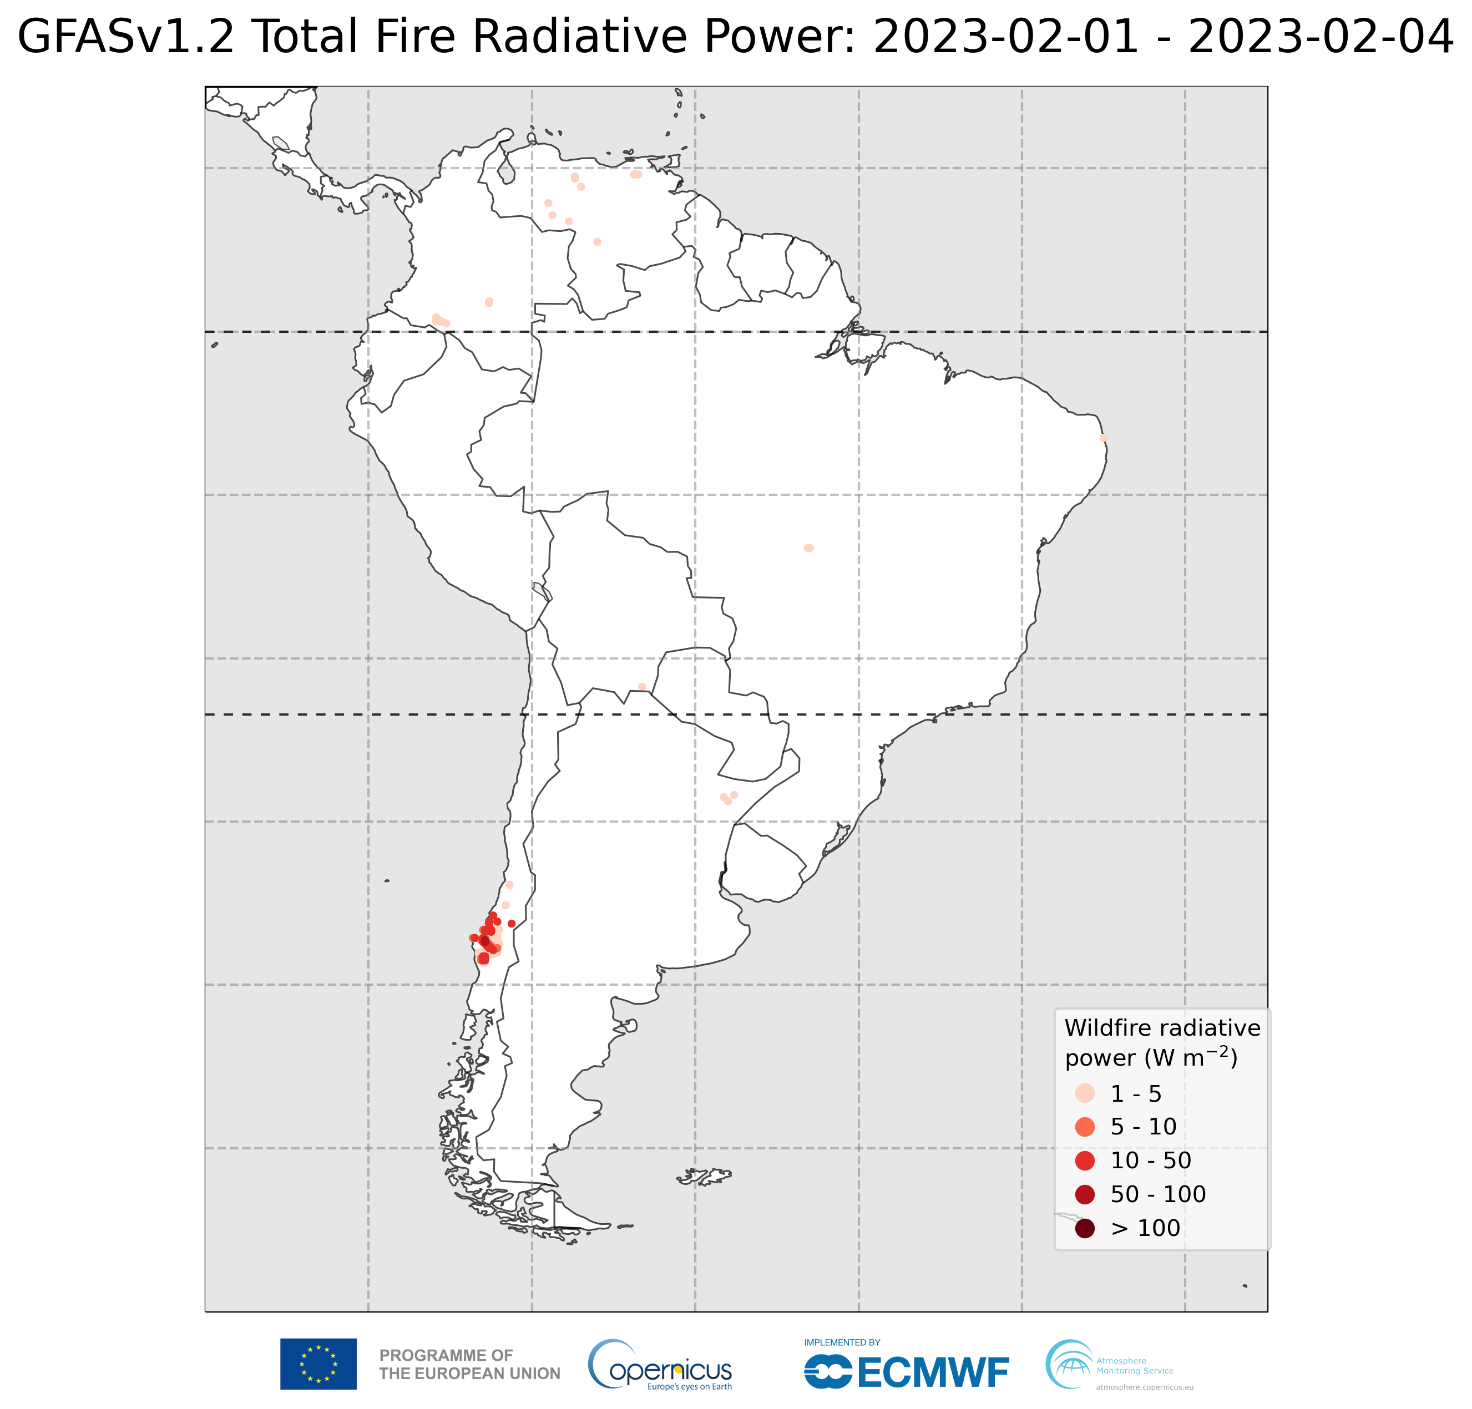
876 followers · 263 posts · Server airpollution.scienceContinuing #wildfires in #Chile with impressive extent of smoke over the Pacific ocean in the #CopernicusAtmosphere Monitoring Service aerosol optical depth forecast initialized 7 February 00 UTC. Change in winds towards South Atlantic also coming in the next few days.
More information on CAMS monitoring of these fires was published today on our website at https://atmosphere.copernicus.eu/wildfires-ravage-chile-cams-monitors-situation
@CopernicusECMWF @wildfirescience @atmochem @vhpeuch #ECMWF #aerosols #IncendiosForestales
#wildfires #chile #copernicusatmosphere #ecmwf #aerosols #incendiosforestales
CopernicusECMWF · @CopernicusECMWF
24 followers · 7 posts · Server masto.ai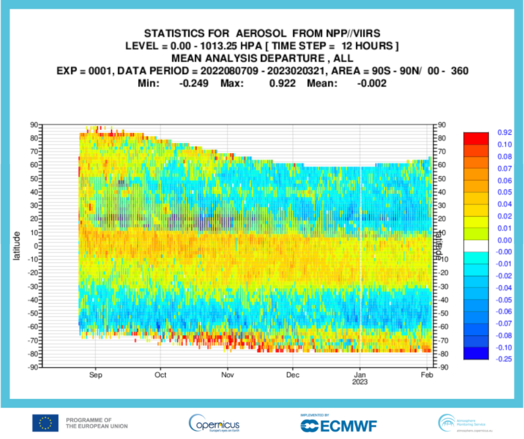
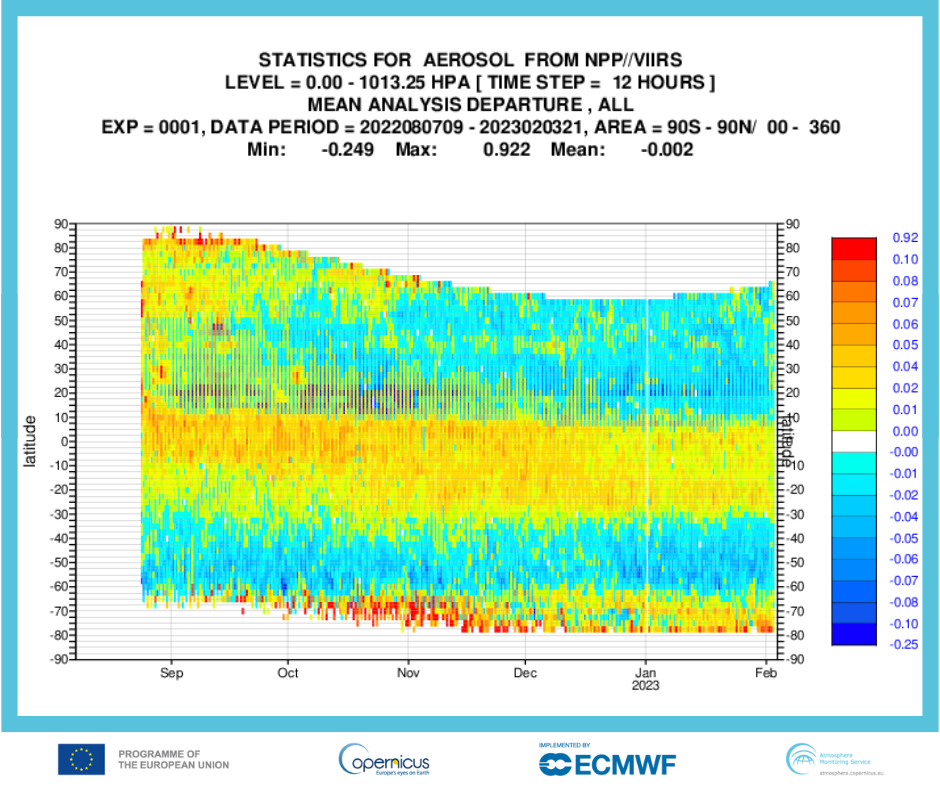
The latest update from our #CopernicusAtmosphere Monitoring Service: Starting from 1 February, we have begun assimilating Visible Infrared Imaging Radiometer Suite (VIIRS) aerosol optical depth observations.
This integration will ensure the continuity of our aerosol assimilation and enhance the performance of our forecasts.
Stay up-to-date with all the details: http://bit.ly/3I9Rxa1
Mark Parrington · @m_parrington
876 followers · 263 posts · Server airpollution.science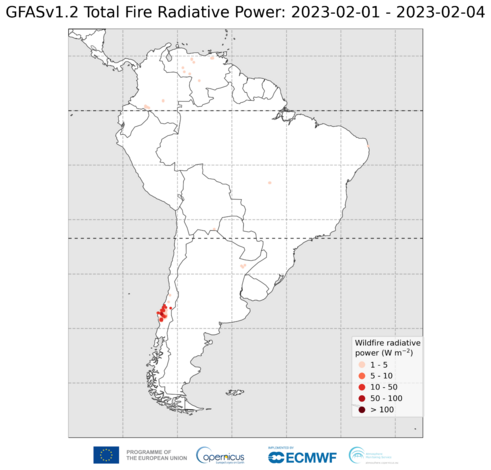
Sheer intensity of the many #wildfires in Chile reflected in #CopernicusAtmosphere #ECMWF Global Fire Assimilation System (GFAS) fire radiative power (FRP), based on MODIS🛰️ obs. Highest intensity fires in Araucania and Biobio where daily total FRP has been much greater than 2003-2022 mean, leading to the highest estimated Jan-Feb emissions (carbon shown but similar for aerosols) in the GFAS dataset (only up to 4 Feb in 2023!)
@CopernicusECMWF @wildfirescience #wildfire #incendiosforestales
#wildfires #copernicusatmosphere #ecmwf #wildfire #incendiosforestales
Mark Parrington · @m_parrington
876 followers · 263 posts · Server airpollution.scienceIncredibly high intensity of the devastating #wildfires in Chile🇨🇱 producing thick smoke plumes which are heading out over the Pacific Ocean as shown in the #CopernicusAtmosphere Monitoring Service #ECMWF 5-day forecast of total aerosol optical depth initialized on 5 February at 00 UTC. Noting also smoke from increasing number of early season fires in Colombia🇨🇴 further north.
@CopernicusEU @wildfirescience @atmochem @vhpeuch @SanGasso @pierre_markuse
#wildfires #copernicusatmosphere #ecmwf #atmoschem #incendiosforestales
Mark Parrington · @m_parrington
876 followers · 263 posts · Server airpollution.science
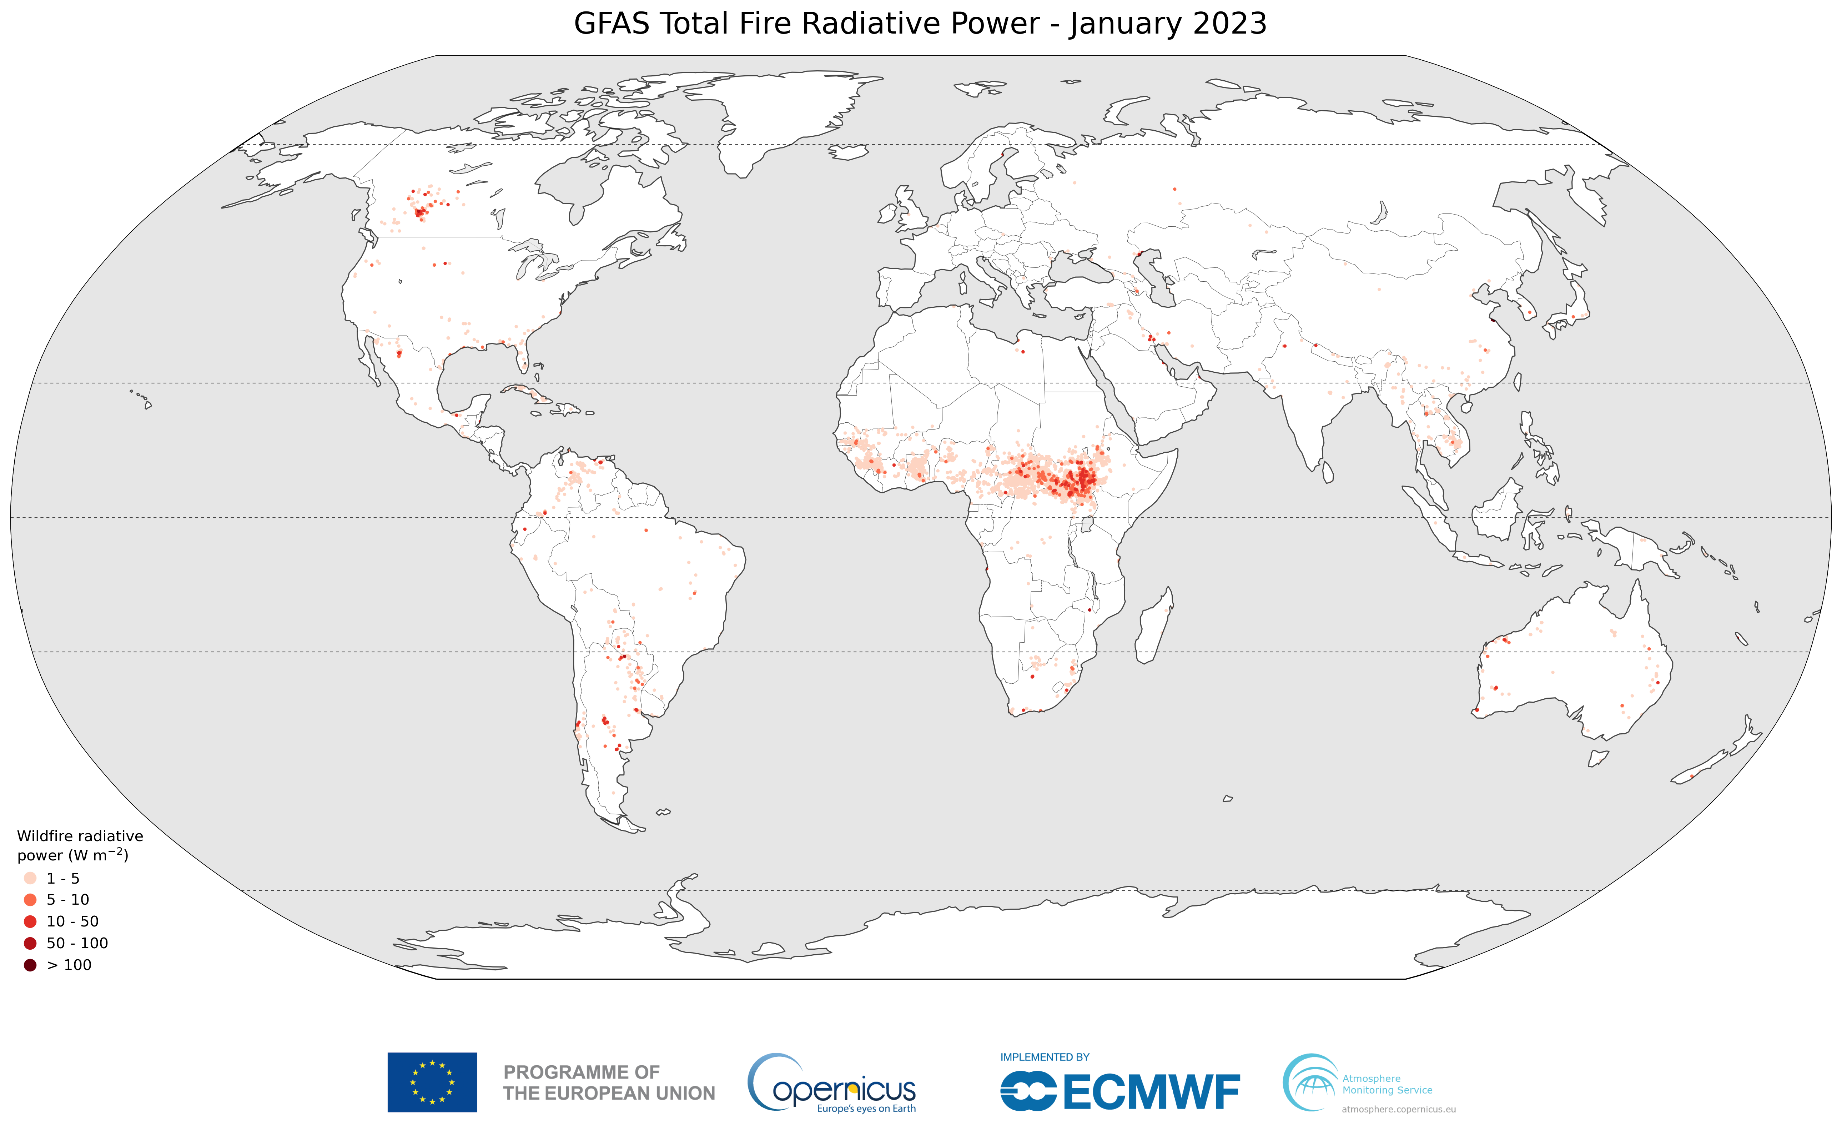
Global #WildFires #OpenBurning intensity & emissions for January 2023 in the #CopernicusAtmosphere Monitoring Service #ECMWF GFAS data https://confluence.ecmwf.int/display/CKB/CAMS%3A+Global+Fire+Assimilation+System+%28GFAS%29+data+documentation. Notable fires in Mexico & S America, with peak fire season in N tropical Africa. 2nd lowest January total emissions since 2003. Hotspots across W Canada during Jan related more to gas/oil extraction activities rather than fires.
Data access https://ads.atmosphere.copernicus.eu/cdsapp#!/dataset/cams-global-fire-emissions-gfas?tab=overview
@wildfirescience #WildlandFires #ForestFires #IncendiosForestales
#wildfires #openburning #copernicusatmosphere #ecmwf #wildlandfires #forestfires #incendiosforestales
Mark Parrington · @m_parrington
876 followers · 263 posts · Server airpollution.science
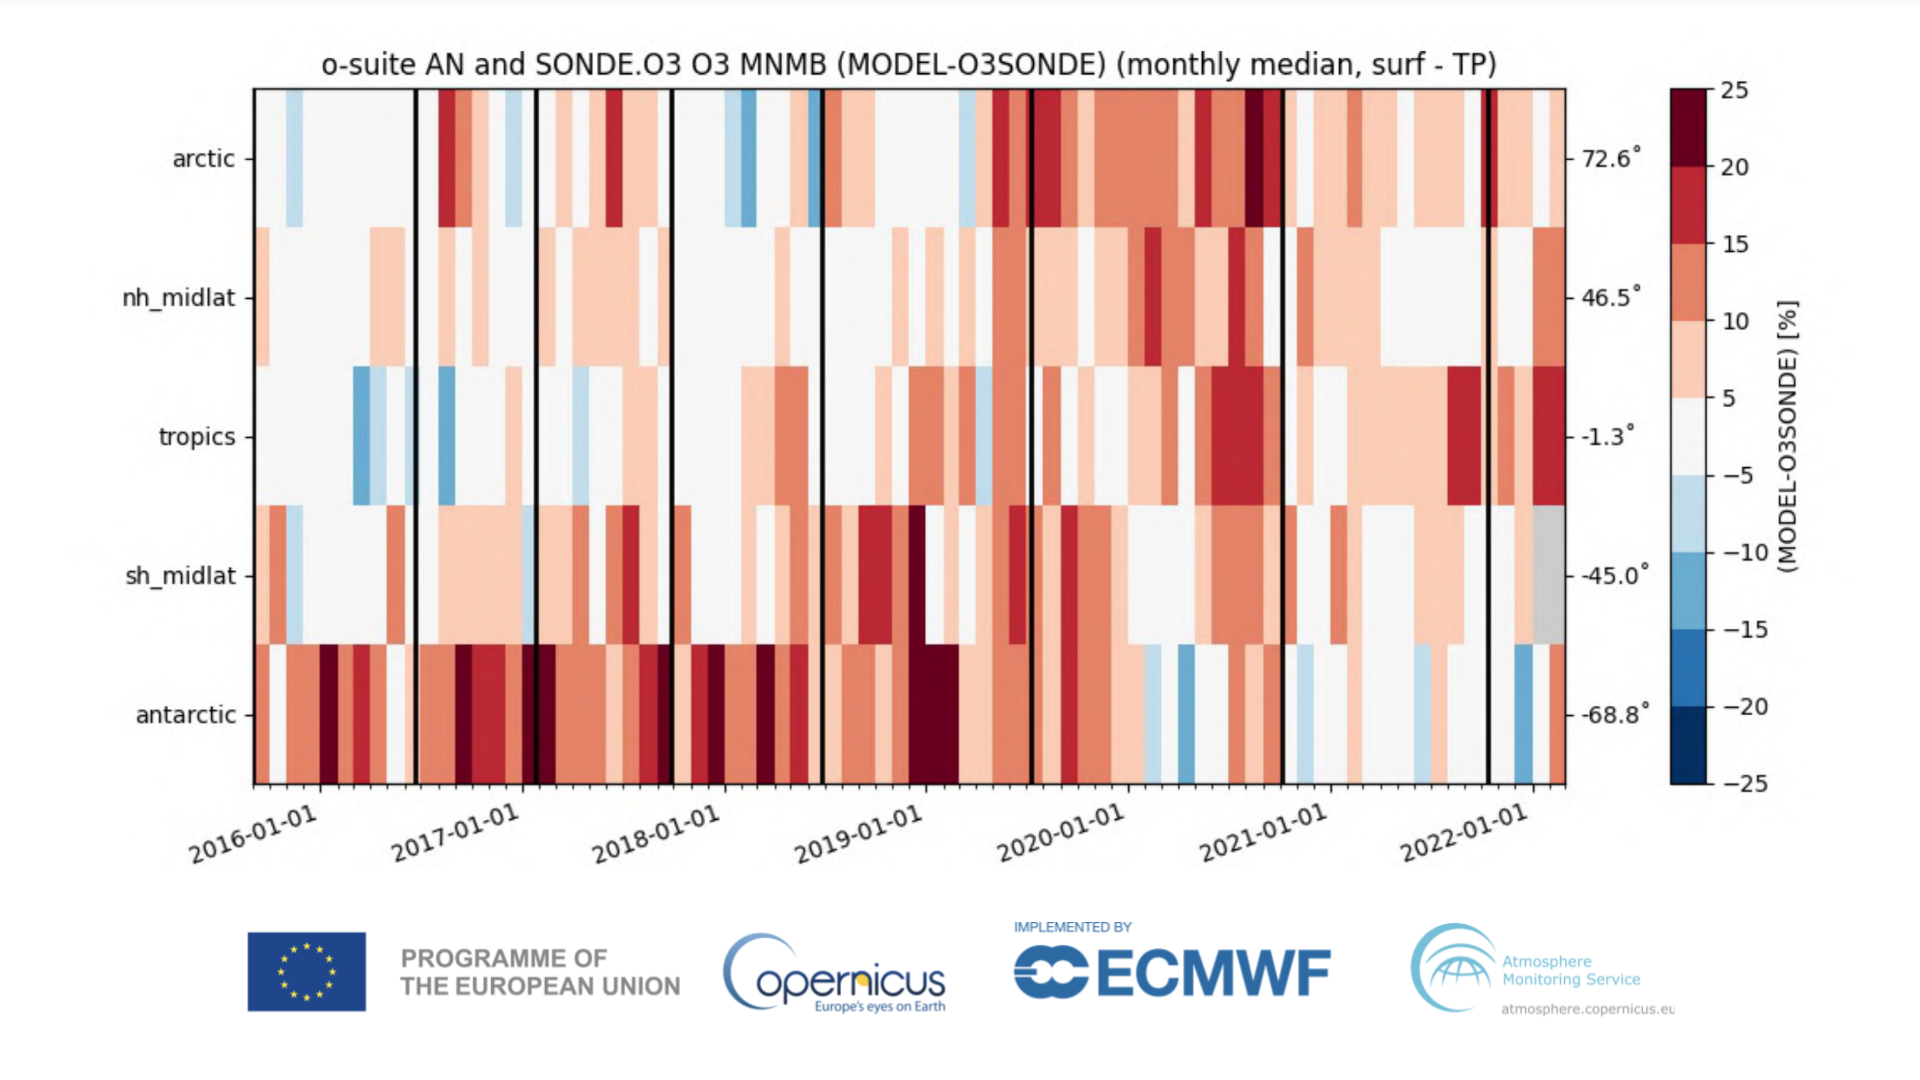
Quality assurance is essential to atmospheric composition and #AirQuality forecasts produced by the #CopernicusAtmosphere Monitoring Service.
Read more about our EQC activities, including long-term performance of tropospheric ozone and score cards when new model upgrades are implemented as shown below, at https://atmosphere.copernicus.eu/cams-air-quality-data-quality-assured
Quarterly validation against independent observations https://atmosphere.copernicus.eu/quality-assurance
@CopernicusECMWF @vhpeuch @atmochem #atmoschem #airpollution #EarthObservation
#airquality #copernicusatmosphere #atmoschem #airpollution #earthobservation
CopernicusECMWF · @CopernicusECMWF
24 followers · 7 posts · Server masto.aiGlobal #wild & vegetation fires in 2022 had generated around 1,455 Megatonnes of carbon emissions. Europe and South America saw the highest emissions in the last 20 years with France and Spain being two of the worst affected European countries.
Watch our animation of the global fire activity in 2022 ⬇️ 🔥
Visit our #CopernicusAtmosphere wildfire monitoring page: http://bit.ly/3pgiZXN
Mark Parrington · @m_parrington
792 followers · 226 posts · Server airpollution.science
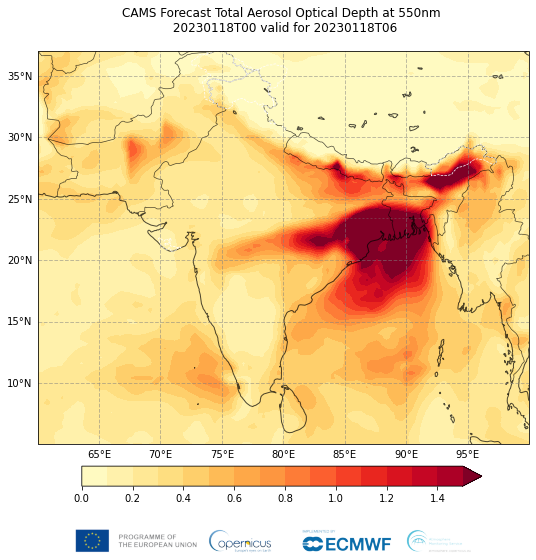
Comparing high AOD in the #CopernicusAtmosphere Monitoring Service forecast (init. 00 UTC and valid for 06 UTC on 18 Jan) with Aqua #MODIS visible imagery from 18 Jan showing the huge extent of the area under the haze.
#AirPollution #AirQuality #ECMWF @CopernicusECMWF @vhpeuch @atmochem
#copernicusatmosphere #MODIS #airpollution #airquality #ecmwf
Mark Parrington · @m_parrington
792 followers · 225 posts · Server airpollution.scienceWintertime #AirPollution in South Asia with a huge plume of very high aerosol optical depth (> 1) across the Indo-Gangetic Plain and Bay of Bengal shown in the #CopernicusAtmosphere Monitoring Service 5-day forecast initialized on 18 January at 00 UTC.
CAMS global operational forecast #OpenData available from https://ads.atmosphere.copernicus.eu/cdsapp#!/dataset/cams-global-atmospheric-composition-forecasts?tab=overview
#airpollution #copernicusatmosphere #opendata #airquality #earthobservation #atmoschem #aerosol
CopernicusECMWF · @CopernicusECMWF
13 followers · 5 posts · Server masto.aiThe ozone layer is recovering, as stated by United Nations Environmental Programme Ozone Secretariat, but the 2022 #ozonehole was within the 15 largest in #CopernicusAtmosphere/#C3S 44 year record and closed later than usual (similar to 2021 and 2020).
Read more about 3 peculiar Antarctic ozone hole seasons in a row at https://bit.ly/3VWBpgi
#ozonehole #copernicusatmosphere
Mark Parrington · @m_parrington
793 followers · 224 posts · Server airpollution.science#SaharanDust predicted to bring to some impressively high surface concentrations of PM10 (> 100 μg/m3) across the central Mediterranean over the next couple of day in this animation of the #CopernicusAtmosphere Monitoring Service European regional ensemble dust forecast initialiazed on 17 January at 00 UTC.
CAMS #OpenData forecasts available from https://ads.atmosphere.copernicus.eu/cdsapp#!/dataset/cams-europe-air-quality-forecasts
More info https://regional.atmosphere.copernicus.eu
#AirPollution #AirQuality #MineralDust @CopernicusECMWF @CopernicusEU @vhpeuch
#saharandust #copernicusatmosphere #opendata #airpollution #airquality #mineraldust