
Adam Fortuna · @adam
222 followers · 601 posts · Server ruby.socialThis D3.js data visualization I’m working on started as a page on my (Next.js) blog, but I think it’ll be better long-term to have it in its own repo.
After some planning for what I’ll need, I think The Pudding’s Svelte Starter Repo is the way to go. Coming from a group whose primary focus is D3.js data Viz, this looks far better than anything I could come up with.
Anyone have any recommended resources for learning Svelte?
#d3 #svelte #sveltekit #dataviz #d3js

Rami Krispin :unverified: · @ramikrispin
1034 followers · 537 posts · Server mstdn.social
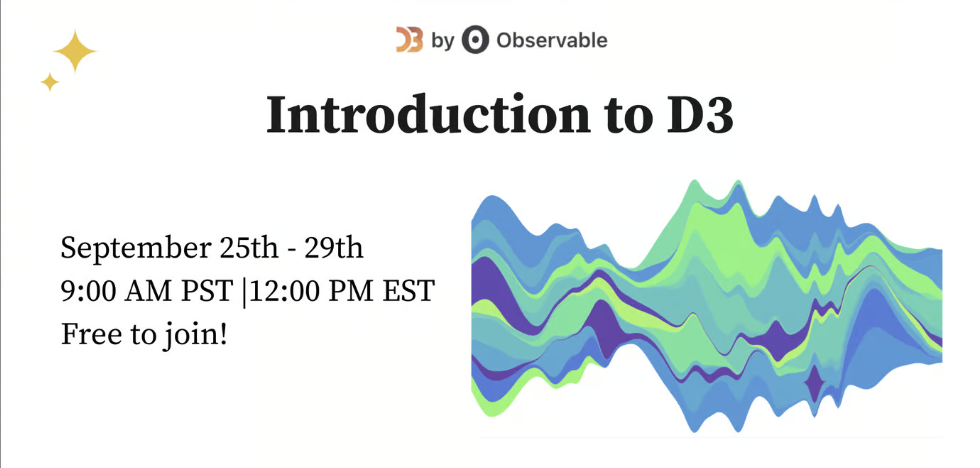
Introduction to D3 course ❤️
If you are looking for a resource for learning #d3 check the upcoming crash course Introduction to D3 by Paul Buffa. D3 is one of the leading frameworks for interactive data visualization on the web. This five-part course focuses on:
✅ D3 & Web-Based Data Visualization
✅ Scatterplots
✅ Lines charts and Bar charts
✅ General Update Pattern
✅ Thinking in D3
More details are available here 👇🏼
https://observablehq.com/@observablehq/introduction-to-d3-course
#JavaScript #DataScience #datavisualization #dataviz #d3

Jeff Allen · @jamaps
141 followers · 24 posts · Server mapstodon.space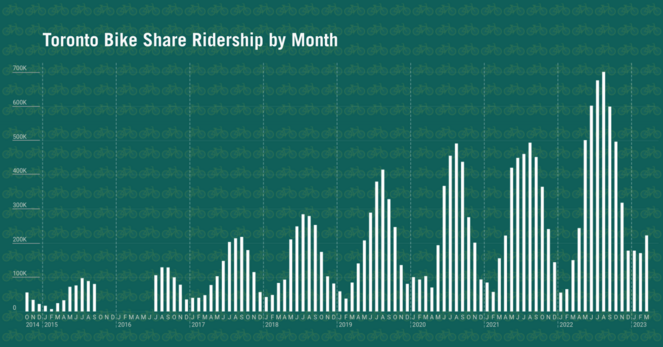

Di · @didoesdigital
191 followers · 26 posts · Server bne.socialVisualisation annotations are useful for directing readers towards insights and unusual data points. And yet there aren’t a lot of examples of how to make them programmatically for changing, interactive visualisations.
So I wrote about the approach I cobbled together for my recent snakes vis, which I hope ends up being useful to someone else:
https://observablehq.com/@didoesdigital/annotations-using-paths-and-markers
#dataviz #datavisualization #svg #d3

moritz · @moritz
1964 followers · 284 posts · Server vis.socialHey #map #cartography #d3 specialists — have any of you encountered this rewinding issue with d3-contours and mapbox? It's driving @flavio and me slightly crazy… any pointers appreciated.

Ashley Indeedy 🏳️🌈 · @ash
1058 followers · 4581 posts · Server bne.social
Turns out D3's equirectangular projection is drawing those lines along the shortest path of the sphere. Which seems counterintuitive, but you can see it in this yellow point-to-point line curving like a flight path.
My fix was to interpolate extra points between the start and end points of the boxes. The shortest path between the interpolated points is still curved along the earth, but it's much less perceptible. #gis #d3
Ashley Indeedy 🏳️🌈 · @ash
1058 followers · 4581 posts · Server bne.social
Weird discovery: I'm working on a D3 equirectangular (plate carrée) map. So longitude and latitude should map directly to pixels.
And it does for the most part. But when I try to draw boxes that I'd expect to be rectangular, they come out warped. (Those red lines should be following the lines of latitude on the map.) #gis #d3

Sebastian Lammers · @seblammers
537 followers · 959 posts · Server vis.social⭐ New project out today:
https://storiesfromthenightsky.netlify.app/
The light from the #stars travels for years (and years) until it reaches your eyes. This #interactive #map of the night sky shows you for each star what happened on Earth when the light started traveling from the star to you. That way, any star has a story to tell you. You can zoom in, move around and hover all the stars to reveal the historical events they are connected to.
Built with #svelte #d3 and #sveltekit
#sveltekit #d3 #svelte #map #interactive #stars
JustinG · @JustinG
191 followers · 235 posts · Server fosstodon.orgNever ever use a common word for your open source library’s name it you actually want people to effectively search for it, discover examples, etc.
This is the third time I’ve tried to get into Plot.js and the horrible search experience is just killing my appetite to learn it. D3.js might be complicated, but you could always find examples of approximately what you were trying to do.

Ale𝕏 🍜 · @mojoaxel
232 followers · 605 posts · Server social.tchncs.de@seblammers The course look really great, but I mostly work on projects that are very, very limited in bundle size. This is why I usually can not use #3d and why I tend to create visualisations just with #svelte and vanilla #svg which works surprisingly well.
Hopefully in the future a will find the time to dive more into #d3 and create more sophisticated visualisations!
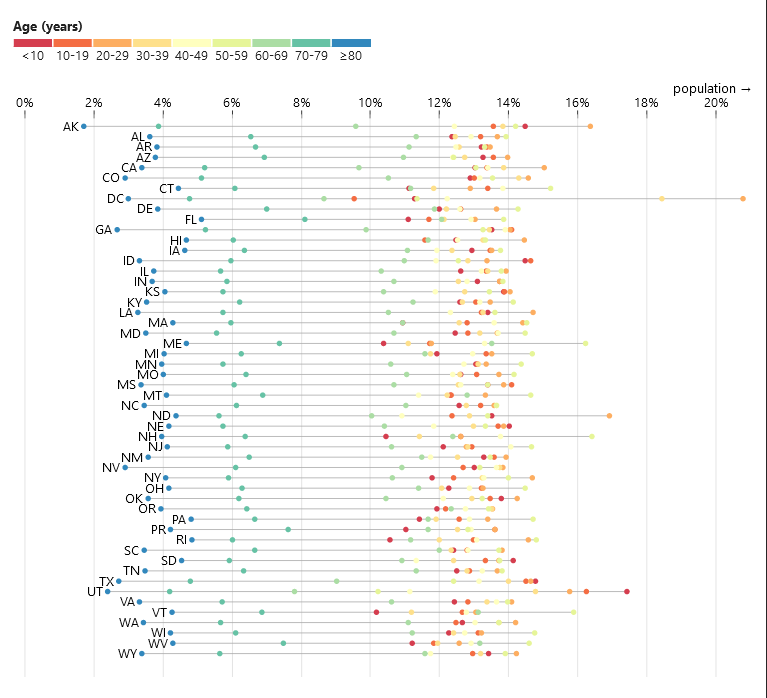
Sebastian Lammers · @seblammers
495 followers · 866 posts · Server vis.social
I've just finished another #d3 example in #svelte
This time, it's a dot plot. Very versatile type of #dataviz that can be used creatively.
Again I learned the most while crafting the colour-legend, this time for a ordinal scale.
Now I have a great idea I can use for my upcoming big big project.
Stay tuned!
Sebastian Lammers · @seblammers
488 followers · 862 posts · Server vis.social
Did you know that #d3 provides more than 80 world #map #projections?
I think that's pretty crazy! And it just takes one changed line of code to switch between most of the projections.
Here you can flip through all 84 world projections that *just work* in #svelte and #d3 without having to change any other code:
https://svelte.dev/repl/1ee2000a93d748bea7a08aba8d55d6f2?version=4.1.1
(There are even more projections, but they require a few little tweaks to work.)
Which projection is your favorite? Which do you think is the most ridiculous?
Sebastian Lammers · @seblammers
485 followers · 854 posts · Server vis.social
I just ported over this classic #choropleth map from pure #d3 to a #svelte version.
This time, I learned a lot while creating a custom legend component that is tucked right above the #map.
Play with the code here:
https://svelte.dev/repl/7d7c651eb5b746aab45fa9735bb09956?version=4.1.1

Good Videogame Music · @goodvgm
8 followers · 153 posts · Server mstdn.social
Good VGM 150 - Diablo III - New Tristram
#DiabloIII #Diablo3 #D3 #Blizzard #Diablo #VideoGameMusic #videogames #music #vgm
#vgm #Music #videogames #videogamemusic #diablo #blizzard #d3 #diablo3 #diabloiii

Fenottes · @Fenottes
27 followers · 467 posts · Server mas.to
Fenottes · @Fenottes
27 followers · 467 posts · Server mas.to
Le groupe de la réserve de l'#OL en #D3 est connu
#Académie
(FFF : https://olplus.fr/r8Yiq)

Cilusse · @cilusse
6 followers · 97 posts · Server mstdn.social
Assassins at @chichesterft
System, video walls, tech and art….and USA 🇺🇸
#assassins #show #theatre #chichester #cft #england #south #uk #tech #theatretech #video #production #bluei #ledwall #disguise #d3
#d3 #disguise #ledwall #bluei #production #Video #theatretech #Tech #UK #south #england #CFT #Chichester #theatre #show #assassins

🍄🌈🎮💻🚲🥓🎃💀🏴🛻🇺🇸 · @schizanon
407 followers · 6043 posts · Server mas.to
Bedtime #supplements:
- more #stJohnsWort
- more #krillOil
- #gaba
- #magnesium
- #theanine
- more #taurine
- #elderberry
- more #d3
- #melatonin
- benadryl (during cottonwood season)
#melatonin #d3 #elderberry #taurine #theanine #magnesium #gaba #krilloil #stjohnswort #supplements
🍄🌈🎮💻🚲🥓🎃💀🏴🛻🇺🇸 · @schizanon
407 followers · 6017 posts · Server mas.to
My morning #supplements:
- #Organic #multivitamin
- #StJohnsWort
- #Ginseng
- #Ginko
- #PineBark
- #5HTP
- #Choline
- #Cysteine
- #Carnitine
- #Taurine
- #Tyrosine
- #Glucosamine
- #D3
- #vitaminC gummy
- #krillOil
- #probiotic
#supplements #probiotic #krilloil #vitaminc #d3 #Glucosamine #tyrosine #taurine #carnitine #cysteine #choline #5htp #pinebark #ginko #ginseng #stjohnswort #multivitamin #organic
Sebastian Lammers · @seblammers
446 followers · 787 posts · Server vis.social
Porting over simple #dataviz examples from "pure d3" to #svelte and #d3 is a fun little challenge :)
Play with the code here:
https://svelte.dev/repl/4542a7dcb2704587a355914c6f05ed63
I think there will be much more in the future.
Any specific chart type you'd like to see sveltified?
(This is supposed to be a starting point for anybody to play around with, not a fully fledged chart.)