
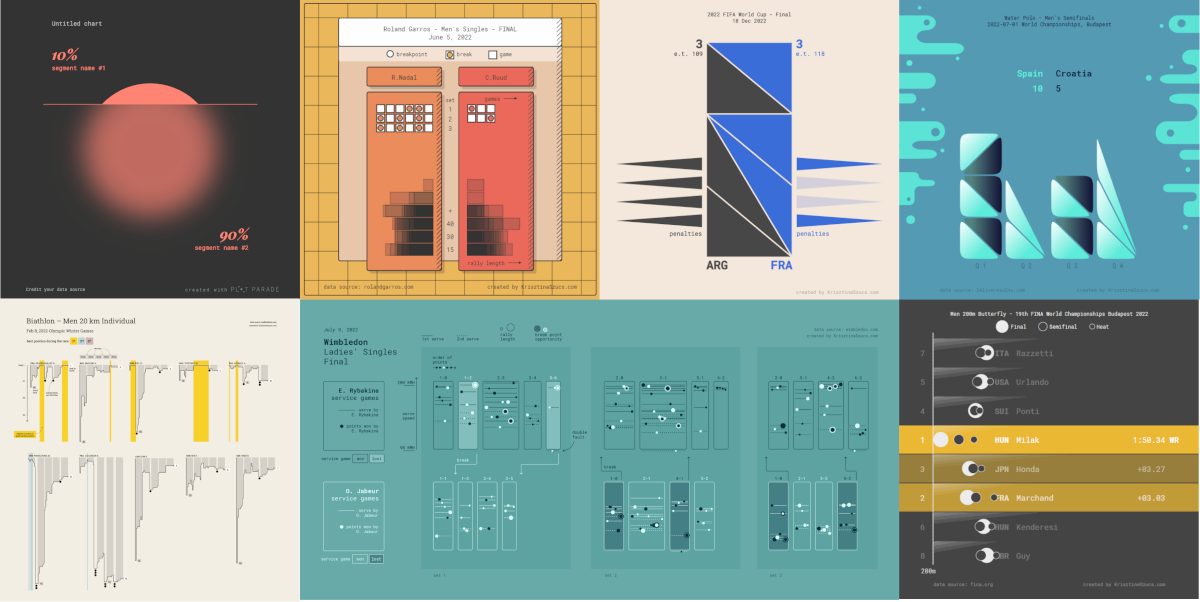
Krisztina Szűcs · @krisztina
281 followers · 9 posts · Server vis.socialReady for the US Open final?
#d3js #dataviz #tennis #usopen

Adam Fortuna · @adam
222 followers · 601 posts · Server ruby.socialThis D3.js data visualization I’m working on started as a page on my (Next.js) blog, but I think it’ll be better long-term to have it in its own repo.
After some planning for what I’ll need, I think The Pudding’s Svelte Starter Repo is the way to go. Coming from a group whose primary focus is D3.js data Viz, this looks far better than anything I could come up with.
Anyone have any recommended resources for learning Svelte?
#d3 #svelte #sveltekit #dataviz #d3js

Di · @didoesdigital
191 followers · 26 posts · Server bne.social
For a simple method to morph SVG paths into circles using D3, I wrote a little notebook: https://observablehq.com/@didoesdigital/morphing-shapes-into-circles-with-d3
1. Add points to your circle to match the same number of points in your other shape’s path
2. Reverse the path order
3. Translate the outer group by the circle radius
#dataviz #datavisualization #d3js #svg #animation
Di · @didoesdigital
174 followers · 22 posts · Server bne.social
🐍🥳 New data viz! Living among snakes in Queensland, Australia 🥳🐍
https://didoesdigital.com/snakes/
I'm stoked to share my story of snake shenanigans with fun facts, silly animations, and a few happy snaps (opt in!)
Made with #d3js, scrollama, and laughs.
#DataViz #DataVisualization #snakes #nature #Queensland #SunshineCoast #australia #design
#d3js #dataviz #datavisualization #snakes #nature #queensland #sunshinecoast #australia #design

Kathy Reid · @KathyReid
3608 followers · 2194 posts · Server aus.socialSo, it's been a while since I did an #Introduction #ConnectionList #TwitterMigration post where, I find interesting people for you to follow on #Mastodon, and use my reach to more closely connect the #Fediverse :fediverse:
@ANUResearch is the official Mastodon account of #ANU Research (I think, it all looks very legit, but I don't know the person behind the account) #research #university 🇦🇺
@drwaus is the new official account for Digital Rights Watch in Australia (h/t to all the good work Sam @floreani is doing in this space - don't forget to catch her #keynote at @pyconau@fosstodon.org later this month!)
@AoIR is the official Association of #Internet #Researchers account. Read more at https://aoir.org/about 🇺🇸
Professor @nilsph1 works in #knowledge organisation and information retrieval #IR at the Department of Archive, Library and Information Studies at #Oslo Metropolitan University @oslomet :flag-no:
@fionatribe is an #anthropologist, workplace #strategist and #ethnographer who works in #architecture and #OrgDesign 🇦🇺
@dcm is Dimitri Coelho Mollo, an Assistant #Professor in the Philosophy of #AI at #Umeå University :flag-se:
@anders is a #Communication strategist for #AI #Sweden :flag-se:
@rachaelvdm is a #MetaData #librarian #GLAM interested in #nature #art #history 🇳🇱 🇦🇺
@bentarnoff is a technical #writer, who recently wrote a brilliant piece on Joseph #Weizenbaum for The Guardian. You should read it. 🇺🇸
@observablehq is the official account of the #dataviz platform, based on #D3js from @mbostock
That's all for today, don't forget to share your own #ConnectionList, particularly as we say #RIPTwitter ❤️
#introduction #connectionlist #twittermigration #mastodon #fediverse #anu #research #university #keynote #internet #researchers #knowledge #ir #oslo #anthropologist #strategist #ethnographer #architecture #orgdesign #professor #ai #umea #communication #sweden #metadata #librarian #glam #nature #art #history #writer #weizenbaum #dataviz #d3js #riptwitter

יותק'ה · @yotamN
27 followers · 87 posts · Server tooot.im
הרבה זמן רציתי ללמוד לעבוד עם #d3js בשביל ליצור גרפים, ואחרי שיצרתי גרפים פשוטים לבלוג שלי (https://yotam.net/posts/vps-dedicated-cpu/) זה נתן לי מוטיבציה להתעמק.
כמובן שהלכתי להתחיל להכין גרפים על המדינה, ספציפית התחלתי מפיגועים לאורך זמן. כמה הפתעות שנתקלתי בהן: השב"כ הפסיק לפני כמה שנים להבדיל בין ירושלים ושאר ישראל בהקשרי פיגועים ואין מידע ישן יותר מ-2014, שזה חבל כי אני רוצה לראות השפעות לאורך זמן.
אם מישהו מכיר מקור מידע יותר מדויק אשמח לשמוע, בינתיים שוקל לשלוח להם הודעה.

Chris Henrick · @clhenrick
151 followers · 365 posts · Server indieweb.socialThe new #D3JS website is looking mighty fancy and useful!
h/t to @observablehq
#javascript #webdev #dataviz #d3js
wahlatlas.net · @wahlatlas
234 followers · 84 posts · Server norden.social
In Apples Präsentations-Programm Keynote können SVG-Grafiken jetzt direkt eingefügt werden. Das hilft bei vergrößerten Details und den immer höher aufgelösten Bildschirmen. Toll wenn man mit #D3js in der Kartographie arbeitet.

Robert Grant · @robertGrant
150 followers · 46 posts · Server vis.socialHere’s another old thing that might be useful for you. I made this page called DrawMyData a few years back and I’ve never found time (or much reason, to be honest) to extend it into 3 variables, categorical variables, etc.
It is there for you teachers who want a dataset that simply illustrates some point. You click to add points to a scatterplot. You see stats. You save the file. You take the rest of the day off.

MapTheClouds · @maptheclouds
77 followers · 16 posts · Server mapstodon.spaceCity Tiles 🌆
#D3js #Nextzen #OSMBuildings #VectorTiles #maps #buildings #romania #maptheclouds #travel #cartography #arts #perspective #design #motiongraphics #cgi #timisoara #bucuresti #clujnapoca #brasov
#d3js #nextzen #osmbuildings #vectortiles #maps #Buildings #Romania #maptheclouds #travel #cartography #arts #perspective #design #motiongraphics #cgi #timisoara #bucuresti #clujnapoca #brasov

Jan Deppisch · @netzartist
98 followers · 17 posts · Server mastodon.social#svelte 😍👉 In case you got hooked to try #sveltekit after @dummdidumm 's session https://youtube.com/watch?v=CiOigf4FbNg you might also be curious how Matthias (https://twitter.com/h_i_g_s_c_h) does #dataviz incl. #d3js at DER SPIEGEL: https://www.youtube.com/watch?v=JDEtUjjdVag
#svelte #sveltekit #dataviz #d3js

SceneOneRichmond · @Sceneonerichmond
0 followers · 2 posts · Server fosstodon.orgNew profile! #aboutMe: #oldMillenial / #xennial hobbyist doing #webDev (#HTML, #CSS, #JavaScript, #d3js, #react, #nextjs, #nodejs, #vanillaJS, #JSON)... #rstats #rshiny & #python use #js for interactive graphics. I'm good at #wordpress and #wikipedia but I would love to learn #linux & #github & #mongoDB ... Cloud things sound cool. Is #fullStack in my future? Can i build a server? What is SSH? What is #docker / #kubernates? I'm prolly out of my league but here to learn.
#aboutme #oldmillenial #xennial #webdev #html #css #javascript #d3js #react #nextjs #nodejs #vanillajs #json #rstats #rshiny #python #js #wordpress #wikipedia #linux #github #mongodb #fullstack #docker #kubernates
MapTheClouds · @maptheclouds
69 followers · 3 posts · Server mapstodon.spaceStar Map 🌌
Data: HYG-Database
Tools: D3.js, Three.js
Music by AleX Zavesa from Pixabay.
#d3js #ThreeJS #gsap #maps #3D #stars #animation #maptheclouds #video #kdenlive
#d3js #threejs #gsap #maps #3d #stars #animation #maptheclouds #video #kdenlive

Philip Trauner · @PhilipTrauner
3 followers · 6 posts · Server mastodon.social
finally got to play around with #d3js. learning curve felt a bit steep, but totally worth it. it hits that sweet spot of abstraction where common charts are easy to create, while still being highly customizable 👏

Nicolas Lambert 🌏 · @neocarto
757 followers · 64 posts · Server vis.socialHow to display and hide layers with @observablehq & d3js? 3 solutions with the help of Fabian Iwand & Mark McClure. https://observablehq.com/@neocartocnrs/display-and-hide-layers-with-d3js #d3js #JSspatial

MapTheClouds · @maptheclouds
33 followers · 33 posts · Server vis.social#30DayMapChallenge behind-the-scenes
#d3js #maptiler #30DayMapChallenge

Mohamed Ali · @mohdali
24 followers · 129 posts · Server mastodon.onlineRolling Shutter Simulation was something I did a few years back. I enjoy playing it from time to time and find it relaxing. #d3js #animation

65dBnoise · @65dBnoise
1064 followers · 3743 posts · Server fosstodon.orgThe graphs are created using #opensource #d3js https://d3js.org/ and data which is collected in a database from #NASA's feed: https://mars.nasa.gov/rss/api/?feed=weather&category=mars2020&feedtype=json
#opensource #d3js #nasa #marsweather #mars2020 #solarocks #space

Nicole Lillian Mark · @nicolemark
289 followers · 85 posts · Server vis.socialOn day 10 of #100daysofcode. So. Much. CSS. I’m just trying to be proficient enough to move on to #d3js. #dataviz
Krisztina Szűcs · @krisztina
123 followers · 3 posts · Server vis.social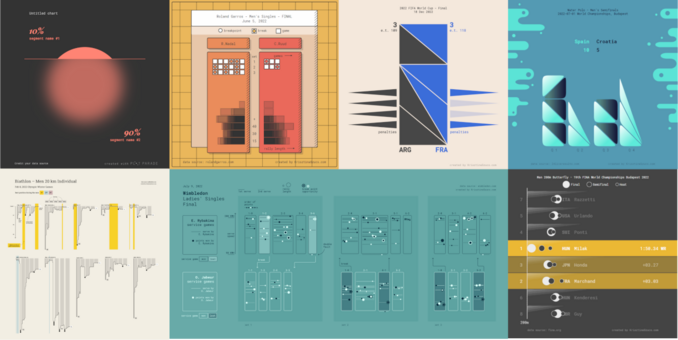
My personal projects from 2022:
https://krisztinaszucs.com/blog/20221224_recap/