Data Quine · @scottish
15 followers · 31 posts · Server datasci.social
Open-Access-Büro Berlin · @openaccess
410 followers · 177 posts · Server berlin.social
So langsam ist das Sommerloch vorbei & wir nutzen die Gelegenheit für eine erfreuliche News in eig. Sache: Gem. mit dem @bih_charite haben wir erfolgreich ein Implementierungsprojekt bei der @BerlinUAlliance eingeworben 🥳 Im Projekt #BUA #OpenScience Magnifiers werden wir ab 2023 ausbauen, was derzeit im Projekt OS #Dashboards entwickelt wird und weiter mit verschiedenen Disziplinen zusammenarbeiten 😎 #OpenResearch #Monitoring
Infos zu beiden Projekten gibt es hier: http://www.open-access-berlin.de/projekte/bua_dashboards/index.html
#bua #openscience #dashboards #openresearch #Monitoring

CryptoNewsBot · @cryptonewsbot
677 followers · 35876 posts · Server schleuss.onlineHow to use Microsoft Power BI - Learn how Power BI unlocks the potential of your data and is usef... - https://cointelegraph.com/news/how-to-use-microsoft-power-bi #businessintelligence #datavisualization #microsoftpowerbi #datareporting #dataanalysis #datainsights #datasources #dashboards
#dashboards #datasources #datainsights #dataanalysis #datareporting #microsoftpowerbi #datavisualization #businessintelligence

kath m oreilly · @kathmoreilly
30 followers · 64 posts · Server fosstodon.orgAre you are developer or user of #wastewater #dashboards for #SARSCoV2, based in #Europe? Daniela Morales (LSHTM MSc student) wants to interview you, pls sign ⬆️ https://forms.gle/3PwmQGYbfggt4qy8A we are investigating the rationale and best practices for wastewater dashboards
DM or email kathleen.oreilly@lshtm.ac.uk if you'd like more details.
#wastewater #dashboards #SarsCoV2 #europe

OpenProject · @openproject
1041 followers · 135 posts · Server fosstodon.org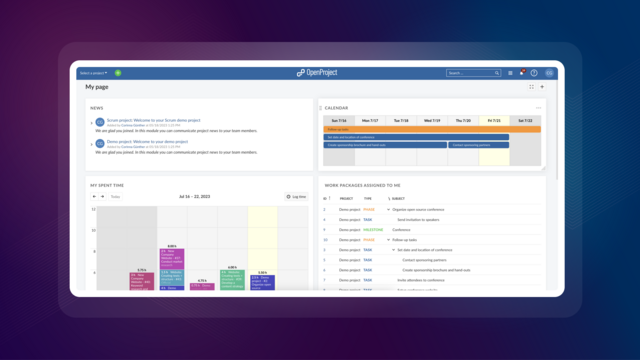
📊 Need a quick overview of your tasks and project status? #Dashboards are the answer!
Explore personalized options in #OpenProject to boost your project success: https://www.openproject.org/blog/project-dashboards
#dashboards #openproject #opensource #projectmanagement #customization

COMMU | Mobilidade na RMSP · @commu
76 followers · 120 posts · Server ursal.zone📊 A Fundação #Seade divulgou painéis interativos (também chamados de #dashboards, em inglês) com dados do #Censo2022 do #IBGE. Os dados cobrem duas dimensões: população e domicílios, além disso, estão agregados por município e também podem ser baixados como planilha eletrônica (infelizmente no formato proprietário da Microsoft) ou arquivo de texto separado por vírgulas. Para acessar: https://censo2022.seade.gov.br
#seade #dashboards #censo2022 #IBGE

Timotaysci · @timotaysci
2 followers · 15 posts · Server techhub.socialAbout a week deep into a PowerBI project. It is certainly a change in way I work. The main focus here is on dashboards for users across the organization - so they need to be sharable, visible and controllable.
I would normally have solved this with Python but with the deep integration with other MS tools that others user PowerBI was the tool that came out on top. You just cannot beat it for sharing data within organisational policies.

Dotan Horovits #CNCFAmbassador · @horovits
188 followers · 276 posts · Server fosstodon.org
Looking at your #dashboard and can't figure out what's going on? 📈😕
Check out this practical guide on how to effectively design your #devops dashboards 💡
https://horovits.medium.com/unreadable-metrics-why-you-cant-find-anything-in-your-monitoring-dashboards-12fcc23d34c8
#monitoring #observability #dashboards
#dashboard #devops #monitoring #observability #dashboards
kath m oreilly · @kathmoreilly
19 followers · 34 posts · Server fosstodon.orgMy new favourite #wbe paper: Online dashboards for SARS-CoV-2 #wastewater data need standard best practices: An environmental health communication agenda https://pubmed.ncbi.nlm.nih.gov/37254909/ great because it reviews commonalities and differences across #dashboards. Going forward, consistent measures of virus, details on how measured & log10 toggle needed

Matthias Drexel · @matthiasdrexel
285 followers · 2030 posts · Server tyrol.socialDank des #Dashboards und #Smartmeter gut ersichtlich, dass der "Grund-Strombedarf" zuhause recht überschaubar ist. Im Wesentlichen nur der Kühlschrank der in 24h rund um die 0,8kwh verbraucht.

Juan Luis · @astrojuanlu
1256 followers · 1800 posts · Server social.juanlu.space
Noticias sobre Python y Datos de la semana, episodio 75 🐍⚙️
En resumen: Versiones nuevas de CausalNex, Pillow, Ray, y Prefect, dashboards sin backend con stlite y voici, cruzando el antimeridiano sin dramas, y malos tiempos para Binder.
https://buttondown.email/astrojuanlu/archive/episodio-75/
Apoya el noticiero suscribiéndote por correo 📬
#causalnex #pillow #ray #prefect #streamlit #dashboards #gis #binder #euroscipy #python #pydata #noticieropythonydatos
#causalnex #pillow #ray #prefect #streamlit #dashboards #gis #binder #euroscipy #python #PyData #noticieropythonydatos

Emory L. · @emory
164 followers · 1414 posts · Server soc.kvet.ch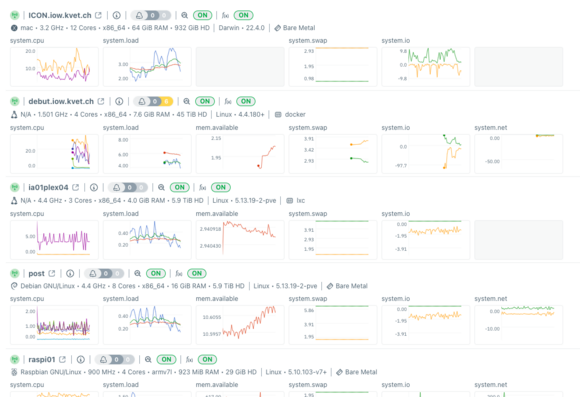
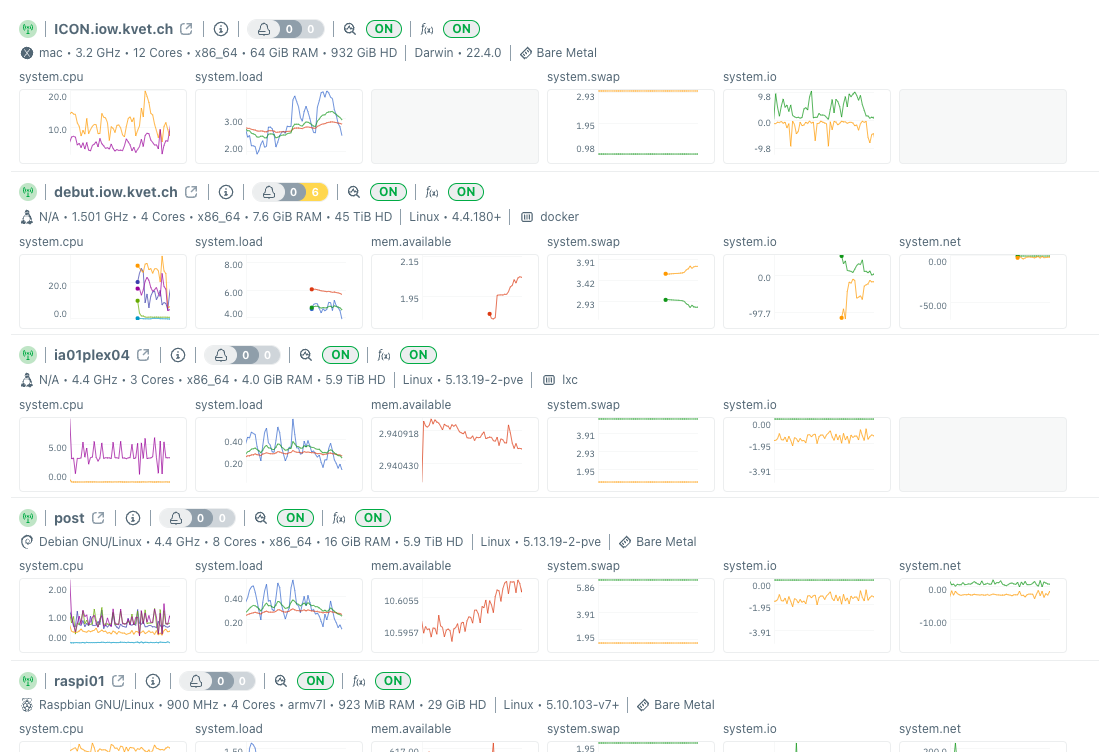
my monitoring project continues and i've deployed #netdata on a synology filer via #docker. i don't know if that will be sufficient to gather the sorts of metrics i am interested in yet but it's in my dashboard.
i see a lot of "data backlog of 10 minutes" alerts that i don't know how to interpret because i have a redundant read/write ssd cache and i find it hard to believe anything is waiting 10+ minutes for anything but i haven't dug in yet.
#netdata #docker #householdIT #dashboards

Anita Graser 🇪🇺🇺🇦 · @underdarkGIS
2129 followers · 1007 posts · Server fosstodon.orgTo be specific: they discuss how to build fit for purpose #dashboards and how they differ from #visualanalytics applications
Anita Graser 🇪🇺🇺🇦 · @underdarkGIS
2129 followers · 1003 posts · Server fosstodon.orgNew #MobilityDataScience #VisualAnalytics reading:
A conceptual framework for developing #dashboards for big #mobility data
By Lindsey Conrow, Cheng Fu, Haosheng Huang, Natalia Andrienko, Gennady Andrienko & Robert Weibel
In #Cartography and #GeographicInformationScience
#mobilitydatascience #visualanalytics #dashboards #mobility #cartography #geographicinformationscience #gischat

Derek Law · @GIS_Bandit
226 followers · 286 posts · Server mastodon.world
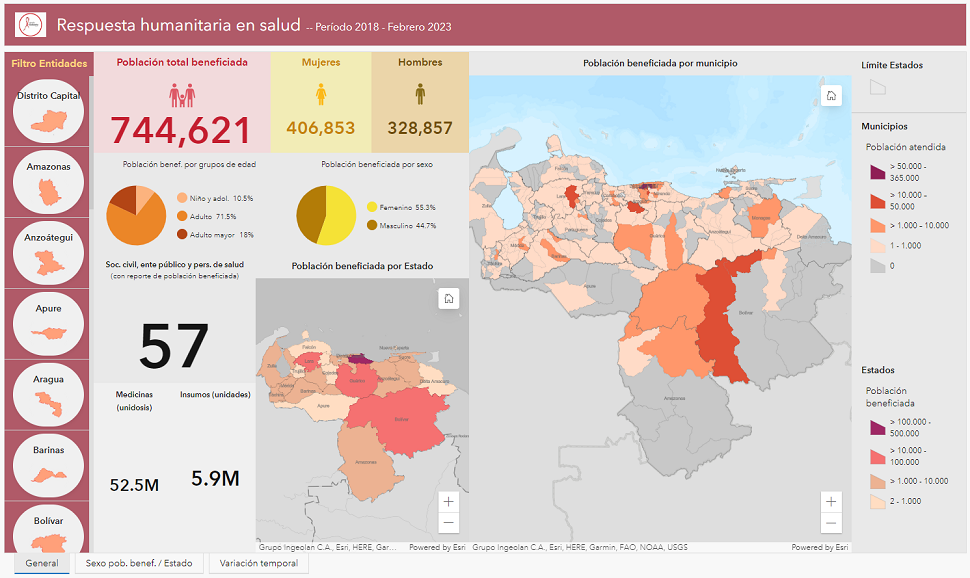
Nice #humanitarian #health response in #Venezuela dashboard built on #ArcGISDashboards https://tinyurl.com/2jz9mdvc by Virginia Behm
#healthGIS #WorldHealthDay #govtech #GIS #esri #arcgis #dashboards #dataviz #GISchat #geospatial #mapstodon
#humanitarian #health #venezuela #arcgisdashboards #HealthGIS #WorldHealthDay #govtech #GIS #esri #arcgis #dashboards #dataviz #gischat #geospatial #mapstodon

0xDC · @0xDC
25 followers · 38 posts · Server hachyderm.io
🎉 My Kubernetes dashboards project just reached 1k stars ⭐ on GitHub! :github:
#kubernetes #grafana #dashboards #github

Josep Ferrer · @rfeers
27 followers · 47 posts · Server me.dm6/ 🎨 Google Looker Studio
Looker is a powerful #data #visualization & #analytics tool with features like customized #SQL queries, drag-and-drop interface, data exploration and collaboration.
This powerful combination empowers you to create dynamic #dashboards and #reports.
#data #visualization #analytics #sql #dashboards #reports

kodegeek · @josevnz
26 followers · 127 posts · Server fosstodon.orgStreamlit you can help you write good looking web applications, with very little code in Python.
On this article:
* NYRR race results with the help of Pandas DataFrames.
* "flavor wheel", that will allow you to explain to others, objectively, how your cup of Coffee tastes while making you look like a genius ;-)
Hope you enjoy it reading this as much I did writing it.
#streamlit #podman #python #opensource #datascience #dashboards #pandas #coffee
#streamlit #podman #python #opensource #datascience #dashboards #pandas #coffee

Dennis Alexis Valin Dittrich · @davdittrich
528 followers · 504 posts · Server fediscience.orgAre #Dashboards More Trustworthy? https://policyviz.com/2023/03/10/are-dashboards-more-trustworthy/
#dataviz

Bot: Market & social research · @LoveStats
48 followers · 504 posts · Server mastodon.socialBring your data to life! E2E's inspiring, interactive dashboards are a beautiful way to turn complex relationships into insightful actions! #Raven #Dashboards #MRX #Insights http://dlvr.it/SkBbVM
#mrx #insights #raven #dashboards