
CorrelAid · @correlaid
100 followers · 94 posts · Server masto.ai
📈🕰️ #Zeitreisen in #Daten! 🚀✨ Eine #Zeitreihe ist eine Abfolge von Messwerten, die uns Muster, #Trends und Einblicke in Vergangenheit und Zukunft gibt. ⏳🔍
#zeitreisen #daten #zeitreihe #trends #data4good #datascience #statistik #data4goodmonday
CorrelAid · @correlaid
100 followers · 94 posts · Server masto.ai
#Data4GoodMonday: Was ist ein Hypothesentest?
#data4goodmonday #data4good #datascience #statistik
CorrelAid · @correlaid
92 followers · 88 posts · Server masto.ai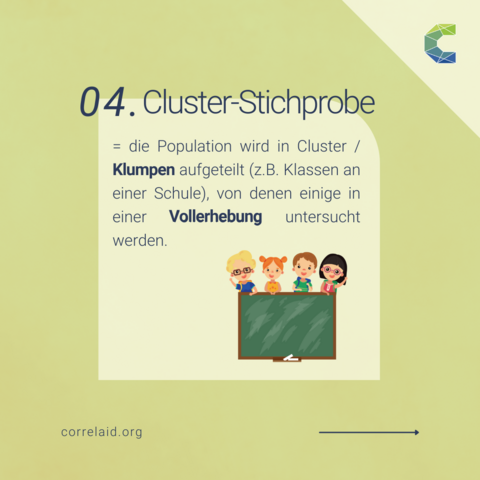
🔎🎯 Willst du lernen, wie man eine repräsentative Stichprobe zieht? Erfahre hier alles über die Stichprobenziehung und ihre Bedeutung in der Datenanalyse! 💡📋
#data4goodmonday #data4good #dataforgood #correlaid #data #datascience #statistics #ehrenamt #volunteering #sample
#data4goodmonday #data4good #dataforgood #correlaid #data #datascience #statistics #ehrenamt #volunteering #sample
CorrelAid · @correlaid
92 followers · 87 posts · Server masto.ai
📋🧹 Ordnung ist das A und O in der Datenanalyse! Erfahre hier, wie du deine Daten in einem "tidy" Datensatz organisierst. 💡💻
#data4goodmonday #data4good #dataforgood #correlaid #data #datascience #statistics #ehrenamt #volunteering #tidydata #tidy
#data4goodmonday #data4good #dataforgood #correlaid #data #datascience #statistics #ehrenamt #volunteering #tidydata #tidy
CorrelAid · @correlaid
90 followers · 85 posts · Server masto.ai
ℹ️ Die Likert-Skala ist ein mächtiges Werkzeug in den Sozialwissenschaften und der Umfragegestaltung! 📋💡
#data4goodmonday #data4good #dataforgood #correlaid #data #datascience #statistics #ehrenamt #volunteering #likertscale #likertskala
#data4goodmonday #data4good #dataforgood #correlaid #data #datascience #statistics #ehrenamt #volunteering #likertscale #likertskala
CorrelAid · @correlaid
87 followers · 84 posts · Server masto.ai
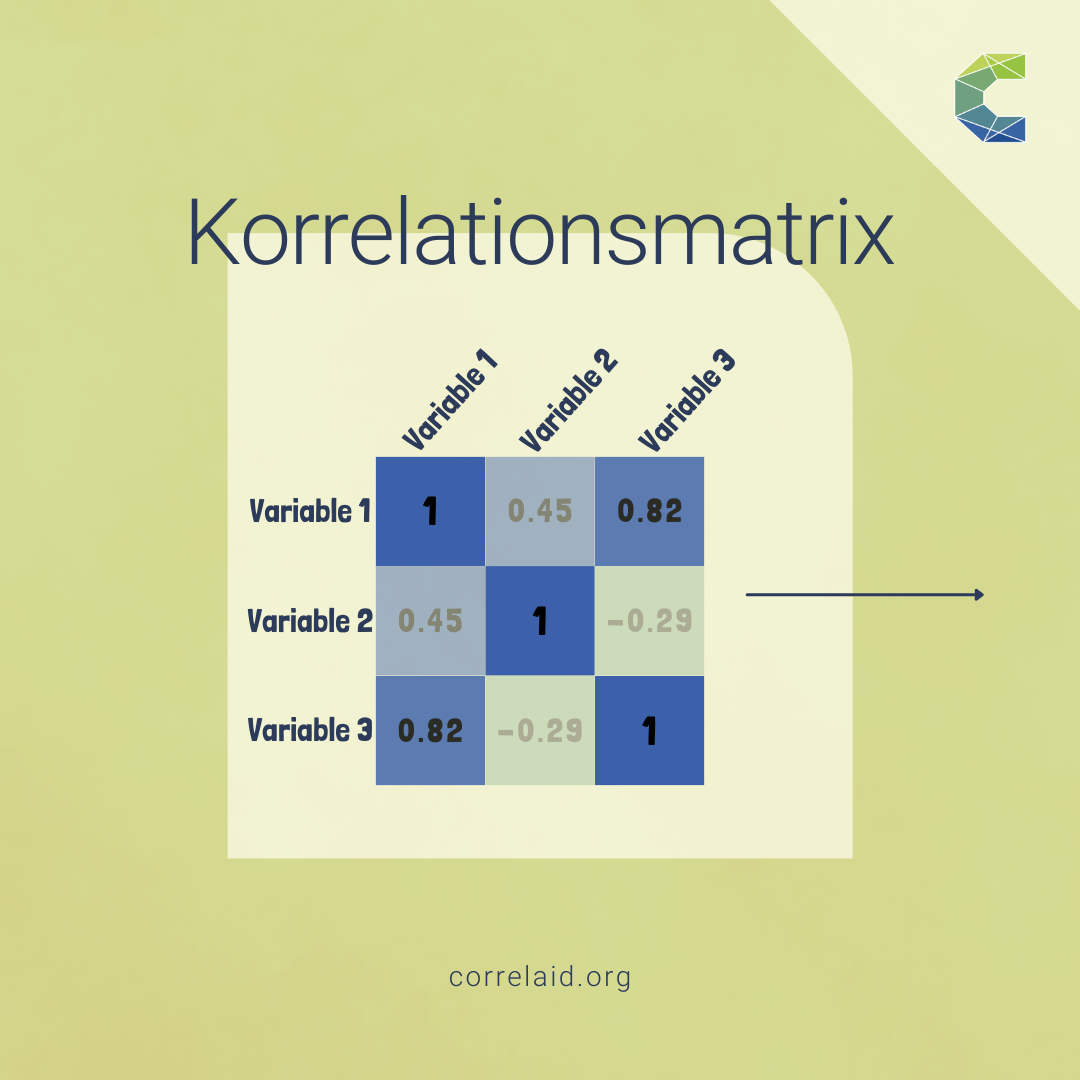
ℹ️ Die Sprache der Daten: Die Korrelationsmatrix übersetzt komplexe Informationen in ein klares und verständliches Muster von Korrelationen.
#data4goodmonday #data4good #dataforgood #correlaid #data #datascience #statistics #ehrenamt #volunteering #correlation #variable
#data4goodmonday #data4good #dataforgood #correlaid #data #datascience #statistics #ehrenamt #volunteering #correlation #variable
CorrelAid · @correlaid
86 followers · 83 posts · Server masto.ai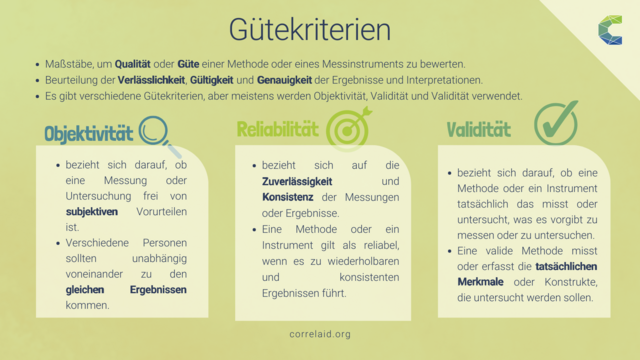
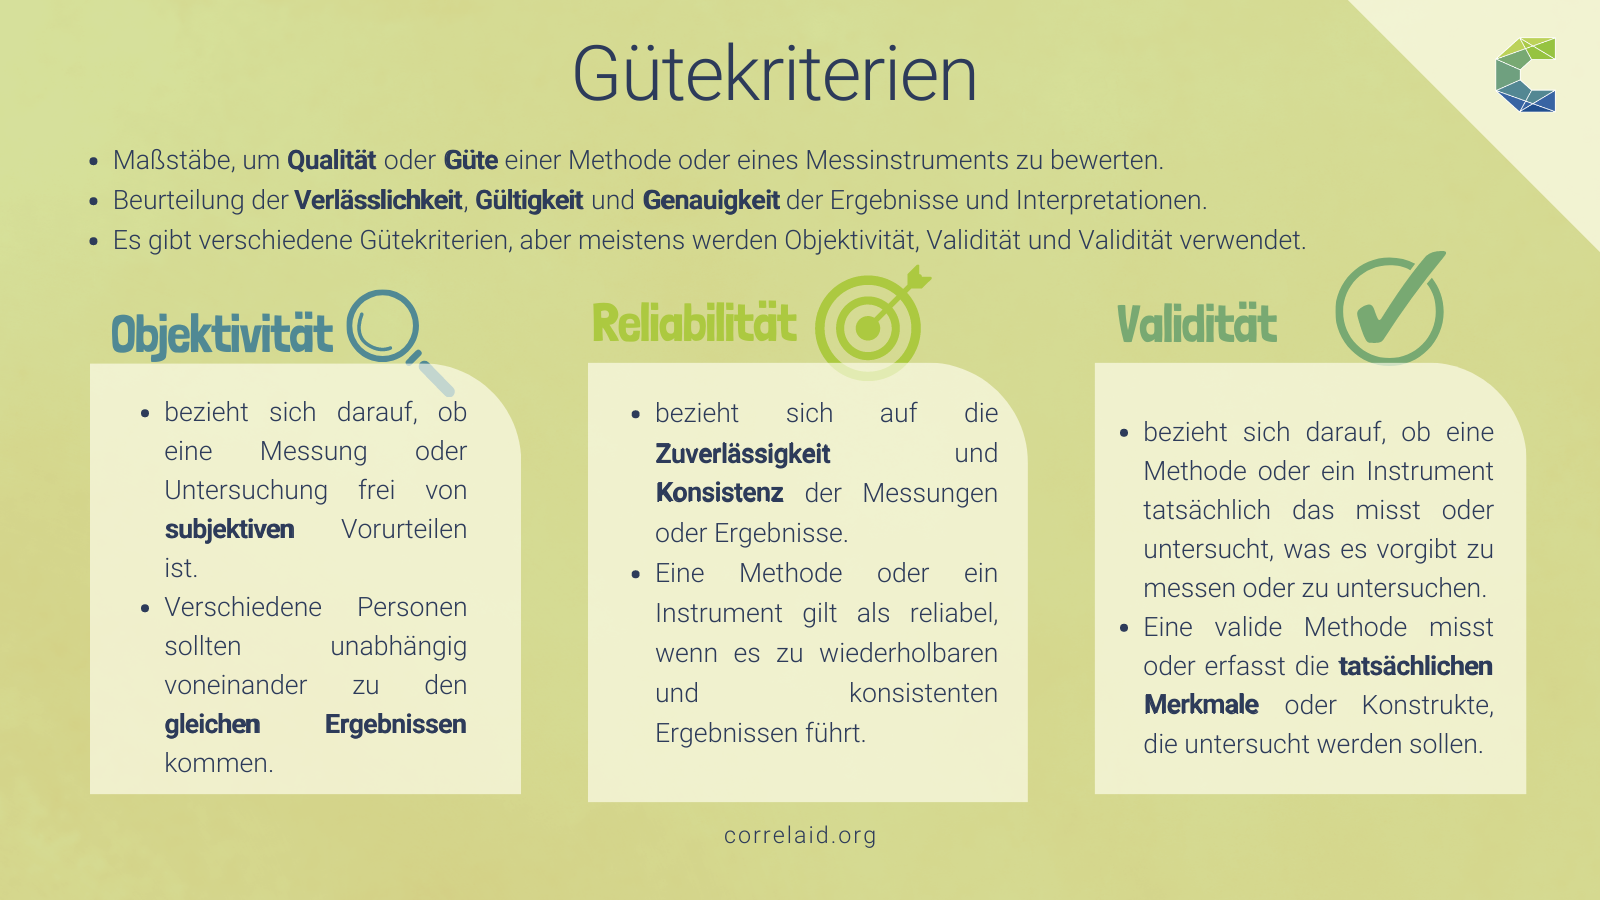
#Gütekriterien sind wie das Fundament eines Gebäudes - sie geben unserer Forschung eine solide Basis! 💪🔬✨
🔷 Reliabilität gewährleistet konstante und verlässliche Ergebnisse.
🔷 Objektivität schützt vor persönlichen Vorurteilen.
🔷 Validität stellt sicher, dass wir das Richtige messen.
Zusammen mit der Reproduzierbarkeit bilden sie die Grundlage für vertrauenswürdige Erkenntnisse! 🌟💡
#quality #data4good #dataforgood #data4goodmonday #data #datascience #statistics #Statistik #correlaid #ehrenamt
#gutekriterien #quality #data4good #dataforgood #data4goodmonday #data #datascience #statistics #statistik #correlaid #ehrenamt
CorrelAid · @correlaid
80 followers · 77 posts · Server masto.ai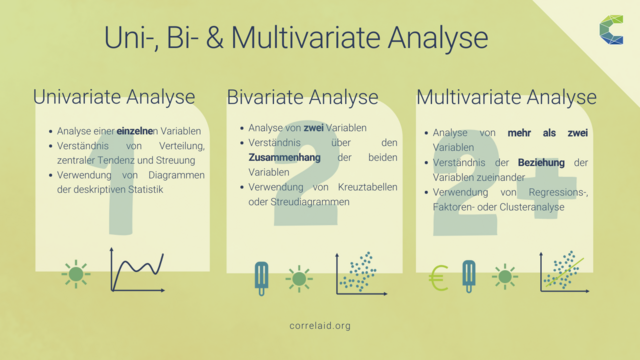
In der #Statistik gibt es 3 Arten von Analysen: univariat, bivariat & multivariat 📈
Welche Art der Analyse die passende ist, hängt von der Variablenanzahl ab💡
#data4good #dataforgood #data4goodmonday #data #datascience #statistics #correlaid #uni #bi #multi #analysis #ehrenamt
#statistik #data4good #dataforgood #data4goodmonday #data #datascience #statistics #correlaid #uni #bi #multi #analysis #ehrenamt
CorrelAid · @correlaid
75 followers · 69 posts · Server masto.ai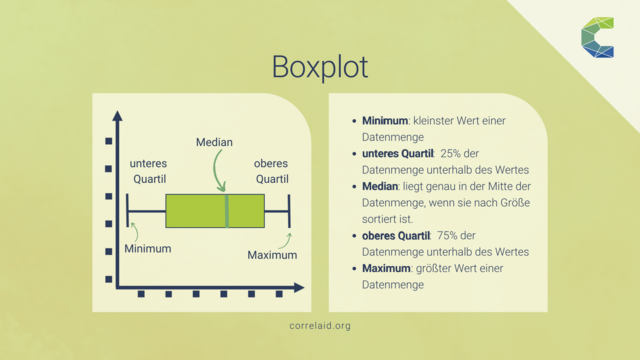
#Boxplots sind eine großartige Möglichkeit, um die Verteilung von #Daten auf einen Blick zu verstehen. Mit nur einer Box und ein paar Linien können wir schnell sehen, wo sich die meisten Daten befinden und wie weit sie auseinander liegen. 📊👀
#Data4GoodMonday #Data4Good #DataScience #DataForGood #Data #Statistik #Statistics #statistikbasics
#boxplots #daten #data4goodmonday #data4good #datascience #dataforgood #data #statistik #statistics #statistikbasics
CorrelAid · @correlaid
74 followers · 64 posts · Server masto.ai#Data4GoodMonday ℹ️ Häufigkeitstabellen dienen zur Zusammenfassung und Darstellung von #Daten 📊 Eine Häufigkeitstabelle gibt an, wie oft bestimmte Werte oder Kategorien in einem Datensatz vorkommen. Dabei kann zwischen absoluter (Wie oft kommt ein bestimmter Wert oder eine bestimmte Kategorie in einem Datensatz vor?) und relativer Häufigkeit (Wie oft kommt ein bestimmter Wert in Prozenten/ Verhältnissen zum Gesamtdatensatz vor?) unterschieden werden.
CorrelAid · @correlaid
68 followers · 56 posts · Server masto.ai
#Data4GoodMonday 👏🏽
Du wolltest schon immer wissen, was #Varianz und #Standardabweichung sind?
Fragen zu Statistik? Dann schreibt uns gerne in den Thread! 👏🧵
#data4good #datascience #dataforgood #statistik #statistikbasics
#data4goodmonday #varianz #standardabweichung #data4good #datascience #dataforgood #statistik #statistikbasics
CorrelAid · @correlaid
64 followers · 53 posts · Server masto.ai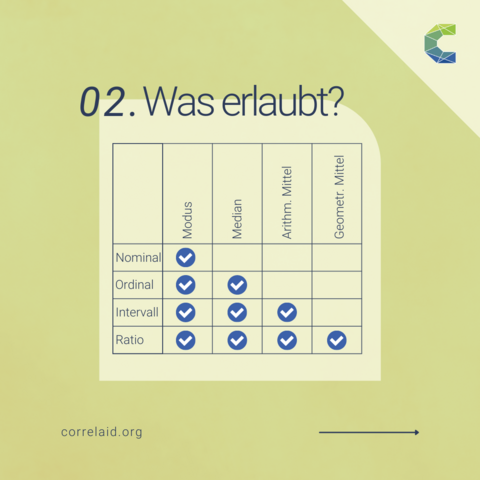
#Data4GoodMonday ℹ️💡
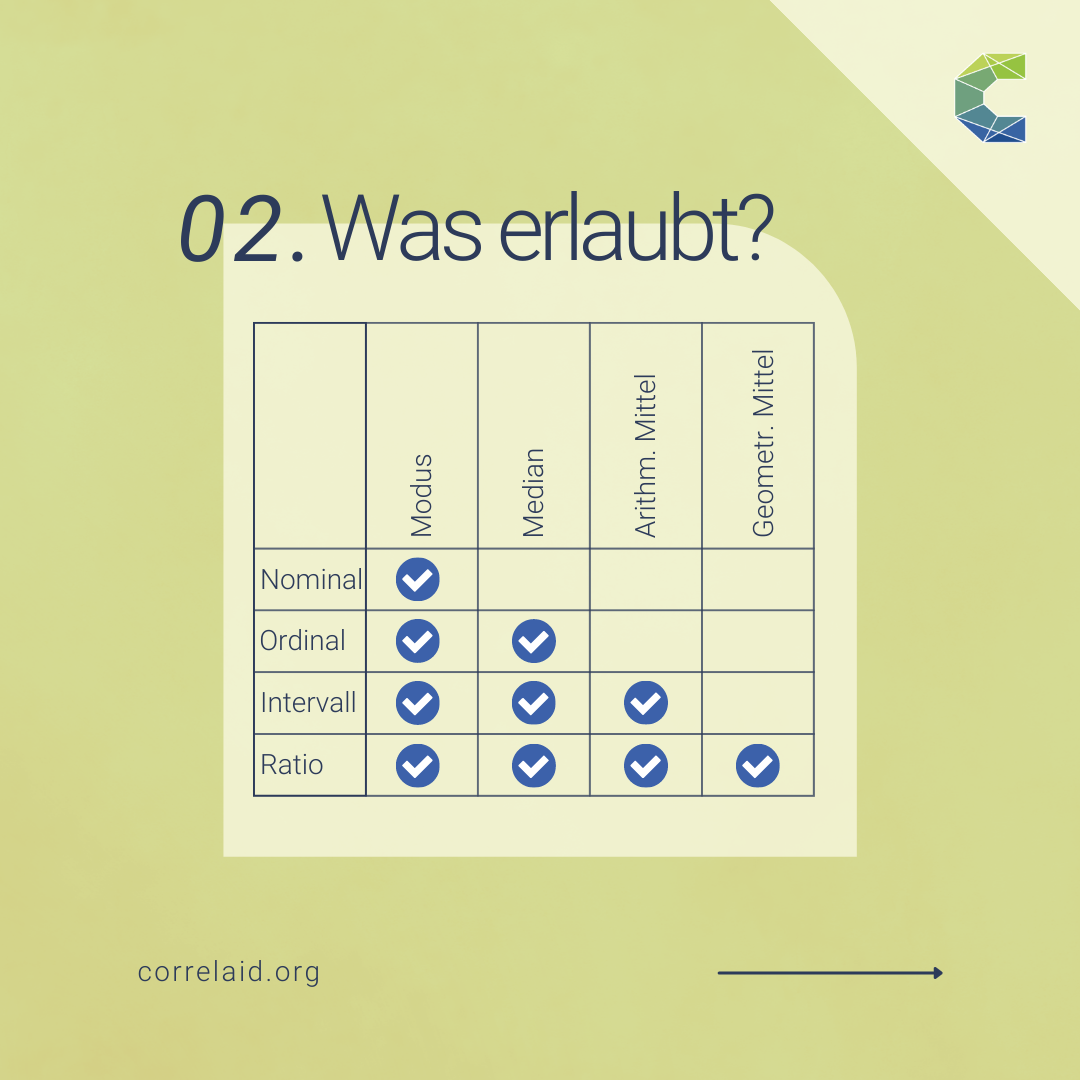
Skalenniveaus helfen, #Daten zu verstehen und zu analysieren 📊🤔 Dabei hat die Wahl der #Skala einen großen Einfluss auf Art und Weise der #Interpretation 🔍📈
#data4good #datascience #dataforgood #statistik #statistikbasics #dataliteracy
#data4goodmonday #daten #skala #interpretation #data4good #datascience #dataforgood #statistik #statistikbasics #dataliteracy
CorrelAid · @correlaid
63 followers · 51 posts · Server masto.ai#Data4GoodMonday ℹ️💡
What do baking, thermometers and shoes have to do with statistics? 🔎🍰 Exactly, we use scales! More about this in the 🧵
Questions about #statistics? Then feel free to post them in the thread! 👏
#data4goodmonday #statistics #data4good #datascience
CorrelAid · @correlaid
63 followers · 51 posts · Server masto.ai#Data4GoodMonday
Today: what's the difference between mode, median and mean? 👉🧵
Questions about #statistics? Then feel free to post them in the thread! 👏
#data4goodmonday #statistics #data4good #datascience
CorrelAid · @correlaid
61 followers · 48 posts · Server masto.ai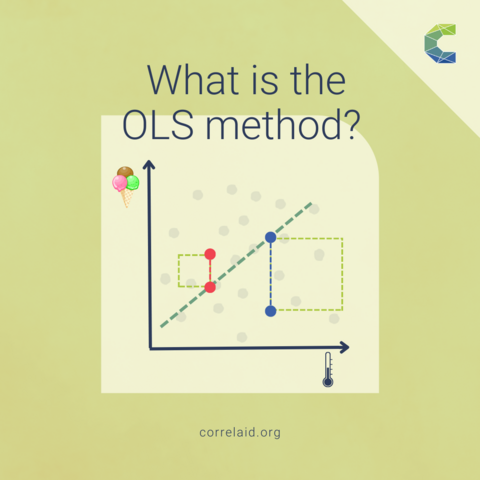
#Data4GoodMonday
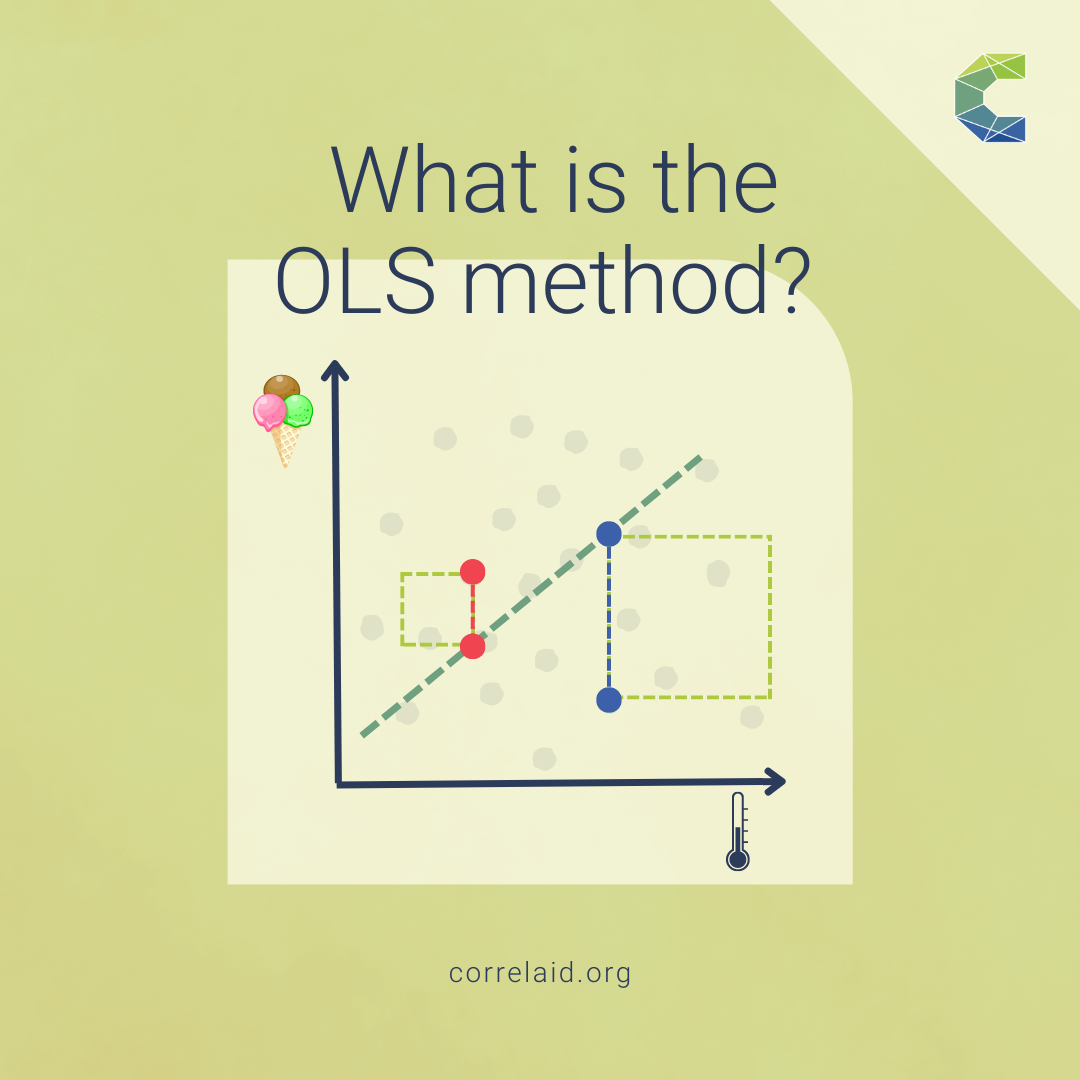
As promised last week, today: What is the #OLS method? 👉🧵
Questions about #statistics? Then feel free to post them in the thread! 👏
1️⃣ #Residual
For each x-value there is a point on the regression line - the predicted value ŷ. The distance between this and the actual value y is called the residual.
2️⃣ #OLS
The "best fitting line" is found by minimizing exactly this distance. OLS minimizes the sum of squared residuals.
#data4goodmonday #ols #statistics #data4good #datascience #residual
CorrelAid · @correlaid
61 followers · 46 posts · Server masto.ai#Data4GoodMonday
Last week was all about #regressions in general, today is all about the #regression line! 👉🧵
Questions about #statistics? Then feel free to post them in the thread! 👏
1️⃣ The regression line shows the relationship between independent (IV) & dependent #variable (DV):
- How much does the DV change when the IV increases one unit?
- What is the estimated value of DV for a given value of the IV?
👉 But where does the straight line come from?
#data4goodmonday #regressions #regression #statistics #data4good #datascience #variable
CorrelAid · @correlaid
60 followers · 44 posts · Server masto.ai#Data4GoodMonday
This week: What is a #regression? 🤔⬇️
1️⃣ #Regression
statistical method to describe the #relationship between at least 2 variables. It only establishes #correlation, not #causality. A regression yields an #estimate, not an exact #prediction.
2️⃣ #Example
the higher the temperature, the more #icecream is sold. So there is a positive and linear relationship between the two #variables. The difference between a point and the line is called the #residual.
#data4goodmonday #regression #relationship #correlation #causality #estimate #prediction #example #icecream #variables #residual #data4good #datascience
CorrelAid · @correlaid
60 followers · 43 posts · Server masto.ai#Data4GoodMonday
This week: What are #mediator and #moderator? 🧐
1️⃣ #Mediators
are variables that mediate the relationship between two other variables. The independent variable has an effect on the mediator, and the mediator in turn has an effect on the dependent variable.
2️⃣ #Moderators
are variables that affect the relationship between two other variables. They can change the direction and strength of the effect of the independent variable on the dependent variable.
#data4goodmonday #mediator #moderator #mediators #moderators #data4good #datascience
CorrelAid · @correlaid
59 followers · 40 posts · Server masto.ai#Data4GoodMonday
This week: What is a #hypothesis?
Read in 🧵!
#data4good #datascience #dataforgood #data4goodmonday #hypothesis #statisticsbasics #statistics
#data4goodmonday #hypothesis #data4good #datascience #dataforgood #statisticsbasics #statistics
CorrelAid · @correlaid
55 followers · 39 posts · Server masto.ai#Data4GoodMonday
This week: What are variables?
Read in 🧵!
#data4good #datascience #dataforgood #data4goodmonday #variables
#data4goodmonday #data4good #datascience #dataforgood #variables