
Tim Ling · @tim_ling
39 followers · 18 posts · Server mastodon.onlinejburnmurdoch@econtwitter.net does consistently excellent work #dataVisualistion and tells a compelling and sobering story about how the #UK has arrived where it has...
https://twitter.com/jburnmurdoch/status/1606223992221745153?s=20&t=T-Fwgz67HSchuWo80W3A4w
Kelly · @Kelly
44 followers · 82 posts · Server vis.social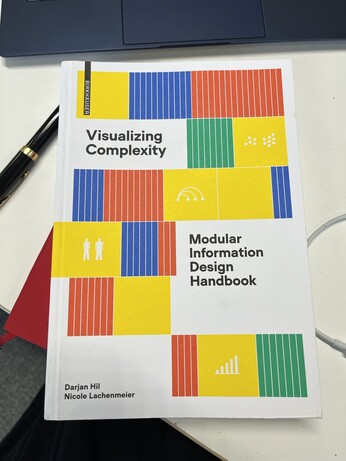
Over the past 12 months I’ve bought a few new #datavis reference books. This one by Darjan Hill and Nicole Lachenmeier is a really interesting approach to outlining the process of visualisation. It reminds me a lot of Bertin (or at least in how I remember Bertin - it’s been a while!) I haven’t had a lot of time to really dig in. Keen to hear your thoughts if you’ve read it. #dataVisualistion #dataVisBookChat
#dataVisBookChat #dataVisualistion #datavis

Nicola Rennie · @nrennie
640 followers · 73 posts · Server fosstodon.org
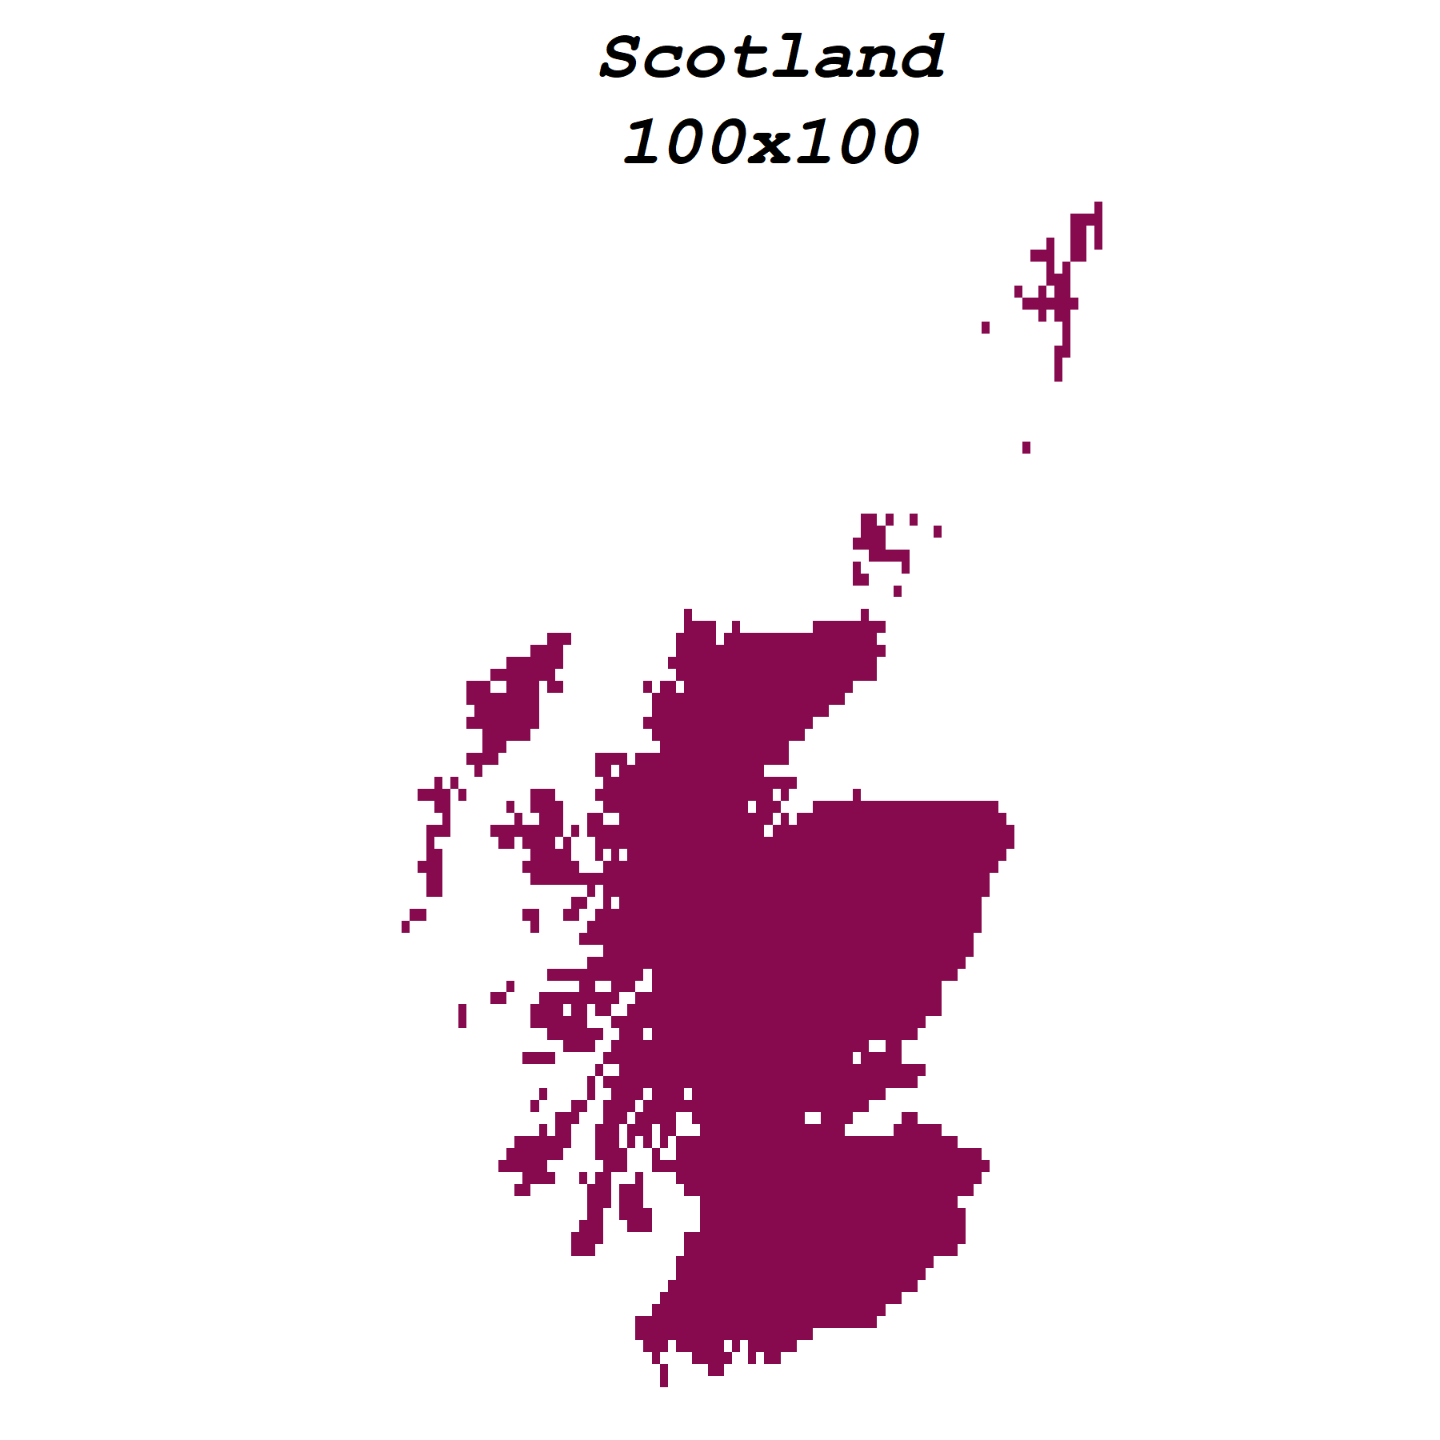
The "raster" prompt on #Day7 of the #30DayMapChallenge gave me a chance to look at maps under different grid resolutions using the {stars} #rstats package! 🏴🏴🏴
Code: https://github.com/nrennie/30DayMapChallenge/blob/main/2022/scripts/07_raster.R
#day7 #30DayMapChallenge #rstats #15MinuteMaps #dataviz #dataVisualistion #gis

Jane Adams · @janeadams
1133 followers · 236 posts · Server vis.socialSome features I'm already planning on: export any event to .ics (calendar format); sticky menu for filtering by venue or type
I was also curious about tiers/ranking -- in our lab, we have an unofficial "tier" system for considering what counts as a paper that fulfills the candidacy / doctoral requirements of the program (loosely correlated with impact factor). But are these tiers universal? Controversial?
#phd #hci #dataVisualistion #noxp #academia #impactfactor
Nicola Rennie · @nrennie
640 followers · 73 posts · Server fosstodon.org
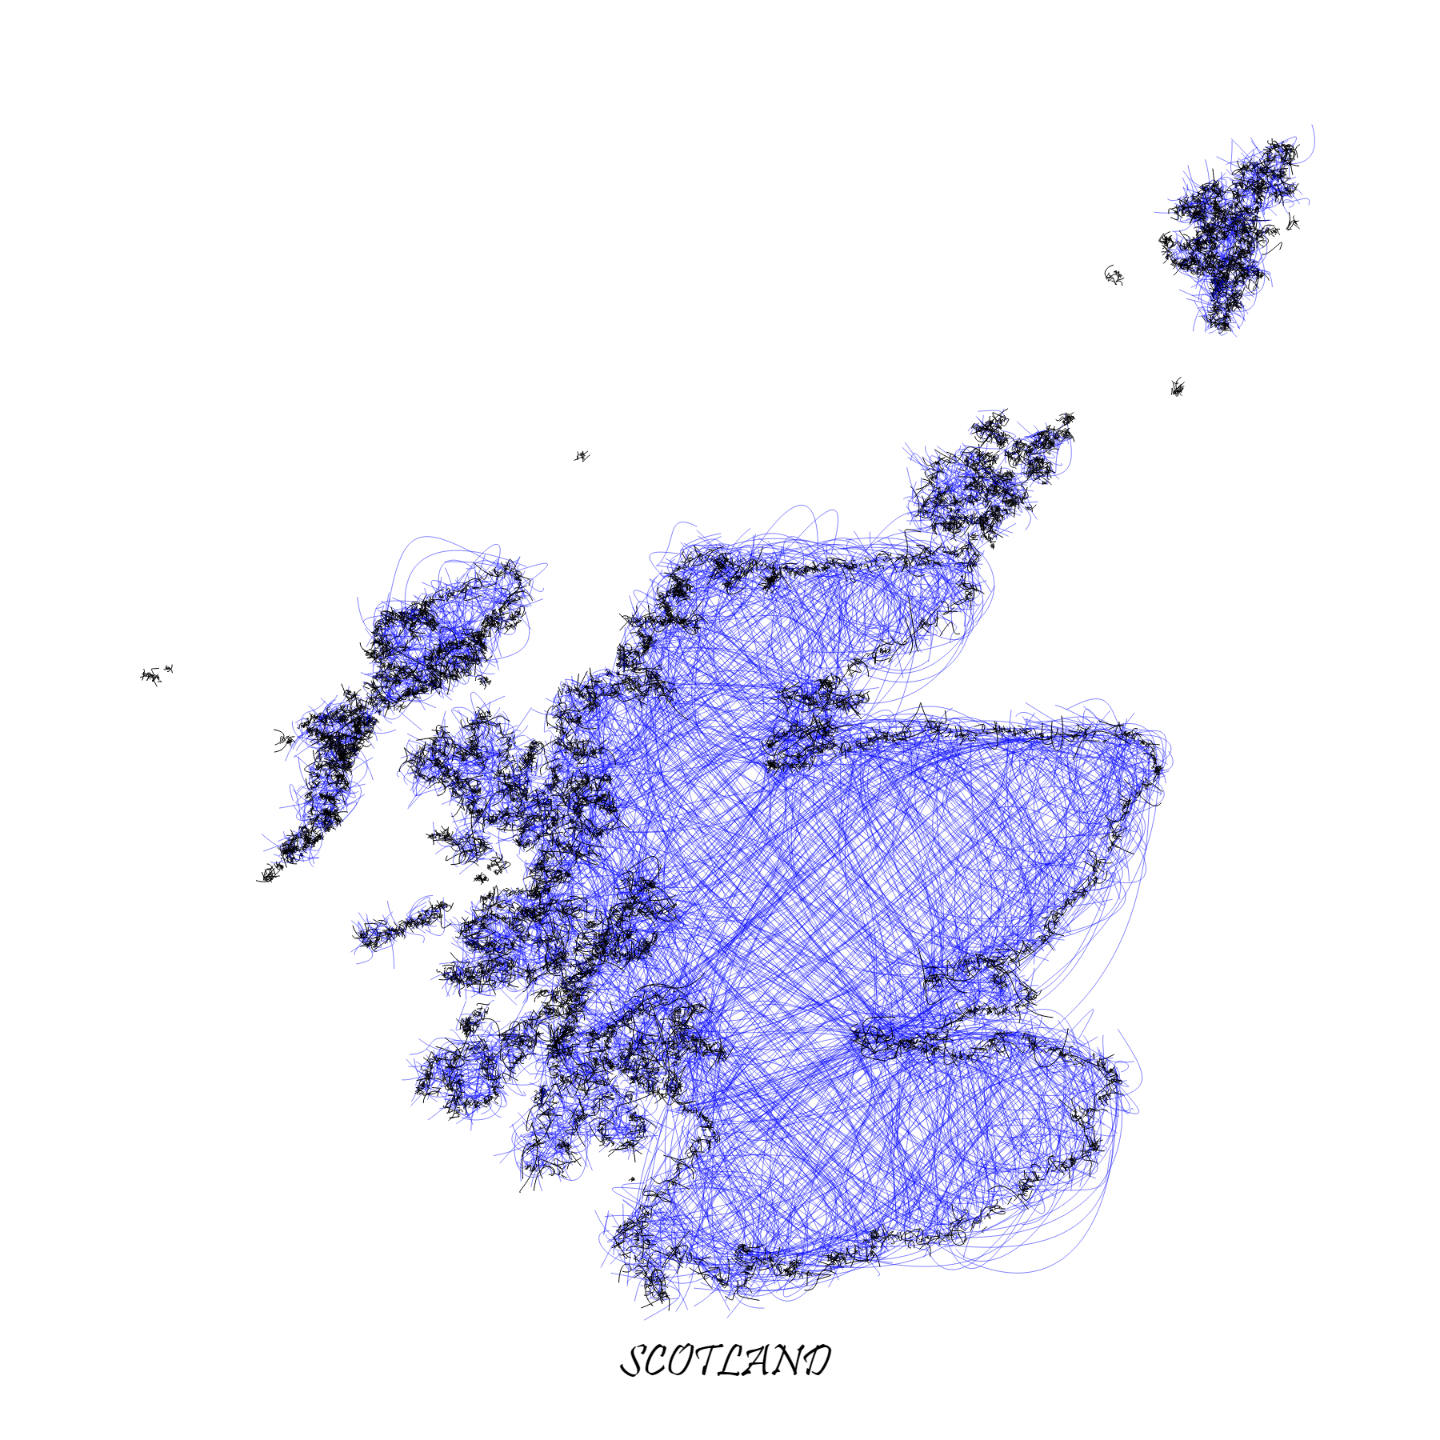
For the "lines" prompt on #Day2 of the #30DayMapChallenge, I used the {roughsf} #rstats package from
David Schoch to draw some lines to colour in a map of Scotland!
Code: https://github.com/nrennie/30DayMapChallenge/blob/main/2022/scripts/02_lines.R
#day2 #30DayMapChallenge #rstats #15MinuteMaps #dataviz #dataVisualistion
Nicola Rennie · @nrennie
640 followers · 73 posts · Server fosstodon.orgThe "making of" in #ggplot2 recorded with {camcorder}!
YouTube: https://youtube.com/shorts/Z0b7cZJWSDM
#RStats #DataViz #r4ds #GBBO #DataVisualistion #TidyTuesday #DataScience #DataVizualisation
#ggplot2 #rstats #dataviz #r4ds #gbbo #dataVisualistion #tidytuesday #datascience #datavizualisation
Nicola Rennie · @nrennie
640 followers · 73 posts · Server fosstodon.org
Inspired by Cara Thompson
to make some cakes for this week's #TidyTuesday using Great British Bake Off data! 🍰 🍰 🍰 The {bakeoff} R package is awesome!
Code: https://github.com/nrennie/tidytuesday/tree/main/2022/2022-10-25
#RStats #DataViz #r4ds #GBBO #DataVisualistion #ggplot2 #DataScience #DataVizualisation
#tidytuesday #rstats #dataviz #r4ds #gbbo #dataVisualistion #ggplot2 #datascience #datavizualisation

Wirry Loberts · @stragu
941 followers · 8608 posts · Server mastodon.indie.hostA filterable gallery of more than 100 #ggplot2 extensions. So much fun can be had with this #dataVisualistion ecosystem.
#rstats #dataVisualistion #ggplot2