LabPlot · @LabPlot
394 followers · 44 posts · Server floss.social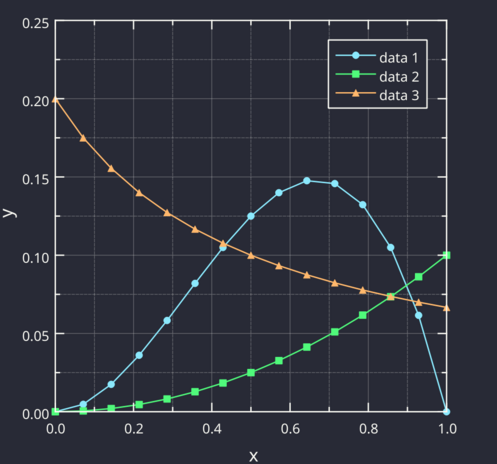
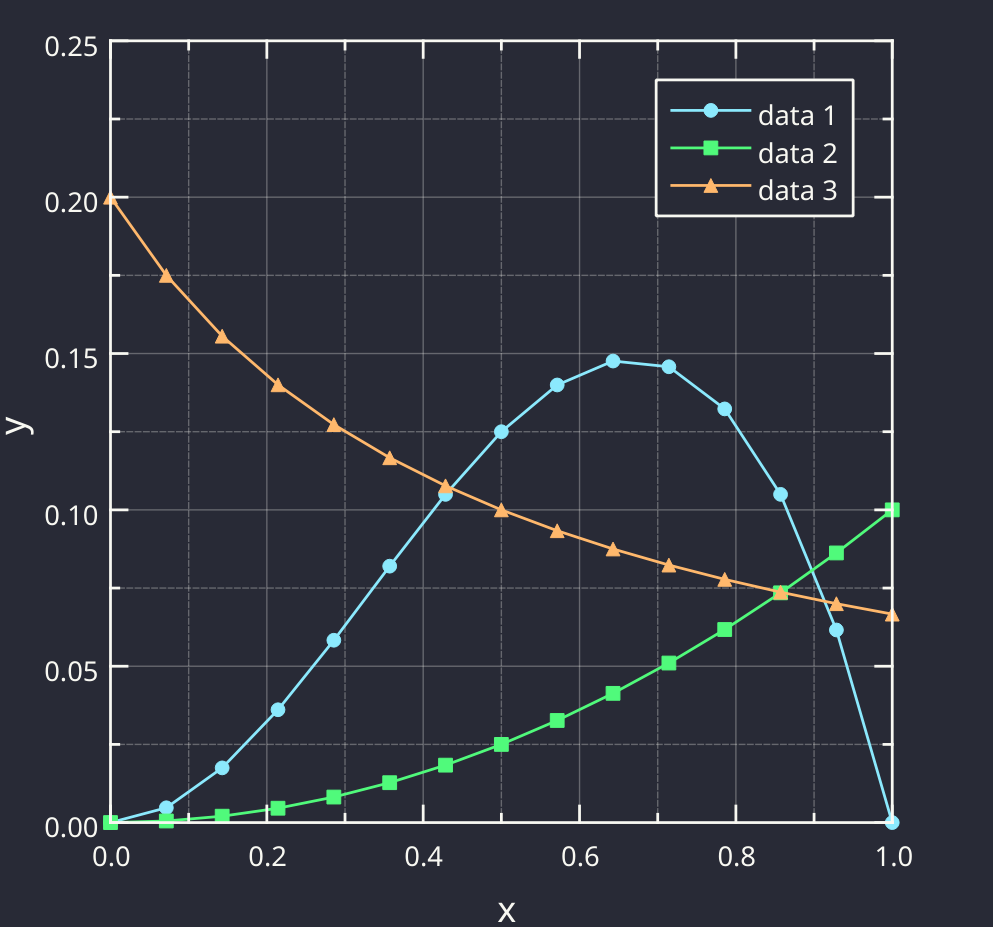
The #Dracula 🧛♂️ theme for plots is ready for testing in the development versions of #LabPlot.
See more here:
➡️ https://draculatheme.com/labplot
➡️ https://github.com/dracula/labplot
Download here:
➡️ https://labplot.kde.org/download
#DataViz #Visualization #Plotting #Color #LabPlot #FreeSoftware #FOSS #OpenSource #FLOSS #Plot
#dracula #labplot #dataViz #visualization #plotting #color #FreeSoftware #FOSS #OpenSource #FLOSS #plot
LabPlot · @LabPlot
394 followers · 44 posts · Server floss.social
You can easily install LabPlot on Windows, macOS, Linux and FreeBSD 🚀
Download here:
➡️ labplot.kde.org/download
#FOSS #FLOSS #OpenSource #FreeSoftware #DataAnalysis #DataViz #Statistics #Ubuntu #Fedora #OpenSUSE #Arch #Gentoo #Slackware #Debian #Flatpak #AppImage #Chocolatey #LabPlot #Windows #macOS #Linux #FreeBSD
#labplot #Windows #macOS #Linux #FreeBSD #FOSS #FLOSS #OpenSource #FreeSoftware #dataanalysis #dataViz #statistics #Ubuntu #Fedora #OpenSUSE #Arch #gentoo #Slackware #Debian #Flatpak #appimage #chocolatey
LabPlot · @LabPlot
394 followers · 44 posts · Server floss.social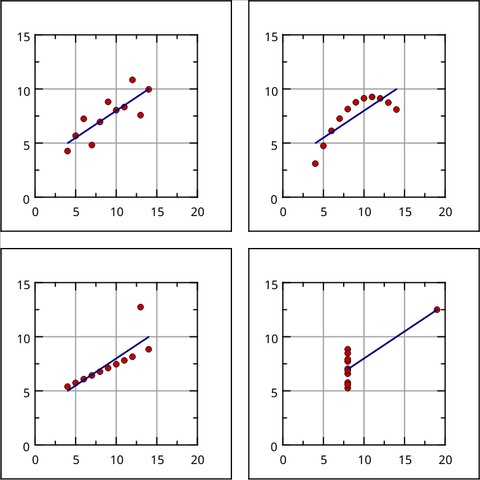
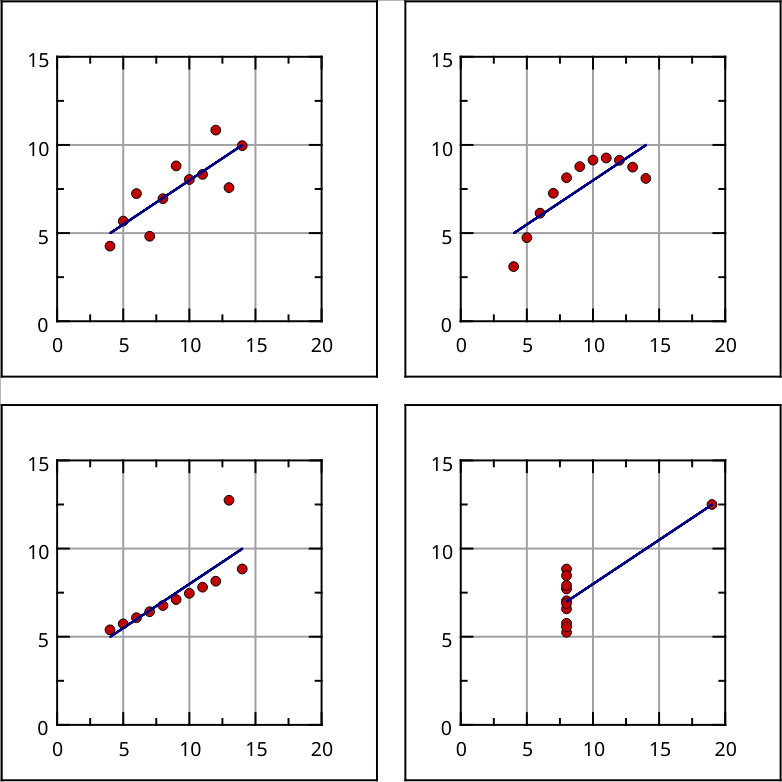
If you are interested, please see also this thread on the importance of visualizing data (the Anscombe's quartet, Simpson's paradox are also included in @LabPlot):
https://mstdn.social/@onemoment/109692198312380103
#Anscombe #SimpsonsParadox #DatasaurusDozen #Visualization #DataViz
#anscombe #simpsonsparadox #datasaurusdozen #visualization #dataViz
LabPlot · @LabPlot
394 followers · 44 posts · Server floss.social
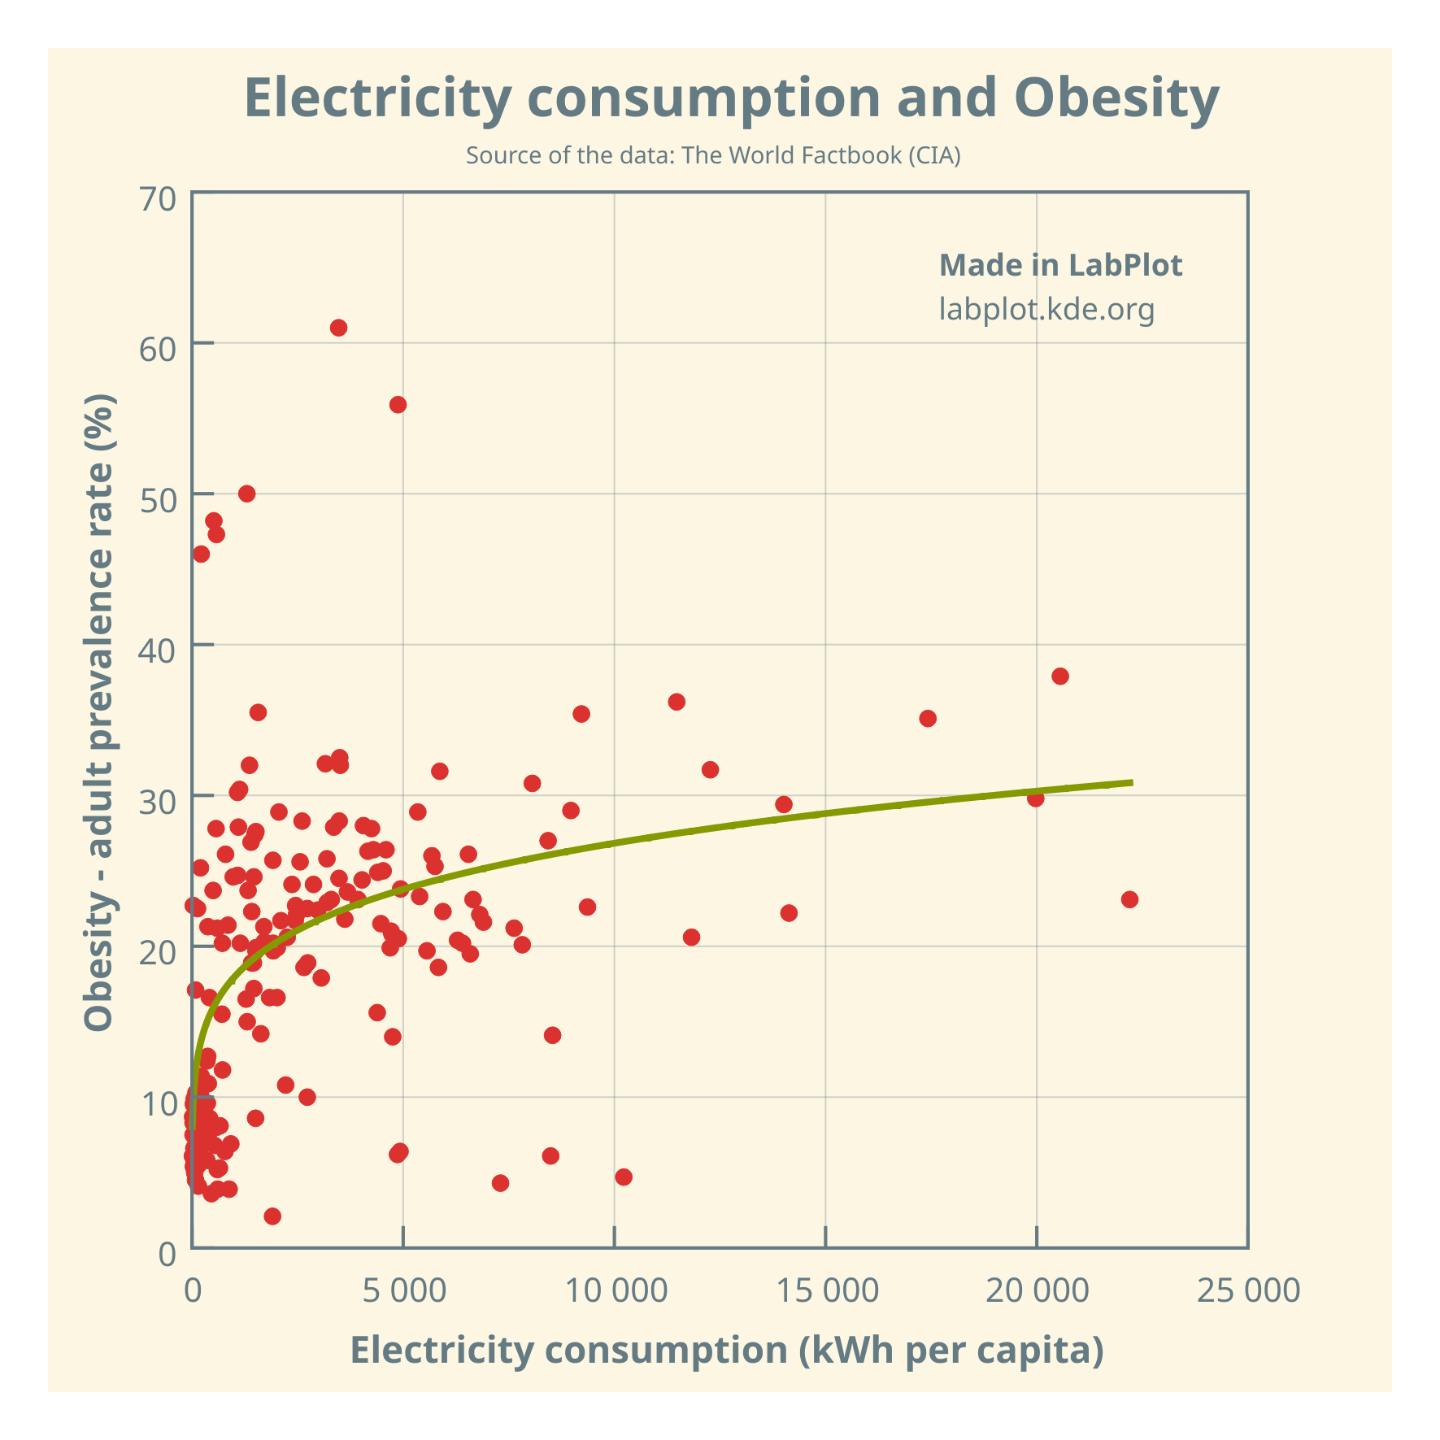
Is there a causal relationship between electricity consumption and obesity, or is it just an illusory correlation❓
@science @dataisbeautiful @health
The plot and curve fitting made in @LabPlot, a FREE, open source Data Visualization and Analysis software. It works on #Windows, #Linux and #macOS.
➡️ https://labplot.kde.org/download
#Data compiled for 184 countries.
#FOSS #FLOSS #OpenSource #FreeSoftware #DataViz #Visualization #Obesity #Health #ClimateChange #ClimateCrisis #Climate #Food
#Windows #Linux #macOS #data #FOSS #FLOSS #OpenSource #FreeSoftware #dataViz #visualization #obesity #health #ClimateChange #ClimateCrisis #climate #food
LabPlot · @LabPlot
351 followers · 31 posts · Server floss.social
Thanks to the work of @chrismettal, a new dark plot theme, #Dracula, is coming to land in @LabPlot soon!
https://en.wikipedia.org/wiki/Dracula_(color_scheme)
@LabPlot is a FREE, open source and cross-platform Data Visualization and
Analysis software accessible to everyone.
Download @LabPlot here:
https://labplot.kde.org/download
#DataViz #Visualization #Plotting #Theme #Color #LabPlot #FreeSoftware #FOSS #OpenSource
#dracula #dataViz #visualization #plotting #theme #color #labplot #FreeSoftware #FOSS #OpenSource
LabPlot · @LabPlot
351 followers · 31 posts · Server floss.social
LabPlot, KDE's software for data analysis and visualization, creates impressive professional looking charts from your data.
At some point, you will want to present them in a report or essay. Learn in little over a minute how you can do that with this video tutorial:
https://tube.kockatoo.org/w/kh1Dyyt7bRbAqtbG4wFhUJ
#dataViz #visualization #research #plotting #graph

KDE · @kde
17853 followers · 555 posts · Server floss.social@LabPlot , KDE's software for data analysis and visualization, creates impressive professional looking charts from your data.
At some point, you will want to present them in a report or essay.
Learn in little over a minute how you can do that with this video tutorial:
#data #analysis #database #dataViz
LabPlot · @LabPlot
351 followers · 31 posts · Server floss.social
KDE · @kde
17763 followers · 550 posts · Server floss.social
Jan · @janriemer
340 followers · 373 posts · Server floss.social
@ikt @ClimateHuman Ah, thanks! Sorry, I should have better researched here 😳 - you are totally correct.
Also have a look at this data from "OurWorldInData", showing visually the progress we've made in reducing emmisions:
Unfortunately, this is still not enough, but good first steps nonetheless. 👍
#ClimateChange #ClimateCrisis
#DataVisualization
#DataViz
#Data
#data #dataViz #dataVisualization #ClimateCrisis #ClimateChange

Jesus M. Gonzalez-Barahona · @jgbarah
202 followers · 6428 posts · Server floss.social
Jesus M. Gonzalez-Barahona · @jgbarah
202 followers · 6428 posts · Server floss.social
RT @datanautes
You can read the free ebook "Fundamentals of Data Visualization" by Claus O. Wilke on #dataviz with #rstats on the following website of the named author:
https://clauswilke.com/dataviz/
Jesus M. Gonzalez-Barahona · @jgbarah
203 followers · 6428 posts · Server floss.social

Ismael Olea · @olea
54 followers · 8809 posts · Server floss.social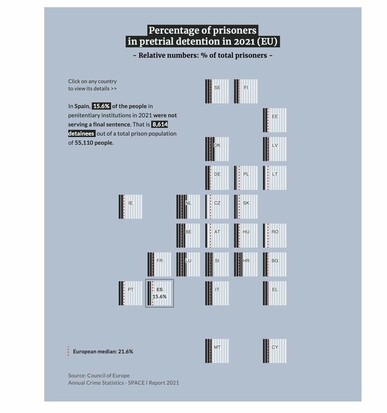
RT @datajournalism
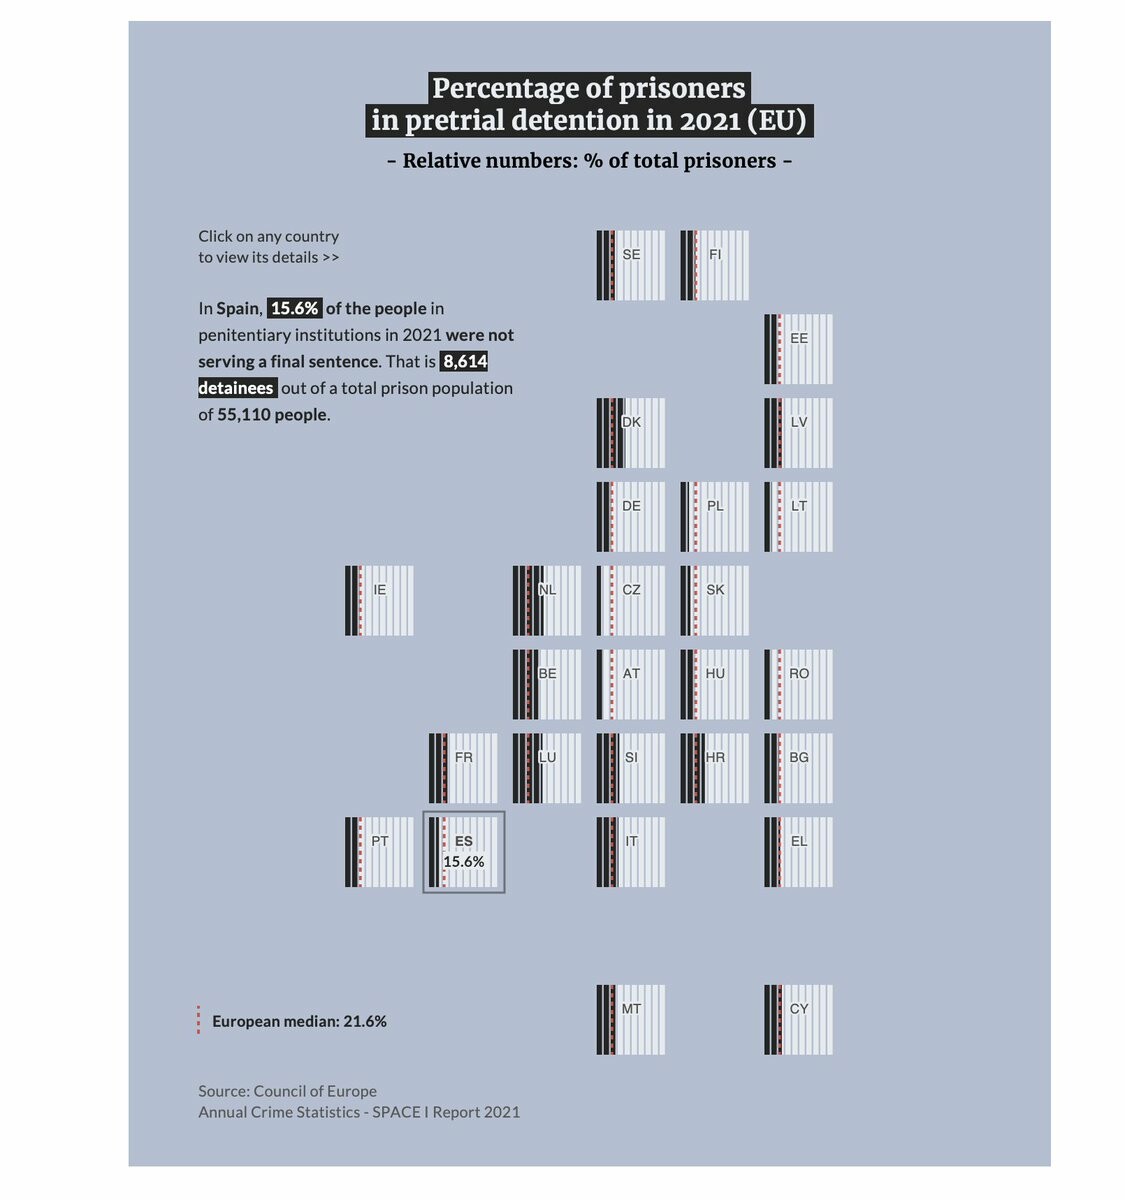
Currently one in five people in EU prisons are being held in pretrial detention. @civio has taken part in a comprehensive collaboration full of deep research and #dataviz about a disturbing trend that affects nearly every EU country. #datajournalism
https://bit.ly/39SVvoA
Ismael Olea · @olea
108 followers · 9109 posts · Server floss.socialRT @datajournalism
Currently one in five people in EU prisons are being held in pretrial detention. @civio has taken part in a comprehensive collaboration full of deep research and #dataviz about a disturbing trend that affects nearly every EU country. #datajournalism
https://bit.ly/39SVvoA
Jesus M. Gonzalez-Barahona · @jgbarah
204 followers · 6428 posts · Server floss.social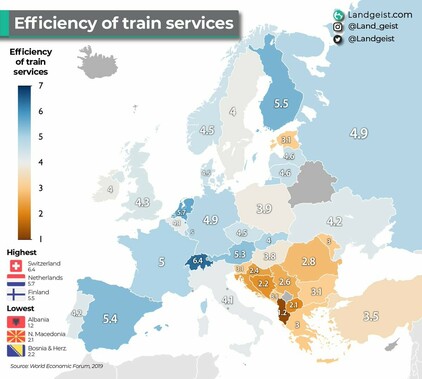
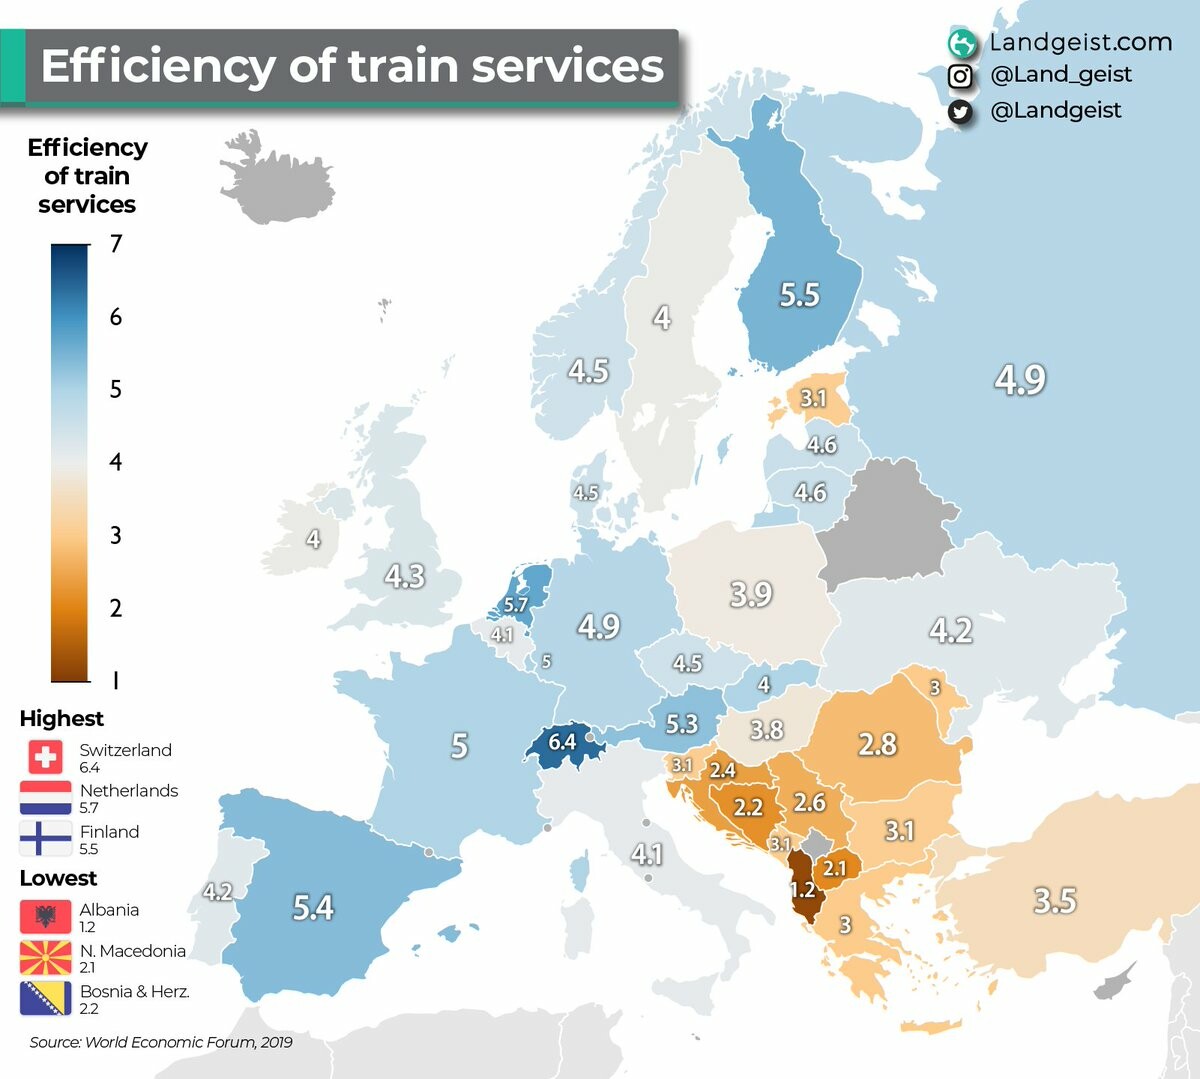
RT @landgeist
How good are train services in #Europe? Well, it has some of the best and worst train services in world.
Full article: https://landgeist.com/2021/11/09/efficiency-of-train-services-in-europe/
#spatial #geospatial #dataViz #GIS #maps #Europe
Jesus M. Gonzalez-Barahona · @jgbarah
204 followers · 6428 posts · Server floss.social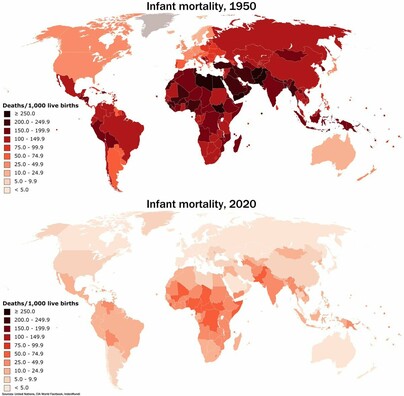
RT @randal_olson
The massive decrease in worldwide infant mortality from 1950 to 2020 has been an outstanding human achievement. #dataviz
Jesus M. Gonzalez-Barahona · @jgbarah
204 followers · 6428 posts · Server floss.social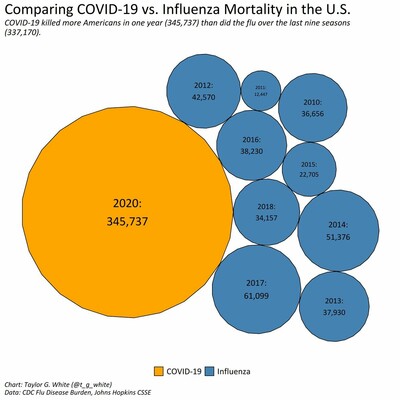
Ismael Olea · @olea
108 followers · 9109 posts · Server floss.social
Jesus M. Gonzalez-Barahona · @jgbarah
204 followers · 6428 posts · Server floss.socialRT @randal_olson
"As we can clearly see, CO2 concentration has always fluctuaaaa... oh."
#dataviz source: https://www.reddit.com/r/dataisbeautiful/comments/igyfxm/oc_two_thousand_years_of_global_atmospheric/