
Epimorphics · @epimorphics
49 followers · 138 posts · Server mastodonapp.uk
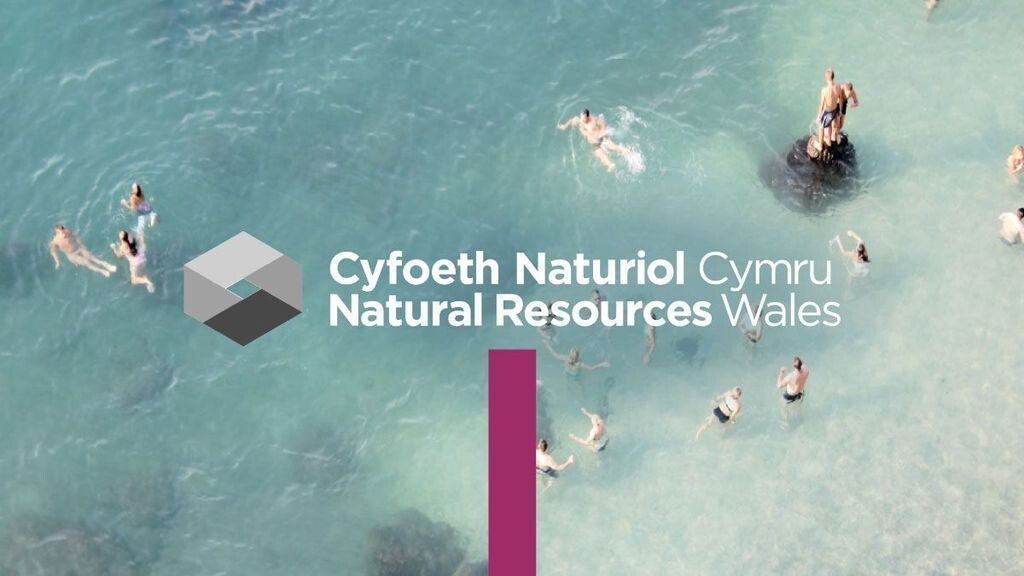
Next in our series on #GovTech data services, we highlight our work with
Natural Resorces Wales on their Bathing Waters service.
Our Data Design & Linked Data expertise helped create a bilingual resource for citizens, scientists, & Local Government
https://www.epimorphics.com/projects/bathing-waters
#OpenData #WelshData #GovTech #DataDesign #LinkedData #LocalGov
#govtech #opendata #welshdata #datadesign #linkeddata #localgov
Epimorphics · @epimorphics
46 followers · 95 posts · Server mastodonapp.uk
Looking to partner on a data-driven project? Look no further! Epimorphics has a wealth of experience in data standards, #LinkedData, #DataIntegration and #DataDesign, and we pride ourselves on being great collaborators.
Let's chat! #DataCollaboration https://www.epimorphics.com/about/
#linkeddata #dataintegration #datadesign #datacollaboration

Jonatan Hildén · @jhilden
287 followers · 765 posts · Server vis.social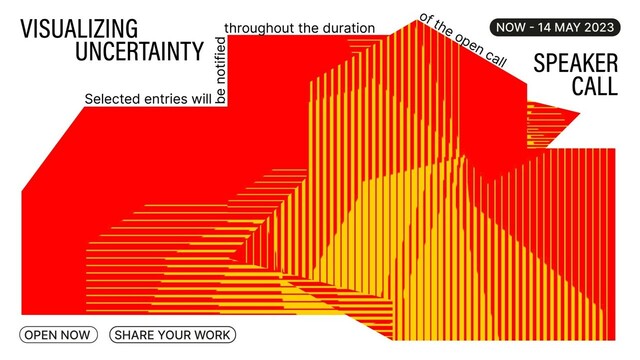
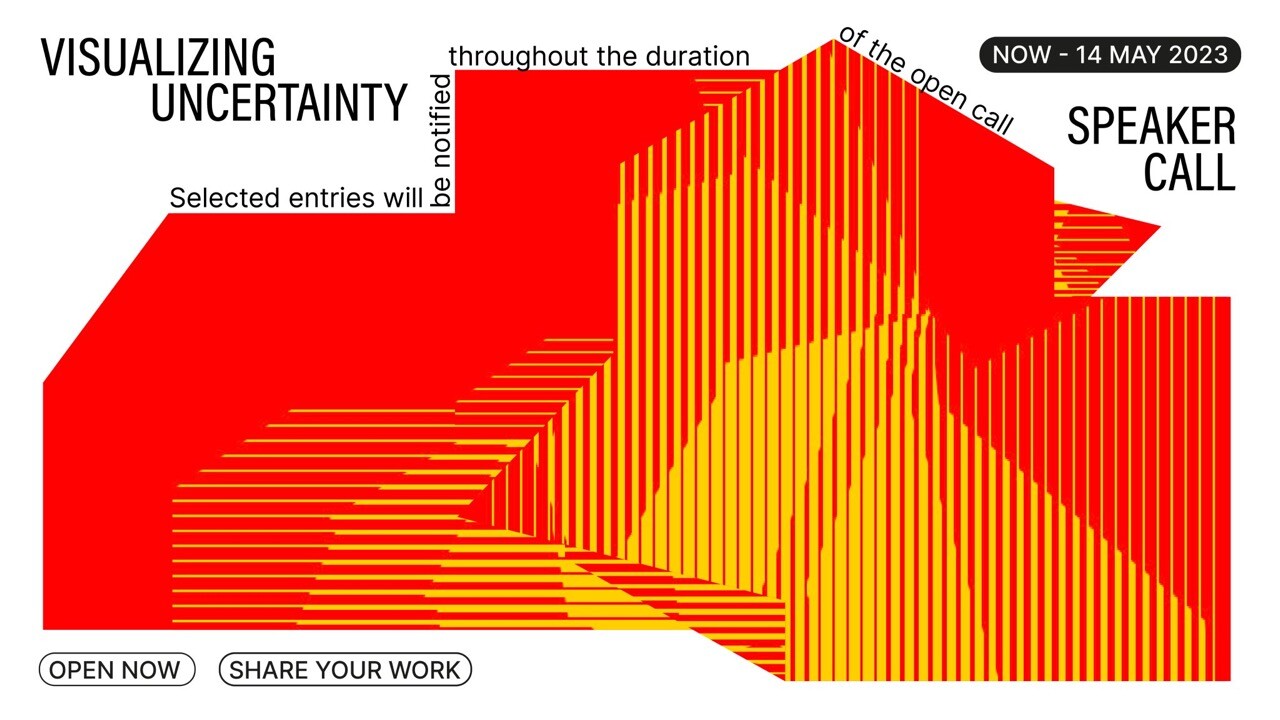
Visualizing Knowledge call for speakers:
”What's Visualizing Uncertainty for you? If you're an industry expert or a data-driven enthusiast, we're looking for speaker proposals. You could join the VK23 lineup next to some of the best on 23.06 in Helsinki. More info: http://bit.ly/speaker-call-vk23… #dataviz #conference #datadesign ”
https://twitter.com/vizknowledge/status/1612477299781210113?s=20&t=nI6Xh8i7syBF5H3kOp33xA
#datadesign #conference #dataviz
Nigel Hawtin · @nigelhawtin
207 followers · 97 posts · Server vis.social#visual Students…this looks interesting ‘Share your data & design work with the world!’ #VK23 international call for students projects is now open for submission. Send your project by May 5th, get details at bit.ly/3PdhyXA #dataviz #conference #datadesign https://vis.social/@jhilden/109670543780024175
#datadesign #conference #dataviz #vk23 #visual
Jonatan Hildén · @jhilden
287 followers · 750 posts · Server vis.social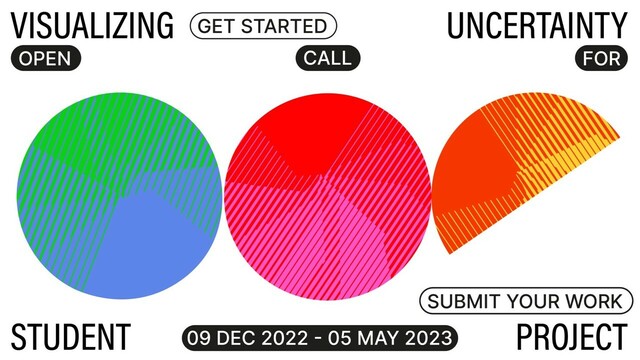
Visualizing knowledge, a festival I was involved in launching, is making a comeback:
Share your data & design work with the world! #VK23 international call for students projects is now open for submission. Send your project by May 5th, get details at http://bit.ly/3PdhyXA #dataviz #conference #datadesign #data #conference #helsinki #finland #aaltoarts
#aaltoarts #finland #helsinki #data #datadesign #conference #dataviz #vk23

Jenny Andrew · @drandrewv2
1059 followers · 1261 posts · Server freeradical.zone#DataModelling help: I’m trying to unpick a legacy system (CRM adjacent) that makes a bit of a dog’s dinner out of describing (conflating) subjects’ education and awards/qualifications… anyone know of a well-considered #DataStandard or #IndustryDataModel for education/qualifications that’s worth referring/converging to? (I am categorically not interested in more software, by the way!)
#datamodelling #datastandard #industrydatamodel #data #datamanagement #datadesign

CLEVER°FRANKE · @cleverfranke
33 followers · 13 posts · Server mastodon.online
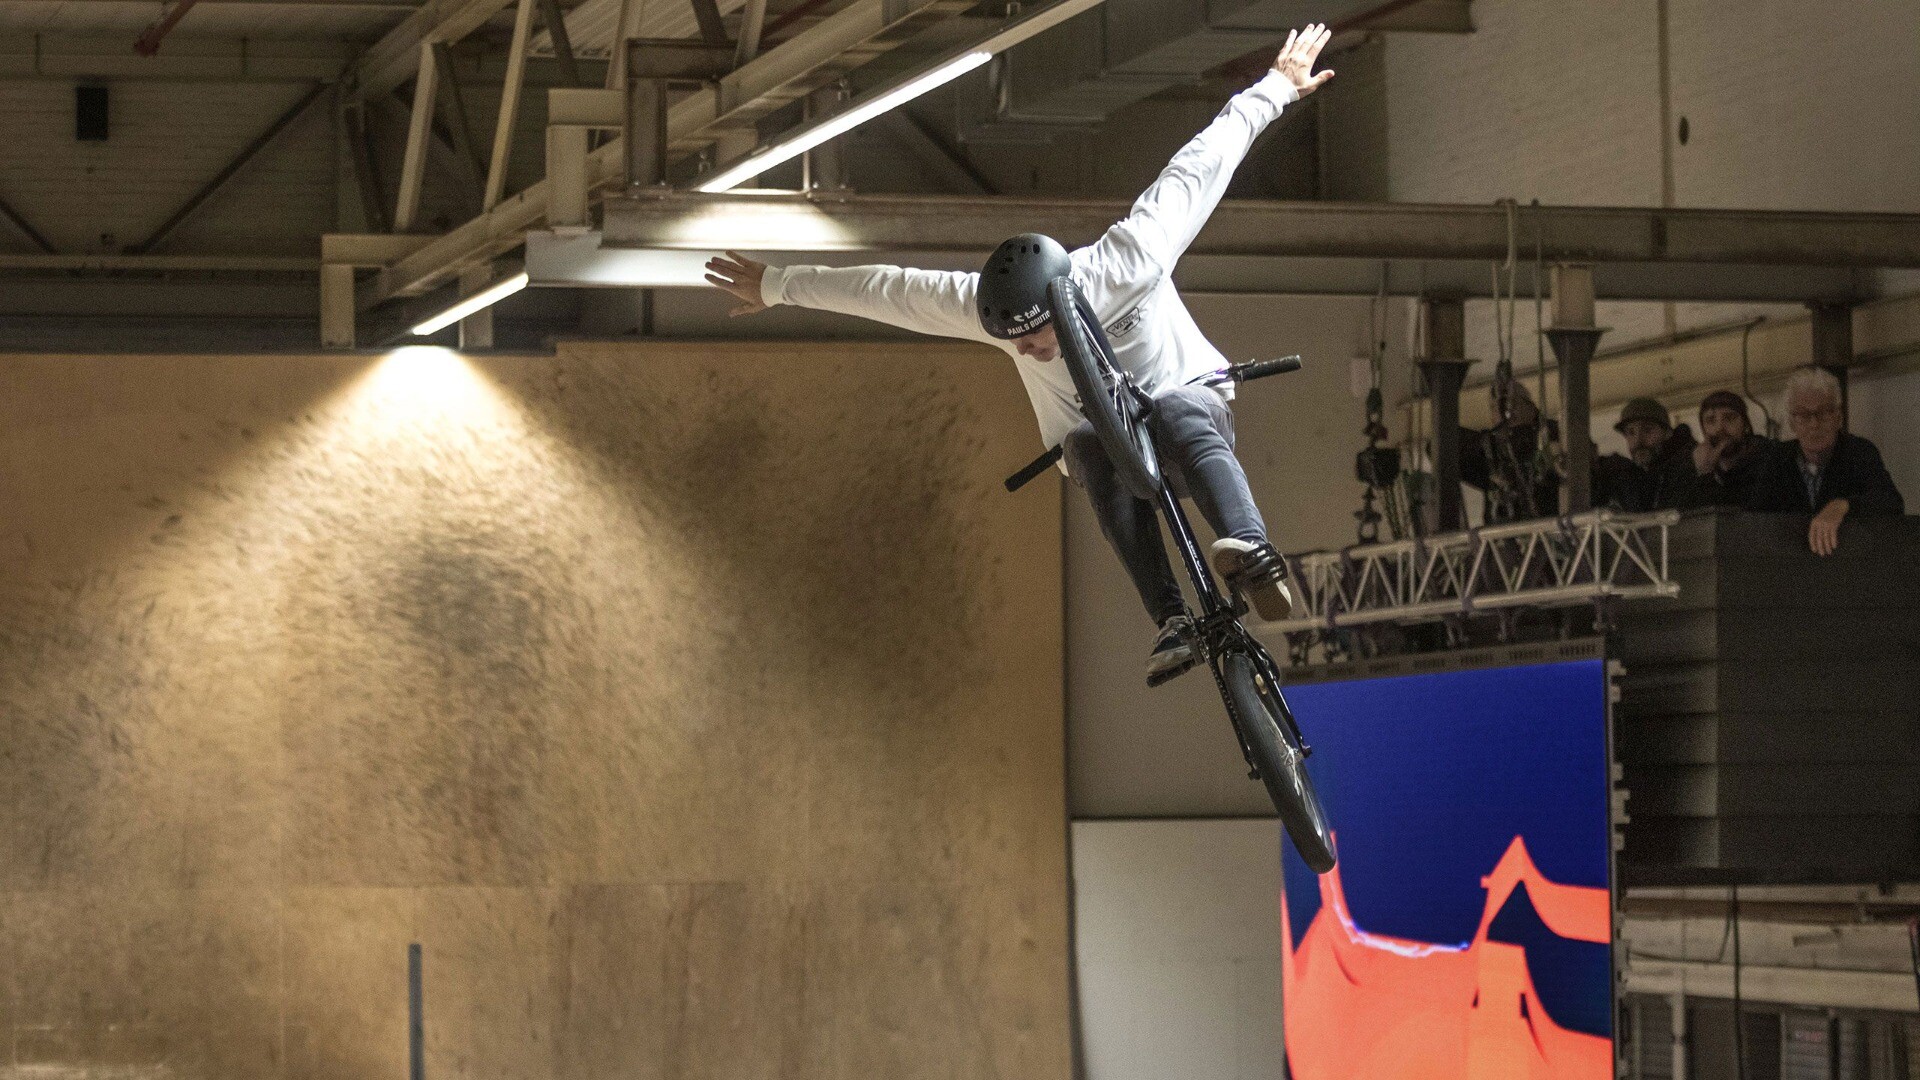
Throwback: live freestyle BMX data visualization.
Back in December 2018, we created a live data visualization that showed the rider's path throughout the skatepark during the Dutch National BMX championship. Read the full case here: https://www.cleverfranke.com/project/bmx-data-visualization
CLEVER°FRANKE · @cleverfranke
31 followers · 12 posts · Server mastodon.onlineOur Project Manager Emilija shares her thoughts about pioneering under constraints and explores how the limits we encounter in projects ignite creativity.
Read the article here: https://medium.com/clever-franke/design-and-technology-how-to-pioneer-amongst-constraints-db4c588c33d
#dataviz #datavisualization #datadesign
GalwayCalling · @GalwayCalling
172 followers · 36 posts · Server mastodon.ie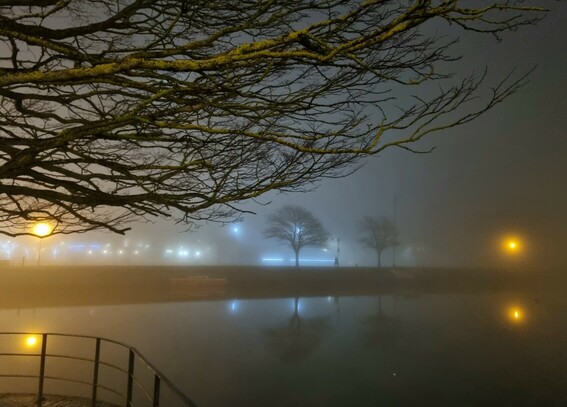
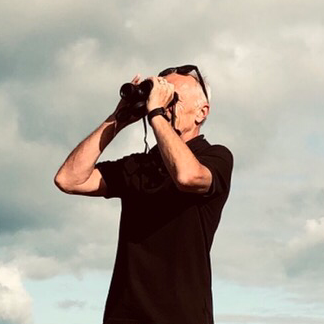
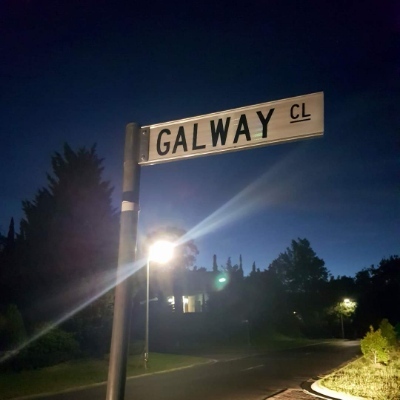
Fog shrouding the Claddagh Basin, overlooking Línte na Farraige — a light installation on the banks of the River Corrib, indicating the projected rise in sea levels in 2150 from future storm surges. Designed by Finnish artists Timo Aho & Pekka Niittyvirta, using data from the sixth report by the UN's Intergovernmental Panel on Climate Change. #Galway #Claddagh #ClimateChange #DataDesign #Installation #Mastodaoine
#galway #claddagh #climatechange #datadesign #installation #mastodaoine

Mike Nicholson · @MikeTeeVee
244 followers · 279 posts · Server mindly.social
Every child’s death is a tragedy.
However, what you won’t often hear on the news is that there have been huge improvements with regards to the number of children dying.
Another beautiful data design job from the book, Beautiful News, by David McCandless.
#goodnews #childrenareourfuture #beatifulnewsbook #illustrations #datadesign #davidmccandless
#goodnews #childrenareourfuture #beatifulnewsbook #illustrations #datadesign #davidmccandless
Mike Nicholson · @MikeTeeVee
185 followers · 259 posts · Server mindly.social
It’s not all doom and gloom, which is what any sane person would be led to believe if they gorge on the news.
The percentage of the world living in ‘extreme poverty’ has reduced from 43% to 9% since 1981.
🔁 - I’m sharing from the aptly named book, Beautiful News.
#beautiful #beautifulnews #datadesign #data #goodnews #positivenews #poverty
#beautiful #beautifulnews #datadesign #data #goodnews #positivenews #poverty
CLEVER°FRANKE · @cleverfranke
23 followers · 9 posts · Server mastodon.onlineOur 3D map visualizations for the Africa Climate Mobility project zoom in to specific locations and show future impacts of climate change. Visit the platform: https://africa.climatemobility.org/
#dataviz #datavisualization #datadesign
CLEVER°FRANKE · @cleverfranke
23 followers · 8 posts · Server mastodon.onlineWe analyzed images published over the past year in media (553.527 images) and discovered how media outlets paint our worldview. The video is an overview of colors in media by week.
Read more about the color research here: https://colors.cleverfranke.com/CF-color-research.pdf
#dataviz #datavisualization #datadesign
DatavizAdventure · @Datavizadventure
15 followers · 7 posts · Server vis.social
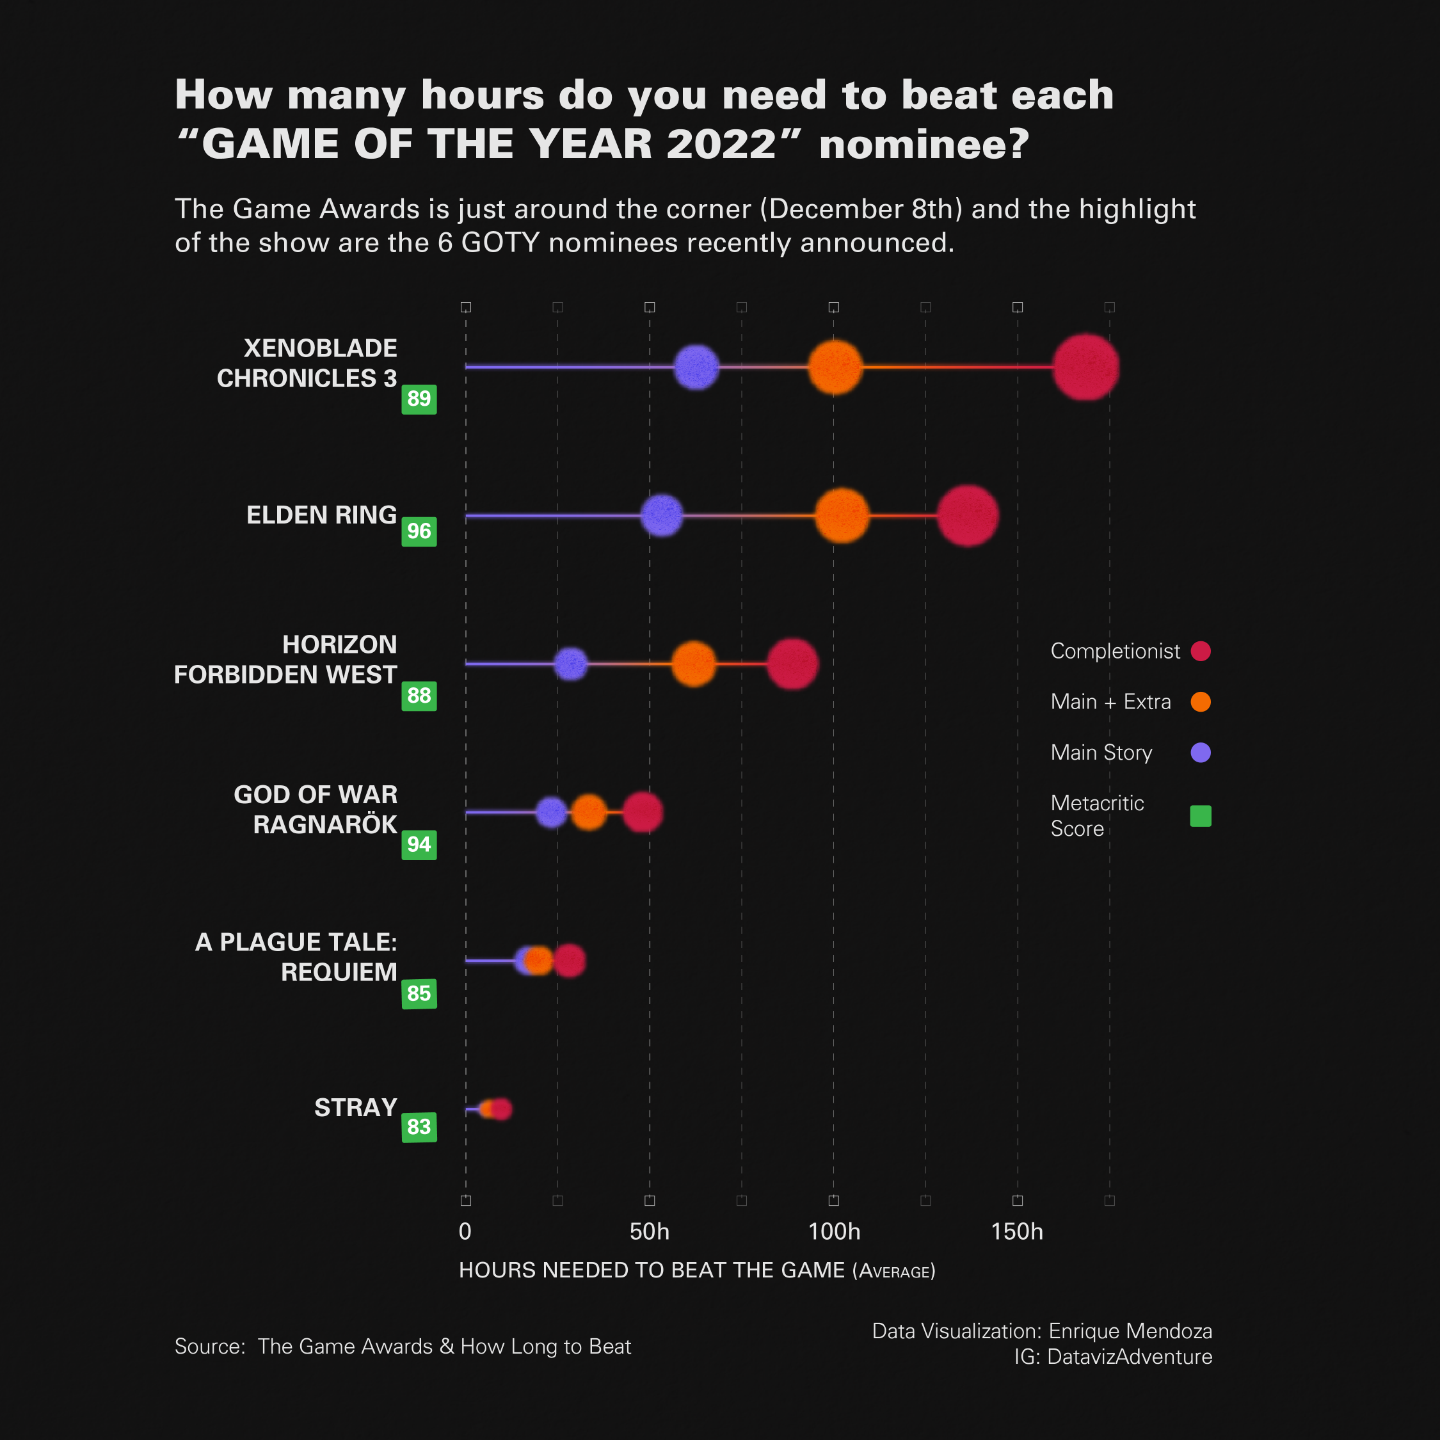
Hello #datafam!
The 6 "Game of the Year" (#GOTY) nominees have been announced, so I highly recommend to play any of these nominees before The Game Awards night (December 8th). Here a #dataviz for help you know the hours needed to beat each game😊.
#datavisualization #videogames #gameawards #informationdesign #gamer #pc #infovis #datadesign #designer #ggplot2
#ggplot2 #designer #datadesign #infovis #pc #gamer #informationdesign #GameAwards #videogames #datavisualization #dataviz #goty #datafam

Alain MICHEL 🤓 · @alainmi11
3330 followers · 3280 posts · Server mamot.fr
#DataWall : mur de données participatif.
➜ Utilisation pédagogique de la mise en forme visuelle et participative des données.
Par @canope_31 @abeauval @canope_65 @canope_46
👍
#Data #DataDesign #EMI
https://view.genial.ly/5fd76c3d131a4e0d2dbf58cd
#datawall #data #datadesign #emi