FragariaChemist · @FragariaChemist
22 followers · 8 posts · Server vis.socialHello #dataviz community. I've been learning how to use Tableau by creating dashboards for work. I test matrices for pesticides in California. I'm a career chemist.
This is what I've been working on for the past few months. Constructive feedback is welcome!
#dataanalysis #tableau #datafam #dataviz
T. from Data Rocks · @datarocksnz
69 followers · 38 posts · Server me.dm📚 Every other week, I post a review from my Data Viz Bookshelf on LinkedIn and on my blog.
Check it out!
https://www.datarocks.co.nz/linktree
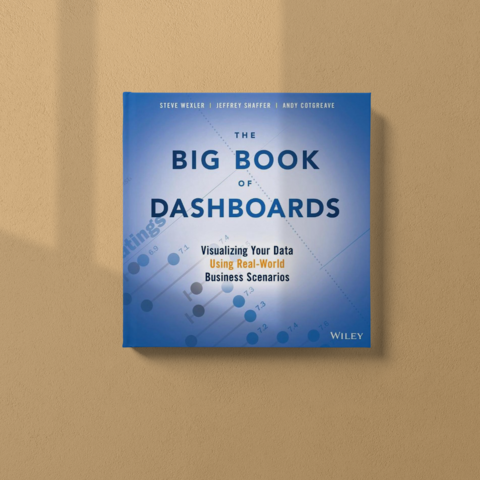
This week, an all-time favourite: The Big Book of Dashboards by Wexler, Shaffer & Cotgreave
#datafam #dataviz #dashboard #datavizbookshelf
T. from Data Rocks · @datarocksnz
69 followers · 38 posts · Server me.dmLast week I shared all I know about wireframes in dashboard design with my newsletter subscribers.
This week it'll be all about how to craft a good dashboard COLOUR PALETTE! Subscribe here: https://cutt.ly/whatsrocking
#dashboard #dataviz #datafam #vissocial
T. from Data Rocks · @datarocksnz
62 followers · 32 posts · Server me.dmHey friends!
📚 The Data Viz Bookshelf is also on Medium!
This week: Information Dashboard Design by Stephen Few
https://medium.com/@datarocksnz/fa5856b5d39d?source=friends_link&sk=ee3feabb007ccb71a9b82467935f1ab3
#datafam
#datavizbookshelf
#datavisualization
#dataviz
#dashboard
#vissocial
#datafam #datavizbookshelf #datavisualization #dataviz #dashboard #vissocial
T. from Data Rocks · @datarocksnz
58 followers · 27 posts · Server me.dmHey friends!
📚 Every other week, I post a review from my Data Viz Bookshelf on LinkedIn and on my blog.
Check it out!
https://www.datarocks.co.nz/linktree
This one's gonna ruffle some feathers: Information Dashboard Design by Stephen Few
#datafam
#datavizbookshelf
#datavisualization
#dataviz
#dashboard
#vissocial
#datafam #datavizbookshelf #datavisualization #dataviz #dashboard #vissocial
T. from Data Rocks · @datarocksnz
57 followers · 24 posts · Server me.dm📚 This is The Bookshelf in a nutshell! The TL;DR, quick-fire, no fluff summaries of my long-form Data Viz Bookshelf reviews.
Here are the 6 steps to make data-informed decisions from Turning Data Into Wisdom by Kevin Hanegan.
https://medium.com/@datarocksnz/996bc26892d8?source=friends_link&sk=28f331344de38939107fb8d20a469400
#datafam
#datavizbookshelf
#datavisualization
#dataviz
#datastorytelling
#vissocial
#datafam #datavizbookshelf #datavisualization #dataviz #datastorytelling #vissocial
T. from Data Rocks · @datarocksnz
54 followers · 23 posts · Server me.dmHey friends!
📚 The Data Viz Bookshelf is also on Medium!
This week: Data-Driven Storytelling (multiple authors)
https://medium.com/@datarocksnz/f318a36d31a?source=friends_link&sk=c8bd5169fcd0c4cb82d520ff0d0db388
#datafam
#datavizbookshelf
#datavisualization
#dataviz
#datastorytelling
#vissocial
#datafam #datavizbookshelf #datavisualization #dataviz #datastorytelling #vissocial
T. from Data Rocks · @datarocksnz
51 followers · 22 posts · Server me.dm📚 This is The Bookshelf in a nutshell! The TL;DR, quick-fire, no fluff summaries of my long-form Data Viz Bookshelf reviews.
Here are 10 things I learned from Be Data Literate by Jordan Morrow
https://medium.com/@datarocksnz/a1bc488ca933?source=friends_link&sk=840b9efb8549cde74abf658346079267
#datafam
#datavizbookshelf
#datavisualization
#dataviz
#datastorytelling
#vissocial
#datafam #datavizbookshelf #datavisualization #dataviz #datastorytelling #vissocial
T. from Data Rocks · @datarocksnz
43 followers · 20 posts · Server me.dmHey friends!
📚 Every other week, I post a review from my Data Viz Bookshelf on LinkedIn and on my blog.
Check it out!
https://www.datarocks.co.nz/linktree
This week: Data-Driven Storytelling (multiple authors)
#datafam
#datavizbookshelf
#datavisualization
#dataviz
#datastorytelling
#vissocial
#datafam #datavizbookshelf #datavisualization #dataviz #datastorytelling #vissocial
T. from Data Rocks · @datarocksnz
39 followers · 18 posts · Server me.dm📚 This is The Bookshelf in a nutshell! The TL;DR, quick-fire, no fluff summaries of my long-form Data Viz Bookshelf reviews.
Here are 10 things I learned from Avoiding Data Pitfalls by Ben Jones
https://medium.com/@datarocksnz/bdf37f16fd0e?source=friends_link&sk=8f5e6afaf33201c404694fa6cad282b1
#datafam
#datavizbookshelf
#datavisualization
#dataviz
#datastorytelling
#vissocial
#datafam #datavizbookshelf #datavisualization #dataviz #datastorytelling #vissocial
T. from Data Rocks · @datarocksnz
39 followers · 18 posts · Server me.dmI created my very own Data Design Manifesto!
My newsletter subscribers read all about it yesterday and also got the chance to download the poster for free. :)
You can subscribe here: https://cutt.ly/whatsrocking
Or buy the posters here: https://cutt.ly/DataRocksNZ-Manifesto
#dataviz #visSocial #datavisualization #powerbi #tableau #datafam
#dataviz #vissocial #datavisualization #powerbi #tableau #datafam
T. from Data Rocks · @datarocksnz
21 followers · 12 posts · Server me.dm📚 This is The Bookshelf in a nutshell! The TL;DR, quick-fire, no fluff summaries of my long-form Data Viz Bookshelf reviews.
Here are 10 things I learned from Factfulness by Hans, Ola and Anna Rosling.
https://medium.com/@datarocksnz/bdf37f16fd0e?source=friends_link&sk=8f5e6afaf33201c404694fa6cad282b1
#datafam
#datavizbookshelf
#datavisualization
#dataviz
#datastorytelling
#vissocial
#datafam #datavizbookshelf #datavisualization #dataviz #datastorytelling #vissocial
T. from Data Rocks · @datarocksnz
21 followers · 12 posts · Server me.dmHey friends!
📚 The Data Viz Bookshelf is back!
Every other week, I post a review from my data viz bookshelf on LinkedIn and on my blog. Check it out!
https://www.datarocks.co.nz/linktree
This week: Storytelling with Data by Cole Nussbaumer Knaflic
#datafam
#datavizbookshelf
#datavisualization
#dataviz
#datastorytelling
#vissocial
#datafam #datavizbookshelf #datavisualization #dataviz #datastorytelling #vissocial
Chris · @Chendysworld
56 followers · 13 posts · Server fosstodon.orgI can't believe London's Calling (www.londonscalling.net) is this week!
Been getting ready and looking forward to doing my Salesforce CRM Analytics talk on Friday
#TrailblazerCommunity #lc23 #datatribe #datafam
Tableau Tim · @tableautim
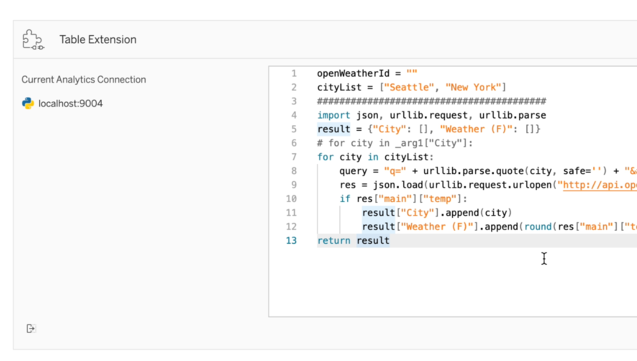
53 followers · 20 posts · Server mstdn.socialThe code editor for table extensions got an upgrade in #tableau 23.1. It now supports python, javascript and R alongside understanding syntax related to Tableau. #datafam #salesforce
🎥 Watch the full tutorial here: https://lnkd.in/ejVNRTx4
Tableau Tim · @tableautim
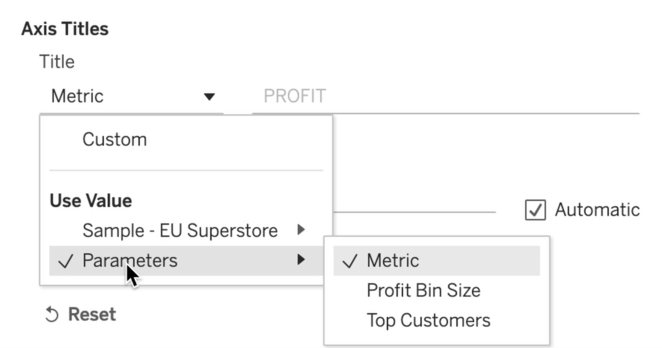
53 followers · 20 posts · Server mstdn.social📊✨Just released in Tableau 2023.1: Dynamic Axis Titles 📊✨ ... My latest YouTube tutorial guides you through setting up dynamic axis titles using parameters and single-value fields.
🎥 Watch the full tutorial here: https://lnkd.in/eqD7y6JY #tableau #datafam #Salesforce
Manning Publications · @ManningPublications
793 followers · 114 posts · Server techhub.social📢New in MEAP📢
Make sense of your data—by making it visual
Data storytelling can make all the difference between a data-confused audience and getting the point across in a clear way.
In Everyday Data Visualization Desireé Abbott will teach you to effectively communicate your data's value and make complex data easily understandable - by making it visual: http://mng.bz/lJOd
Get 45% off with code mlabbott till Mar 23
#dataviz #datascience #businessanalyst #digthisviz #datafam #tableau #d3 #ggplot
#dataviz #datascience #BusinessAnalyst #digthisviz #datafam #tableau #d3 #ggplot
Anne-Sophie Pereira De Sá · @wonderveilleuze
196 followers · 81 posts · Server vis.socialI'll be attending the @outlierconf in Porto and I can't wait! Who's coming to Porto?
Kudos to the
@datavizsociety for doing its best to be inclusive - with discounted tickets still available for both virtual and in-person attendees. #dataviz #datafam
https://www.outlierconf.com/
DatavizAdventure · @Datavizadventure
36 followers · 35 posts · Server vis.socialHi #datafam, I'm still exploring #dataviz #animations with #AfterEffects. This time I challenged myself to animate a bump chart.
Animating every dot, line and text is kind of tedious haha...
Source: VGChartz - "#UK Boxed Top Ten #Games"
.
.
.
.
#DataVisualization #Gamer #Data #Videogames #Design #InformationDesign #BumpChart #Charts #AnimatedCharts #UK #UKboxchart #UKgames #UKvideogames #selftaught #Nintendo #PlayStation #NintendoSwitch
#nintendoswitch #playstation #nintendo #SelfTaught #ukvideogames #ukgames #ukboxchart #animatedcharts #charts #bumpchart #informationdesign #design #videogames #data #gamer #datavisualization #games #uk #aftereffects #animations #dataviz #datafam
Kevin Flerlage · @FlerlageKev
68 followers · 9 posts · Server vis.socialNew Blog Post - What Size Should Your Dashboard Be?
I recently asked the #datafam what size they use for most of their dashboards. The results were very interesting! I also did some research of my own to determine the most optimal size. Check it out. https://www.flerlagetwins.com/2023/01/blog-post.html


