
Xan Gregg · @xangregg
213 followers · 126 posts · Server vis.social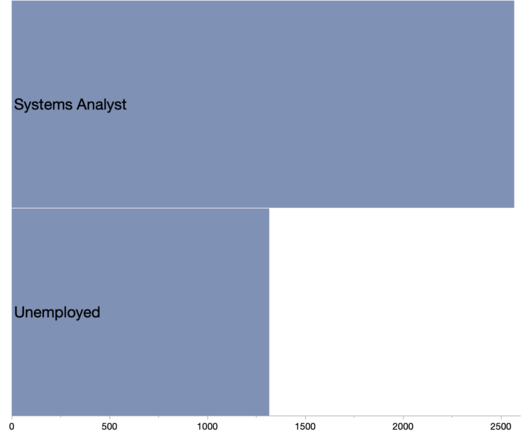
This week's #DataIsPlural pointed to a collection of #TheOnion's American Voices content.
https://codywinchester.com/the-onion-american-voices/
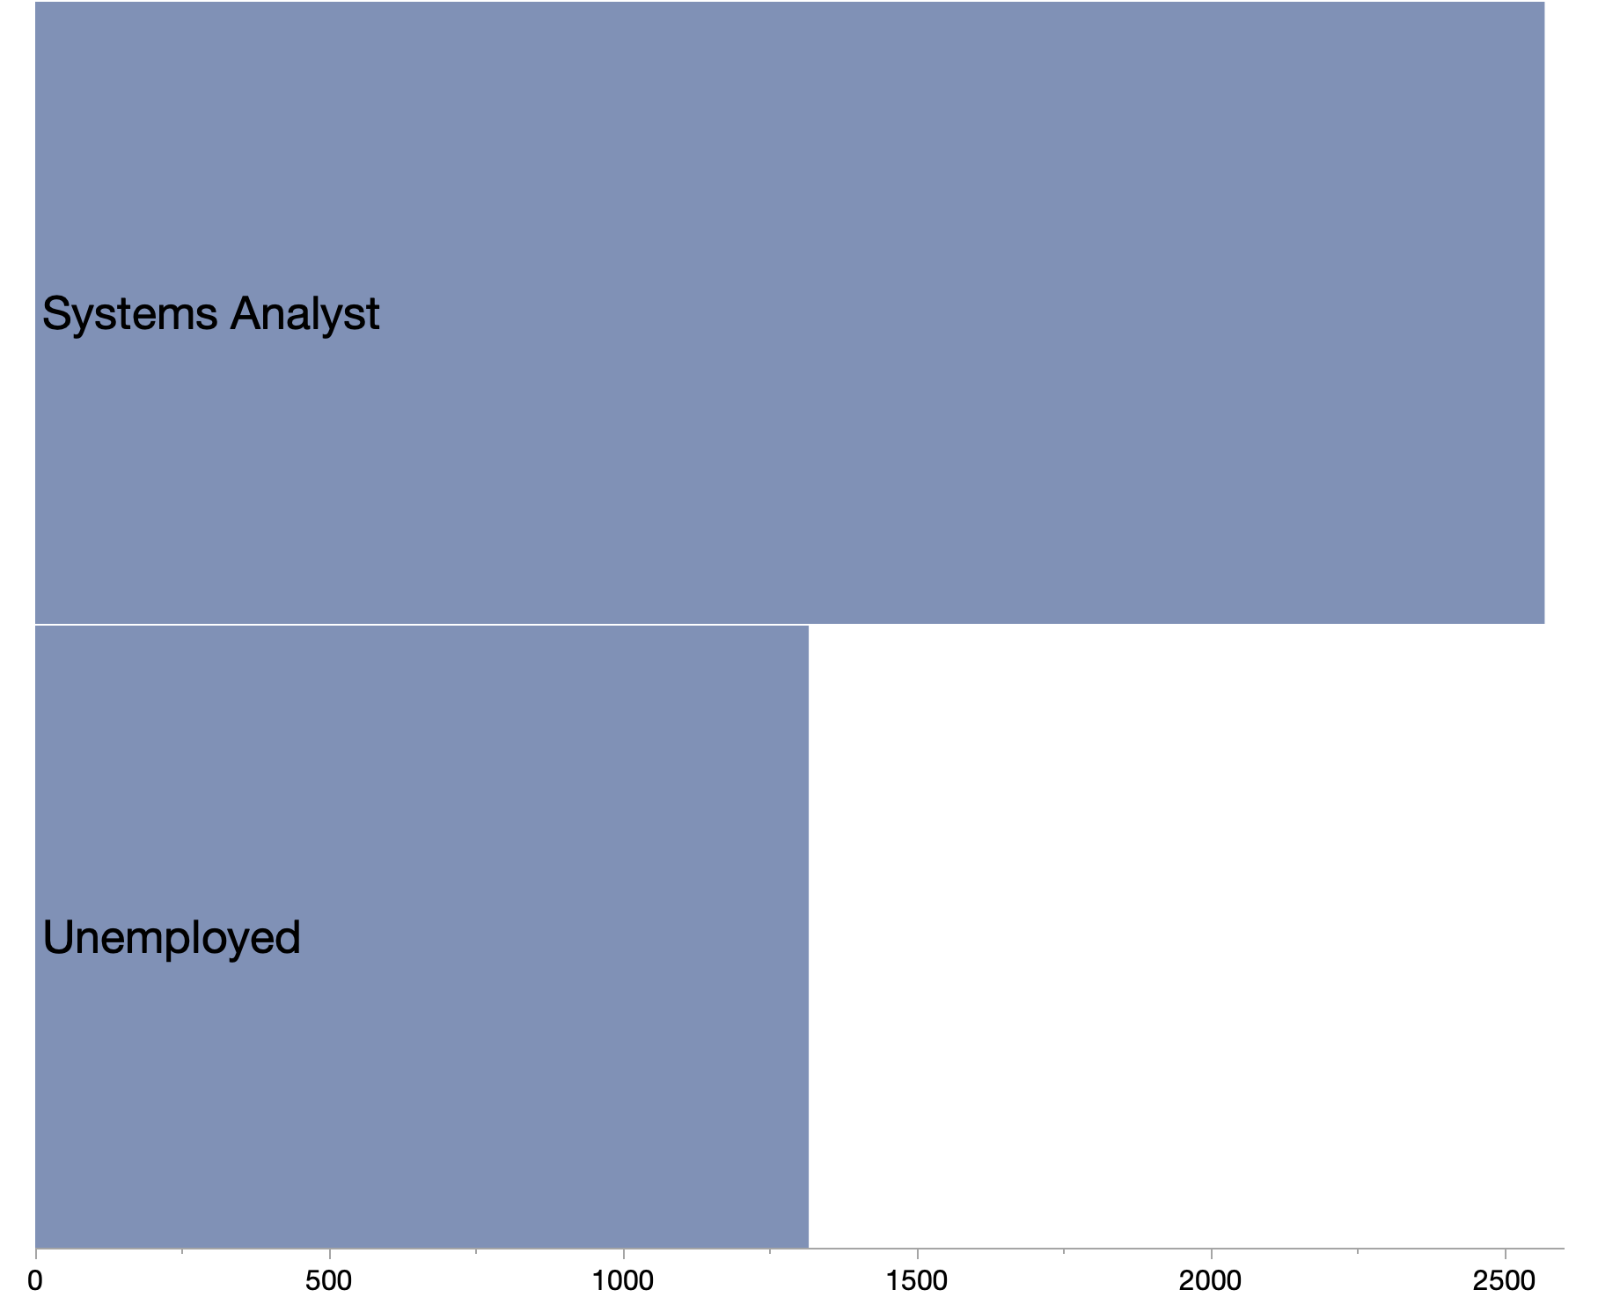
The occupation field is an interesting challenge to represent graphically: 13000 unique occupations over 23000 quotes, and two of them are extremely common (must be an in joke).
Here are two bar charts with roughly the same area scale for the top 2 and next 3000.

Leonora · @Herover
188 followers · 612 posts · Server helvede.net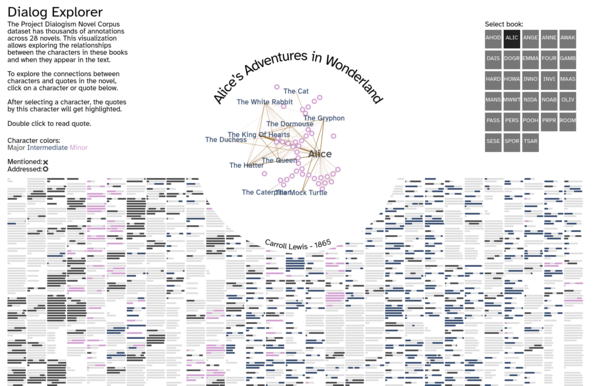
I made a *thing* for exploring dialog in Alice's Adventures in Wonderland, and other novels! I'm not sure what to call it, but you can see who talks with who, mentions and more.
Was suppose to be a static #dataviz image, but had too much fun with interactivity to stop there. Originally submitted it to #DVS #DataIsPlural challenge, which prompted people to create something using the "Project Dialogism" dataset. View online at https://leonora.app/a/dialogism , I gave up on making it mobile friendly tho...