
Steven P. Sanderson II, MPH · @stevensanderson
151 followers · 735 posts · Server mstdn.social
Ever wondered how to tweak margins, jazz up colors, or adjust font sizes in your R plots? Look no further! With `par()`, you're in control. 🎉
🔥 Level up your data viz skills and stand out from the crowd. The `par()` function is your key to data storytelling like never before. Don't just read—dive in, code, and watch your visualizations come alive. 📊💡
#DataVisualization #RProgramming #DataStorytelling #CodeMagic #R #RStats #OpenSource #Coding
Post: https://www.spsanderson.com/steveondata/posts/2023-08-09/
#Coding #OpenSource #RStats #r #codemagic #datastorytelling #rprogramming #datavisualization

T. from Data Rocks · @datarocksnz
57 followers · 24 posts · Server me.dm📚 This is The Bookshelf in a nutshell! The TL;DR, quick-fire, no fluff summaries of my long-form Data Viz Bookshelf reviews.
Here are the 6 steps to make data-informed decisions from Turning Data Into Wisdom by Kevin Hanegan.
https://medium.com/@datarocksnz/996bc26892d8?source=friends_link&sk=28f331344de38939107fb8d20a469400
#datafam
#datavizbookshelf
#datavisualization
#dataviz
#datastorytelling
#vissocial
#datafam #datavizbookshelf #datavisualization #dataviz #datastorytelling #vissocial
T. from Data Rocks · @datarocksnz
54 followers · 23 posts · Server me.dmHey friends!
📚 The Data Viz Bookshelf is also on Medium!
This week: Data-Driven Storytelling (multiple authors)
https://medium.com/@datarocksnz/f318a36d31a?source=friends_link&sk=c8bd5169fcd0c4cb82d520ff0d0db388
#datafam
#datavizbookshelf
#datavisualization
#dataviz
#datastorytelling
#vissocial
#datafam #datavizbookshelf #datavisualization #dataviz #datastorytelling #vissocial
T. from Data Rocks · @datarocksnz
51 followers · 22 posts · Server me.dm📚 This is The Bookshelf in a nutshell! The TL;DR, quick-fire, no fluff summaries of my long-form Data Viz Bookshelf reviews.
Here are 10 things I learned from Be Data Literate by Jordan Morrow
https://medium.com/@datarocksnz/a1bc488ca933?source=friends_link&sk=840b9efb8549cde74abf658346079267
#datafam
#datavizbookshelf
#datavisualization
#dataviz
#datastorytelling
#vissocial
#datafam #datavizbookshelf #datavisualization #dataviz #datastorytelling #vissocial
T. from Data Rocks · @datarocksnz
43 followers · 20 posts · Server me.dm
Hey friends!
📚 Every other week, I post a review from my Data Viz Bookshelf on LinkedIn and on my blog.
Check it out!
https://www.datarocks.co.nz/linktree
This week: Data-Driven Storytelling (multiple authors)
#datafam
#datavizbookshelf
#datavisualization
#dataviz
#datastorytelling
#vissocial
#datafam #datavizbookshelf #datavisualization #dataviz #datastorytelling #vissocial

· @emauviere
88 followers · 20 posts · Server mapstodon.space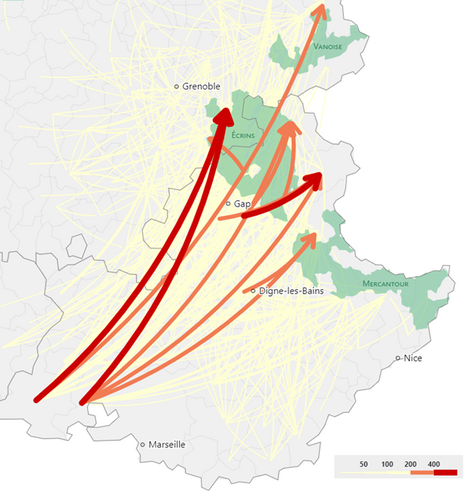
📊 Le nouveau #vizAgreste traite en cartes animées et en graphiques d’un sujet d’actualité en cette période estivale : la transhumance saisonnière des troupeaux vers des surfaces pastorales collectives.
Ce 10e récit graphique s’appuie sur des données inédites, et met en évidence une spécificité pyrénéenne, comparée aux autres massifs et zones de plaine concernées par la transhumance collective.
👉 https://vizagreste.agriculture.gouv.fr/la-transhumance-collective.html
#datavisualisation #datastorytelling #cartesdeflux
#vizagreste #datavisualisation #datastorytelling #cartesdeflux
T. from Data Rocks · @datarocksnz
39 followers · 18 posts · Server me.dm📚 This is The Bookshelf in a nutshell! The TL;DR, quick-fire, no fluff summaries of my long-form Data Viz Bookshelf reviews.
Here are 10 things I learned from Avoiding Data Pitfalls by Ben Jones
https://medium.com/@datarocksnz/bdf37f16fd0e?source=friends_link&sk=8f5e6afaf33201c404694fa6cad282b1
#datafam
#datavizbookshelf
#datavisualization
#dataviz
#datastorytelling
#vissocial
#datafam #datavizbookshelf #datavisualization #dataviz #datastorytelling #vissocial
T. from Data Rocks · @datarocksnz
21 followers · 12 posts · Server me.dm📚 This is The Bookshelf in a nutshell! The TL;DR, quick-fire, no fluff summaries of my long-form Data Viz Bookshelf reviews.
Here are 10 things I learned from Factfulness by Hans, Ola and Anna Rosling.
https://medium.com/@datarocksnz/bdf37f16fd0e?source=friends_link&sk=8f5e6afaf33201c404694fa6cad282b1
#datafam
#datavizbookshelf
#datavisualization
#dataviz
#datastorytelling
#vissocial
#datafam #datavizbookshelf #datavisualization #dataviz #datastorytelling #vissocial
T. from Data Rocks · @datarocksnz
21 followers · 12 posts · Server me.dm
Hey friends!
📚 The Data Viz Bookshelf is back!
Every other week, I post a review from my data viz bookshelf on LinkedIn and on my blog. Check it out!
https://www.datarocks.co.nz/linktree
This week: Storytelling with Data by Cole Nussbaumer Knaflic
#datafam
#datavizbookshelf
#datavisualization
#dataviz
#datastorytelling
#vissocial
#datafam #datavizbookshelf #datavisualization #dataviz #datastorytelling #vissocial

Deepali Kank · @deepali
121 followers · 102 posts · Server fosstodon.org
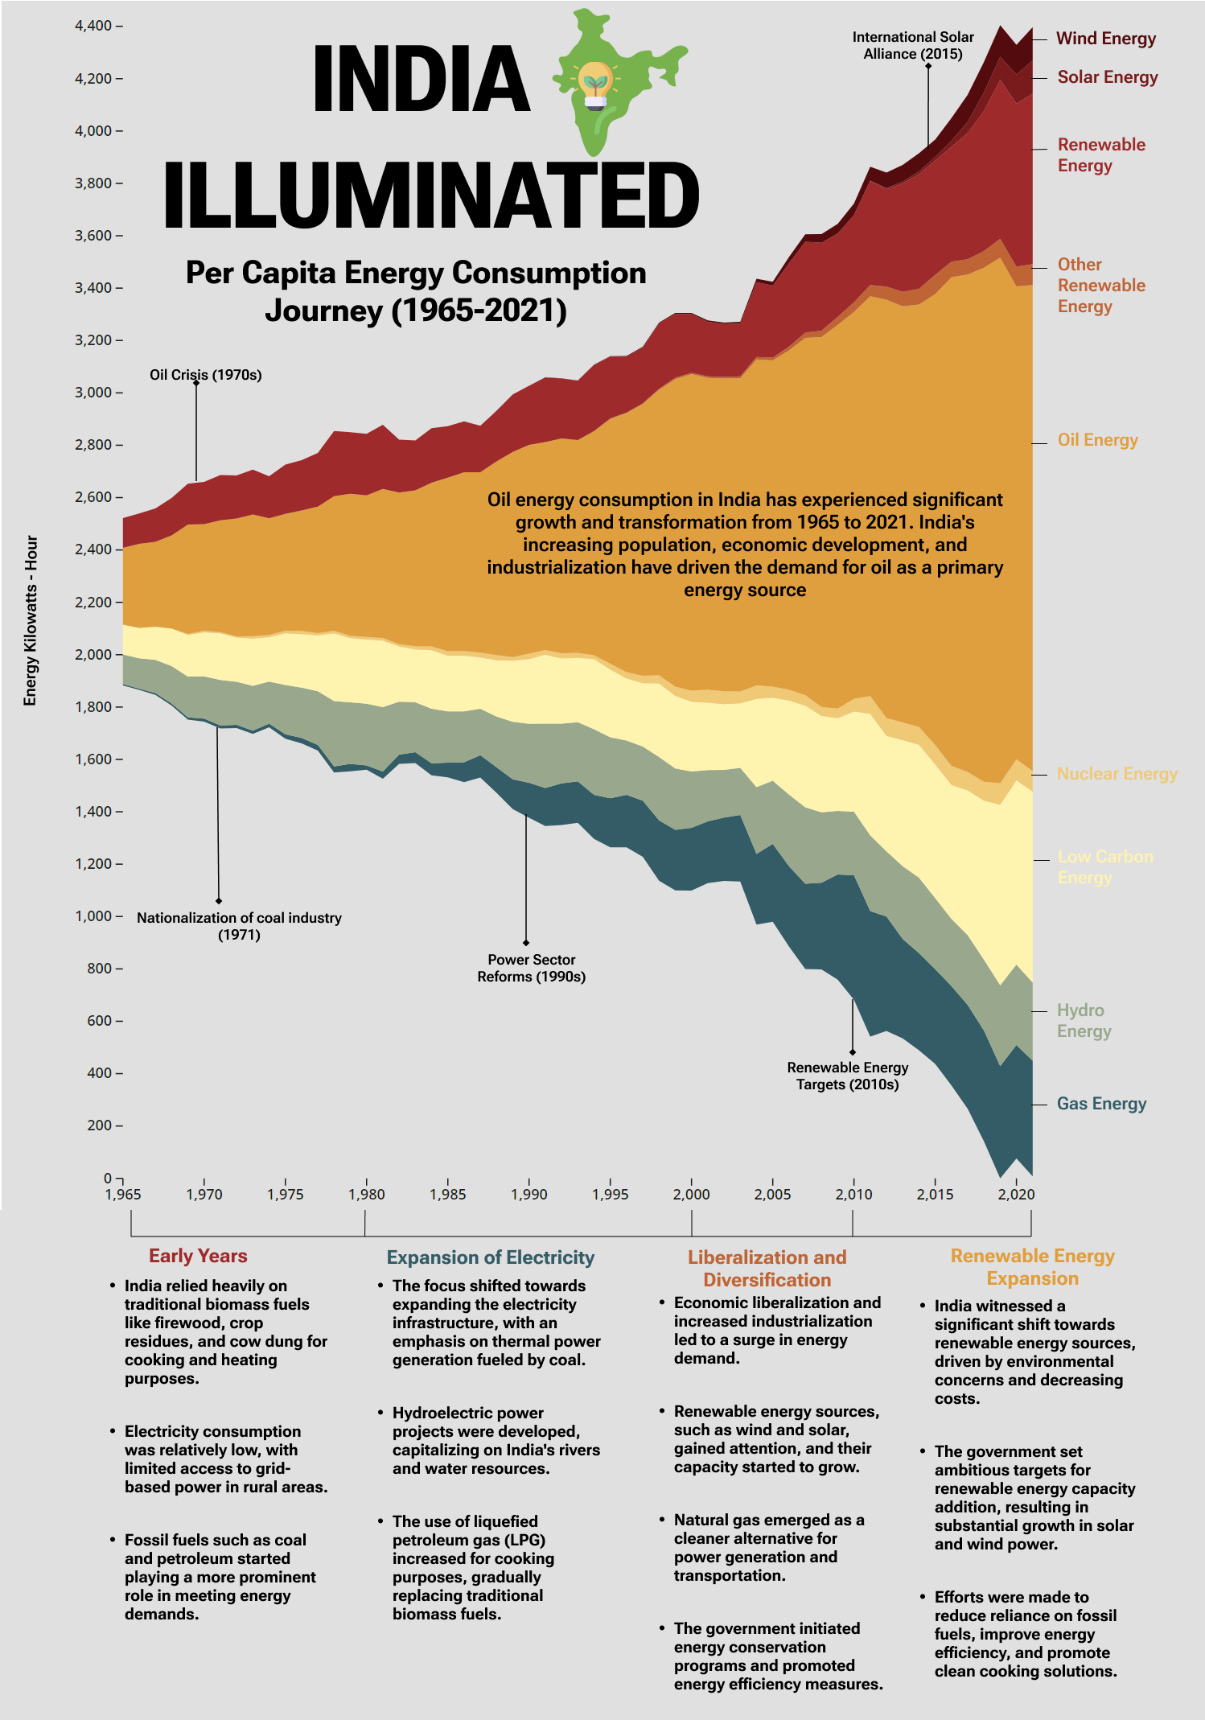
Did a bit of editing and created this infographic. #TidyTuesday
#datavisualisation #datastorytelling #india #energyconsumption
#tidytuesday #datavisualisation #datastorytelling #india #energyconsumption
T. from Data Rocks · @datarocksnz
9 followers · 5 posts · Server me.dmEarlier this year, I took on blogging again, reviewing one book from my Data Viz Bookshelf every week.
Here's my first post, from back in January - about how I (like many) learned to love data storytelling with Hans Rosling.
#data #dataviz #visSocial #datavisualization #datastorytelling #hansrosling #factfulness #bookreview #bookrecommendation
#data #dataviz #vissocial #datavisualization #datastorytelling #hansrosling #factfulness #bookreview #bookrecommendation

Marian Dörk · @nrchtct
1197 followers · 1829 posts · Server vis.social
neat #scrollytelling piece explaining the potential of potential energy held by elevated reservoirs to provide renewable energy for times of the day when the sun does not shine and the wind does not blow
https://www.nytimes.com/interactive/2023/05/02/climate/hydroelectric-power-energy.html
#datastorytelling #datavis #energytransition #scrollytelling

Jim Cowie · @jimcowie
161 followers · 470 posts · Server social.secret-wg.orgPutting the *measurement* into making a measurable difference in the #Internet ecosystem: update on community engagement OKRs from Hisham Ibrahim @ripencc
#internet #routingsecurity #ipv6 #datastorytelling

Marco Cortella :verified: · @Mcx83
89 followers · 179 posts · Server mastodon.uno#DataStorytelling di @SkyTG24 in occasione della giornata italiana dedicata alle vittime del #COVID19 .
#dataviz #18marzo
---
RT @pelopida
Il 18 marzo è la giornata dedicata alle vittime del Covid (ufficialmente quasi 190mila).
Con i colleghi di @SkyTG24 @toniacart e @MariannaBruschi abbiamo provato a ricordarle mescolando storie e dati.
Con un piccolo aiuto da parte di ChatGPT
https://tg24.sky.it/stories/cronaca/18-marzo-giornata-vitt…
https://twitter.com/pelopida/status/1637009835219722240
#datastorytelling #COVID19 #dataviz #18marzo

Anna Gnyp · @4nn4_clickt
312 followers · 154 posts · Server mstdn.socialBin sehr begeistert von #INTAVIA
https://twitter.com/projectintavia
einem #OpenSource Storytelling Tool, mit dem sich Daten auf verschiedene Arten visualisieren lassen. Danke für den informativen Workshop. Ich bin gespannt auf die Weiterentwicklung!
@DHd
https://intavia.acdh-dev.oeaw.ac.at
#DHd2023 #DataStorytelling #digitalhumanities #dataviz #ScienceCommunication
#sciencecommunication #dataviz #digitalhumanities #datastorytelling #dhd2023 #OpenSource #intavia

Angelica Lo Duca · @alod83
0 followers · 1 posts · Server me.dm
I'm excited to speak about Data Storytelling in Comet at #ConvergenceConference on March 7-8! Join me for this two-day virtual event to explore the new frontiers of machine learning. Registration is free: https://www.ml-convergence.com/
#convergenceconference #dataviz #datastorytelling #comet #datascience

KCL Digital Humanities · @kingsdh
794 followers · 35 posts · Server hcommons.social
How can data visualisations be used for storytelling?
Elliot Bentley @ejb joins us for a talk about @datawrapper with our data journalism MA students:
https://www.datawrapper.de/
#dataviz #datastorytelling #datajournalism #ddj #london
#dataviz #datastorytelling #datajournalism #ddj #london

Kat Greenbrook · @KatGreenbrook
7 followers · 4 posts · Server mastodon.nz
Humanity is ageing 👵 👴
We're living longer and having fewer children. But what does this mean for governments and communities that support and care for older people? What will it mean for New Zealand?
You can check out the full #infographic here: https://www.roguepenguin.co.nz/humanityisageing
#datastorytelling #aiart #newzealand #government #communication
#infographic #datastorytelling #aiart #newzealand #government #communication

Xebia Data · @xebiadata
1 followers · 2 posts · Server mastodon.socialExciting news!
Join us at #GoDataFest, a 3-day conference in Amsterdam that covers the latest and greatest in data-driven organizations, analytics engineering, data storytelling and visualization, and much more!
This is a great opportunity to learn from experts, network with peers, and deepen your understanding of the data industry.
And the best part? It's completely free.
Register now at https://godatafest.com.
#godatafest #analyticsengineering #datastorytelling #datavisualization

· @dehypotheses
1094 followers · 91 posts · Server fedihum.org
Ein Tag im Leben eines Deutschen in #Paris 1854: Mareike König zeigt in unserem neuen #Slider, dass #DataFiction eine Option ist, um sprödes Datenmaterial einprägsam aufzubereiten
https://19jhdhip.hypotheses.org/5274
Grundlage ist die Datenbank "Adressbuch der Deutschen in Paris von 1854" des Deutschen Historischen Instituts Paris und des Instituts für Digital Humanities der Universität Köln.
#DataStorytelling #DigitalHumanities #DataFiction #DigitalHistory
#paris #slider #datafiction #datastorytelling #DigitalHumanities #digitalhistory