PastelBio · @pastelbio
181 followers · 2170 posts · Server mstdn.scienceRT @EBItraining: Applications are open for our introductory #multiomics course on #dataintegration and #datavisualisation.
The course will highlight the challenges in integrating multi-omics data sets using biological examples.
Apply before 26 November 2023: https://www.ebi.ac.uk/training/events/introduction-multiomics-data-integration-and-visualisation-0/
#multiomics #dataintegration #datavisualisation
d'aïeux et d'ailleurs · @daieuxetdailleurs
532 followers · 1263 posts · Server framapiaf.org[#dataviz] Quelques #statistiques d'activité des services d'#archives départementales en France, de 1975 à 2021 (Patrimoine et numérique) : volume conservé, nombre d'agents et fréquentation du public (physique)
>
https://patrimoine-et-numerique.fr/data-visualisations/75-statistiques-des-archives-en-france
D'après les rapports annuels PDF de #francearchives et les données 2019-2021 en #opendata sur #dataculture, avec un retour vers le futur en 2012 (poke @jordi )
#datavisualisation #wikidata #archivesdepartementales #culture
Poke @archivistodon
#culture #archivesdepartementales #wikidata #datavisualisation #DataCulture #opendata #francearchives #archives #statistiques #dataviz
Will Deakin · @wnd
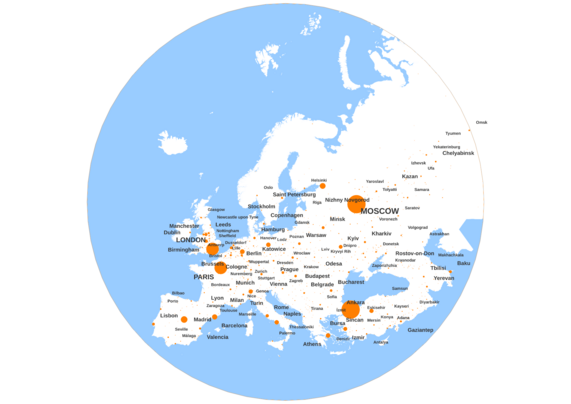
70 followers · 238 posts · Server fosstodon.orgFor those interested in such things, the urban* population in "Europe" between 500k and 15M. Text and circle diameter as a function of population. Using EC Global Human Settlement Layer (#GHSL) data here https://ghsl.jrc.ec.europa.eu/
The definition of Europe is a bit fuzzy but is approximately bounded by the Ural mountains to the East
All caps text > 5M population
A cool resource with an definition of urban that I'd steal
#DataVisualisation #Population #Europe
#GHSL #datavisualisation #population #europe
David Mason · @dn_mason
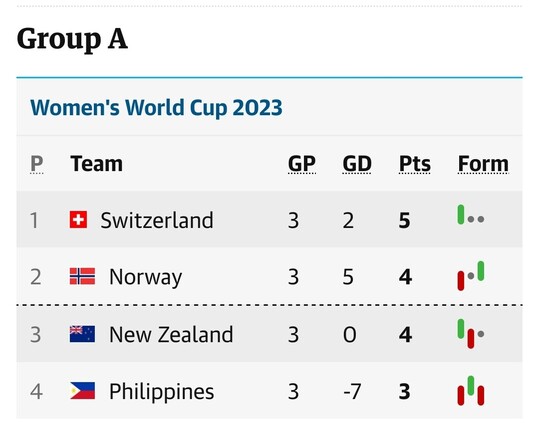
192 followers · 180 posts · Server mas.toCan we just take a moment to appreciate the really nice #DataVisualisation in the #Football #WorldCup standings on the Guardian newspaper website.
+ Clear at a glance
+ No more ink than needed
+ Works even if you cannot differentiate red and green
+ not replicating other info in the table
Nicely done!
#worldcup #football #datavisualisation
· @emauviere
88 followers · 20 posts · Server mapstodon.space📊 Le nouveau #vizAgreste traite en cartes animées et en graphiques d’un sujet d’actualité en cette période estivale : la transhumance saisonnière des troupeaux vers des surfaces pastorales collectives.
Ce 10e récit graphique s’appuie sur des données inédites, et met en évidence une spécificité pyrénéenne, comparée aux autres massifs et zones de plaine concernées par la transhumance collective.
👉 https://vizagreste.agriculture.gouv.fr/la-transhumance-collective.html
#datavisualisation #datastorytelling #cartesdeflux
#vizagreste #datavisualisation #datastorytelling #cartesdeflux
Will Deakin · @wnd
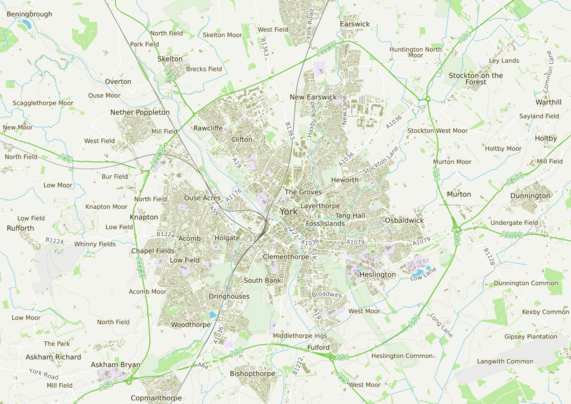
47 followers · 184 posts · Server fosstodon.orgFor those who are interested in such things, I downloaded the Ordnance Survey Zoomstack data which (I think) is under the #OpenGovernmentLicense, wrote some #python #GeoPandas to cut out 10x10km (100km²) squares centred on the railway stations at York and Sheffield, and had a play with some of the OS #QGIS style sheets from here: https://github.com/OrdnanceSurvey/OS-Open-Zoomstack-Stylesheets
I thinks it's a touch Visage (as in "Fades to Grey") but it's not too bad for a few hours to pull these #DataVisualisation examples
#opengovernmentlicense #python #Geopandas #qgis #datavisualisation
Deepali Kank · @deepali
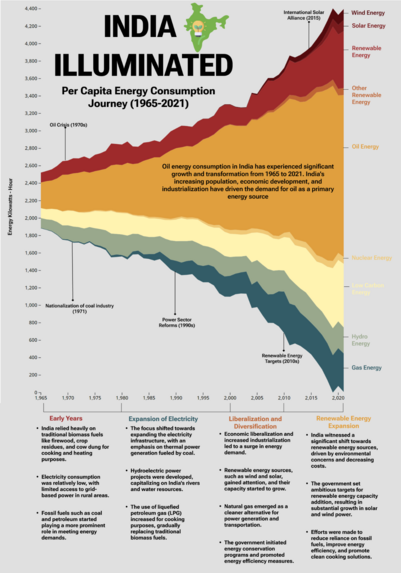
121 followers · 102 posts · Server fosstodon.orgDid a bit of editing and created this infographic. #TidyTuesday
#datavisualisation #datastorytelling #india #energyconsumption
#tidytuesday #datavisualisation #datastorytelling #india #energyconsumption
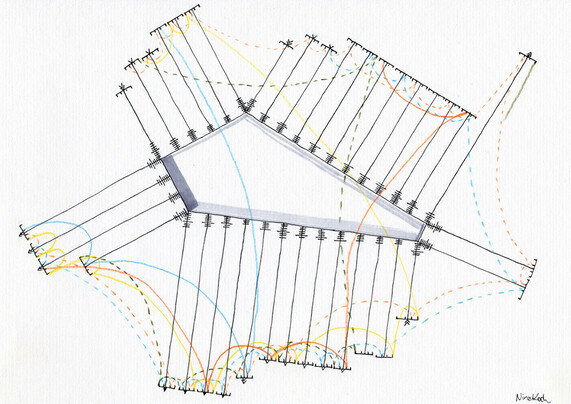
Nina · @nk_yeahyeah
17 followers · 10 posts · Server norden.socialOur power consumption: The 2nd part of my final project for the "Analog Data Visualization for Storytelling" course on domestika
by @stefpos – I just had too much data. 😅
#datadrawing #dataviz #datavisualization #datavisualisation #powerconsumption #energyconsumption
#datadrawing #dataviz #datavisualization #datavisualisation #powerconsumption #energyconsumption
T. from Data Rocks · @datarocksnz
8 followers · 4 posts · Server me.dmCurious about the creative side of data visualisation?
Data Sketches by Nadieh Bremer & Shirley Wu is a book that beautifully blends data and design. Their gorgeous, carefully crafted data visualisations are a feast to the eyes!
Learn more about the book and my learnings from it here: https://cutt.ly/data-sketches
#datavis #dataviz #datavisualisation #datavisualization #vis.social #informationdesign #dataart #DataSketches
#datavis #dataviz #datavisualisation #datavisualization #vis #informationdesign #dataart #datasketches
Xisca (she/her) · @xisca
35 followers · 817 posts · Server mastodon.auCool exercise in data visualisation that had me (dare I say) excited about thinking about tax for the 5min or so it took me to read it. Which is a lot longer than I'm normally excited about tax.
https://www.abc.net.au/news/2023-04-28/stage-three-tax-cuts-to-scale/102268304
#tax #dataviz #datavisualisation #design #infodesign #auspol
#tax #dataviz #datavisualisation #design #infodesign #auspol
Franziska Köppe | madiko · @madiko
388 followers · 1574 posts · Server mastodon.greenOh schaut mal, die tolle Karte von Benjamin Td (https://benmaps.fr) habe ich gerade bei Christian aka @jawl entdeckt:
https://www.chronotrains.com/de?zoom=7.7&lng=9.73&lat=49.29&stationId=8000096
Sie zeigt, wie weit man binnen fünf Stunden mit dem Zug von einem beliebigen europäischen Bahnhof aus fahren kann.
#Bahnreise #Mobilität #ÖffentlicherNahverkehr #ÖPNV #OpenData #DataViz #DataVisualisation
#Bahnreise #mobilitat #offentlichernahverkehr #opnv #opendata #dataviz #datavisualisation
Natacha Bardy · @NKBardy
23 followers · 11 posts · Server social.sciences.re[Teacher looking for English-language sources of dataviz]
Collègues d’anglais, de géographie, de SES (et j’en oublie), et amateurs de #dataviz #datavisualisation en général:
Je cherche des sources d’infographies, cartes et autres diagrammes en anglais pour mes cours. Avez-vous des sources préférées ? Des (contre-)recommandations ?
Will Deakin · @wnd
41 followers · 135 posts · Server fosstodon.orgFor those interest in such things, here (https://github.com/anisotropi4/magpie) are is a script that download Open Street Map (OSM) tagged "railway" data within Great Britain using the OverPass API (http://overpass-api.de), the OSMNX (https://osmnx.readthedocs.io) python library and @geopandas.
A recent GeoJSON and GeoPKG cut is here https://github.com/anisotropi4/magpie/raw/master/great-britain-rail.geojson?raw=true and here https://github.com/anisotropi4/magpie/raw/master/great-britain-rail.geojson?raw=true
#python #rail #osm #datavisualisation
Will Deakin · @wnd
41 followers · 134 posts · Server fosstodon.orgFor those interest in such things, here (https://github.com/anisotropi4/jay) are a bundle of helper scripts that download dependencies and simplify all layers in a given projected GeoPackage geography file using #pygrio, @geopandas and #mapshaper.
#pygrio #mapshaper #python #node #datavisualisation
Nigel Hawtin · @nigelhawtin
214 followers · 125 posts · Server vis.socialLooking back at #infographics from 10 years ago... http://nigelhawtin.com/10-years-ago/ #scicomm winter/spring #Science round up of #datavisualisation including #climate #maps #health #biology #astronomy #nature
#nature #astronomy #biology #health #maps #climate #datavisualisation #science #scicomm #infographics
Cédric Scherer · @CedScherer
1869 followers · 125 posts · Server vis.socialMy first Nightingale blog post, talking about the start and evolution of our annual #dataviz challenge #30DayChartChallenge during April 🎉
https://nightingaledvs.com/the-30daychartchallenge-year-three/
30 days, 30 charts, 5 categories 📈
The 3rd edition starts in 4⃣ days!
#datavisualization #datavis #datavisualisation #30DayChartChallenge #dataviz
Professor Kerstin Sailer · @kerstinsailer
752 followers · 539 posts · Server sciences.socialUjuBib · @UjuBib
368 followers · 4855 posts · Server mamot.frRT @mshlyon
La #datavisualisation sous le regard des SIC : production, réception, capacitation. Journée d'étude organisée par le laboratoire #ELICO à #Lyon + distanciel #recherche #shs #data >> http://www.msh-lse.fr/agenda/la-datavisualisation-sous-le-regard-des-sic/ cc @univ_lyon2 @Univ_St_Etienne @UCLouvain_be
#datavisualisation #ELICO #lyon #recherche #shs #data
Nigel Hawtin · @nigelhawtin
212 followers · 119 posts · Server vis.socialExcellent #scrollytelling #visualisation work by The Straits Times looking at the changes in Singapore’s climate https://www.straitstimes.com/multimedia/graphics/2023/03/singapore-getting-hotter-temperature-data/index.html?shell #climatechange #scicomm #datavisualisation #infographic
#infographic #datavisualisation #scicomm #climatechange #visualisation #scrollytelling
Dan Robotham · @djrobotham
83 followers · 135 posts · Server maly.ioDoes anyone know of any good 'data visualisations' of health data - that are easily understandable to a lay audience and convey something useful, that could be used for free (e.g., those in public domain)?
#dataviz #datavisualisation #health #research #science

