
Lace Padilla · @lace
615 followers · 28 posts · Server vis.socialPassionate about #DataVisualization and considering a Ph.D. in CS or PSY? Dive into this list of exciting open positions – including one with me! Check it out and spread the word! 📊🎓 #PhDPositions #FutureResearchers #TechTuesday https://vis-phd-positions.netlify.app
#techtuesday #futureresearchers #phdpositions #datavisualization
Lace Padilla · @lace
615 followers · 28 posts · Server vis.socialPassionate about #DataVisualization and considering a Ph.D. in CS or PSY? Dive into this list of exciting open positions – including one with me! Check it out and RT to spread the word! 📊🎓 #PhDPositions #FutureResearchers #TechTuesday https://vis-phd-positions.netlify.app
#techtuesday #futureresearchers #phdpositions #datavisualization

Bob Belderbos · @bbelderbos
411 followers · 398 posts · Server fosstodon.orgEvery wondered how to make plots in the terminal? 💡 😎
Plotext (PyPI) makes this a breeze. Here is a quick demo where I use it to plot PyBites Platform growth over the years 📈
https://youtu.be/CA6voSE5Ki0?si=avLrIQIbQhUWOFaN
#Python #plotext #dataviz #DataVisualization #terminal #plotting #django
#python #plotext #dataviz #datavisualization #terminal #plotting #django

Hernán De Angelis · @hdeangelis
0 followers · 2 posts · Server mstdn.socialGeologist & physical geographer. Works with data analysis, data management and visualization within spatial data, GIS, remote sensing, metadata. Happy outside in Nature.
Likes #geoscience #environmentalscience #remotesensing #gis #FOSS #dataanalysis #geospatial #copernicus #OpenStreetMap #grassgis #qgis #GenericMappingTools #perl #python #gnuplot #imagemagick #spatial #OpenSource #openscience #datamanagement #datavisualization #Linux #amateurastronomy #running #cycling
#presentation #Cycling #Running #amateurastronomy #Linux #datavisualization #datamanagement #openscience #OpenSource #spatial #imagemagick #gnuplot #Python #perl #genericmappingtools #qgis #grassgis #OpenStreetMap #copernicus #geospatial #dataanalysis #FOSS #gis #remotesensing #environmentalscience #geoscience
Hernán De Angelis · @hdeangelis
0 followers · 1 posts · Server mstdn.socialGeolog & naturgeograf. Arbetar med dataanalys, informationshantering och visualisering inom geodata, gis, fjärranalys, metadata. Gärna ute i naturen på fritiden.
Gillar #geoscience #environmentalscience #remotesensing #gis #FOSS #dataanalysis #geospatial #copernicus #OpenStreetMap #grassgis #qgis #GenericMappingTools #perl #python #gnuplot #imagemagick #spatial #OpenSource #openscience #datavisualization #Linux #amateurastronomy #running #cycling
#presentation #Cycling #Running #amateurastronomy #Linux #datavisualization #openscience #OpenSource #spatial #imagemagick #gnuplot #Python #perl #genericmappingtools #qgis #grassgis #OpenStreetMap #copernicus #geospatial #dataanalysis #FOSS #gis #remotesensing #environmentalscience #geoscience

Rami Krispin :unverified: · @ramikrispin
1034 followers · 537 posts · Server mstdn.social
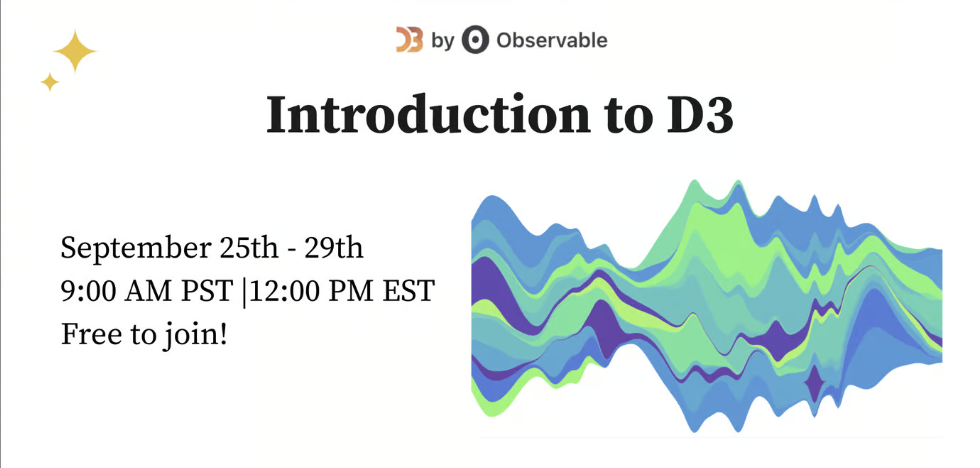
Introduction to D3 course ❤️
If you are looking for a resource for learning #d3 check the upcoming crash course Introduction to D3 by Paul Buffa. D3 is one of the leading frameworks for interactive data visualization on the web. This five-part course focuses on:
✅ D3 & Web-Based Data Visualization
✅ Scatterplots
✅ Lines charts and Bar charts
✅ General Update Pattern
✅ Thinking in D3
More details are available here 👇🏼
https://observablehq.com/@observablehq/introduction-to-d3-course
#JavaScript #DataScience #datavisualization #dataviz #d3

Earthworm · @earthworm
505 followers · 1932 posts · Server kolektiva.social
Spot on!
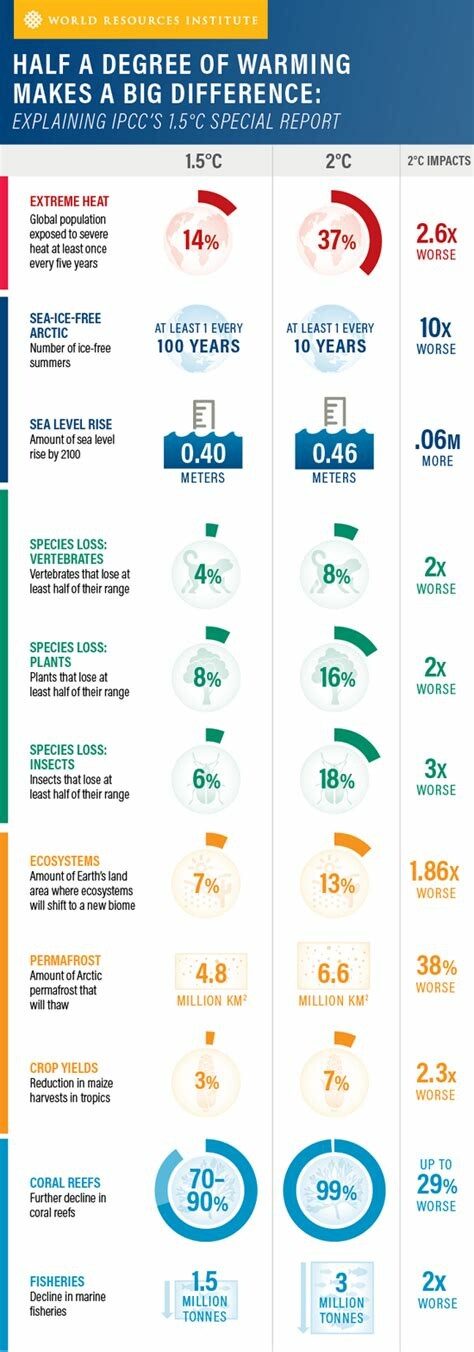
It is very important to communicate scientific findings about global change in appealing ways.
Our usual habit of just publishing in b/w bar graphs probably didn't help to make the wider society aware of the extent of the situation.
Not exactly the interactions of factors you asked for, but can't resist mentioning this figure of the World Resource Institute, comparing the consequences of a 1.5 vs 2° C world.
https://www.wri.org/insights/2023-ipcc-ar6-synthesis-report-climate-change-findings
@s4f <- anyone has other good examples for the visualization of global change?
#sciComm #DataVisualization #GlobalChange #ScienceEducation #ScienceCommunication
#scicomm #datavisualization #globalchange #scienceeducation #ScienceCommunication

Leah Brown · @leahdriel
664 followers · 1055 posts · Server fediscience.org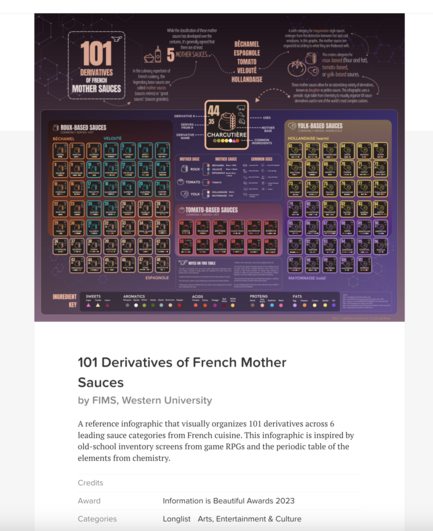
I'm thrilled my infographic "101 Derivatives of French Mother Sauces" made the longlist for the category "Arts, Entertainment & Culture" on the 2023 Information Is Beautiful Awards! I don't think it will make the shortlist as it's pretty competitive, we're competing against individuals, teams, studios and even agencies from orgs like Reuters, USA Today, MIT, and Harvard Engineering.
#dataVisualization #informationDesign #infographicDesign #informationArchitecture
#informationarchitecture #infographicdesign #informationdesign #datavisualization

R-Ladies Rome · @rladiesrome
19 followers · 35 posts · Server fosstodon.org
Next Event for @rladiesrome
RSVP: https://meetup.com/rladies-rome/events/295720243/
When: September 22, 2023 at 6:00 PM CET / 12:00 PM EDT
We will be working outside of the library box diving in to the very basic R functions toward the path of mastering the R programming language for data analysis.
#rstats #rladies #datascience #dataanalysis #datavisualization #datamodeling #modeling #wrangling #R #RStudio #Posit
#rstats #rladies #datascience #dataanalysis #datavisualization #datamodeling #modeling #wrangling #r #rstudio #posit

Di · @didoesdigital
191 followers · 26 posts · Server bne.socialVisualisation annotations are useful for directing readers towards insights and unusual data points. And yet there aren’t a lot of examples of how to make them programmatically for changing, interactive visualisations.
So I wrote about the approach I cobbled together for my recent snakes vis, which I hope ends up being useful to someone else:
https://observablehq.com/@didoesdigital/annotations-using-paths-and-markers
#dataviz #datavisualization #svg #d3

Will Deakin · @wnd
70 followers · 238 posts · Server fosstodon.orgFor those interested in such things, here is a visualisation of the England and Wales 2011 travel-to-work MSOA census data by transport mode https://anisotropi4.github.io/local-flow/
I wonder when the 2021 data will be made available
#travel #datavisualization #2011census

Steven P. Sanderson II, MPH · @stevensanderson
162 followers · 764 posts · Server mstdn.social
📢 Exciting news! Learn to visualize categorical data in R with these engaging charts:
1️⃣ Barplots with ggplot2's geom_bar()
2️⃣ Grouped boxplots with base R and ggplot2
3️⃣ Mosaic plots
🔍 Check out the guide here: https://www.spsanderson.com/steveondata/posts/2023-08-29/
🔬 Experiment with your own data and uncover valuable insights!
#ggplot2 #visualization #r #RStats #datavisualization

Timothy Shortell · @brooklynsoc
556 followers · 1485 posts · Server sciences.socialFirst class meeting of the semester is finished! I'm teaching an introductory course in a graduate data analysis and visualization program. It is going to be a fun semester. Students are interested in a lot of different topics. #DataAnalysis #DataVisualization #Python
#dataanalysis #datavisualization #python
Will Deakin · @wnd
63 followers · 230 posts · Server fosstodon.org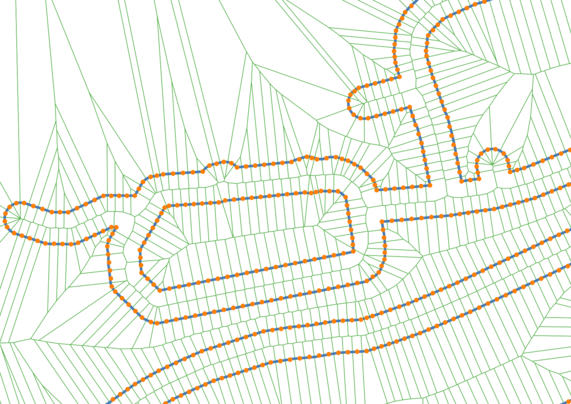
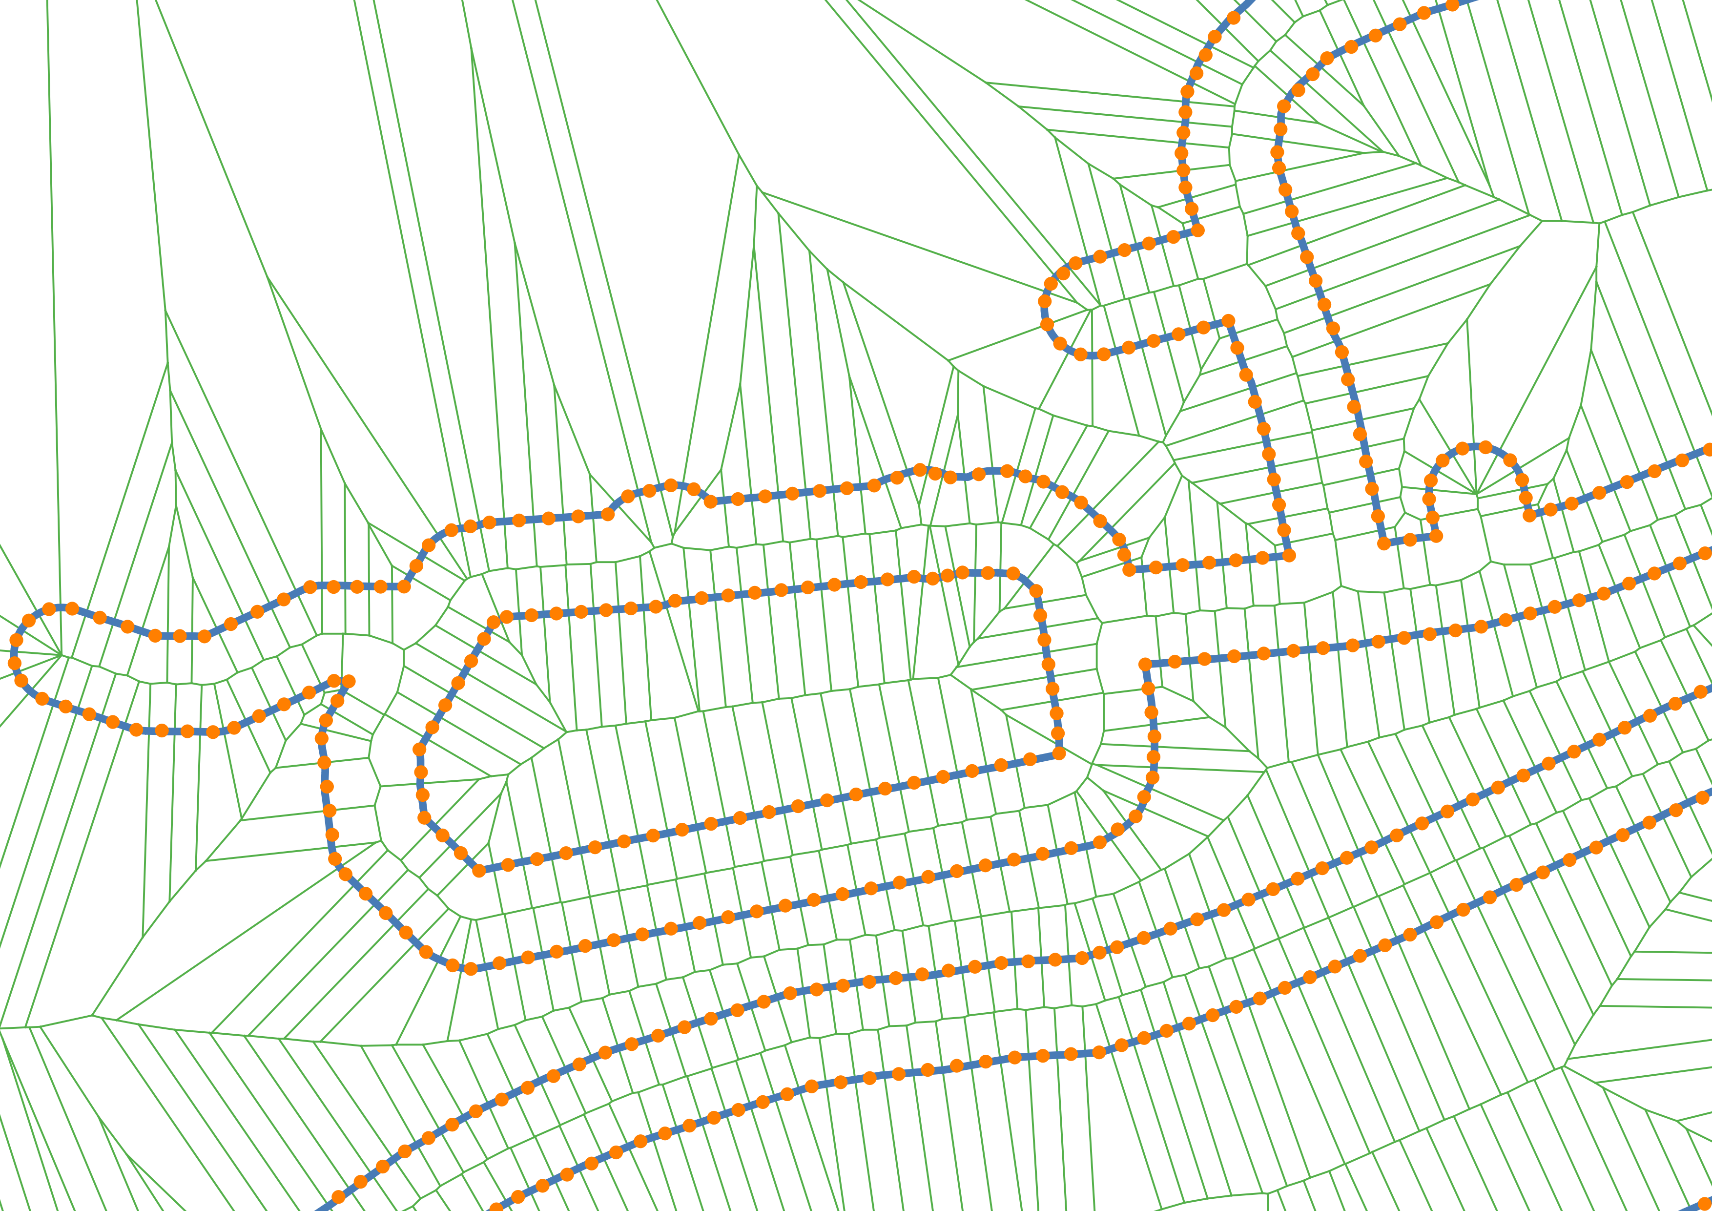
The Voronoi simplification is by segmenting buffer lines into equal sections, identifying segment end-points, calculating the Voronoi polygons, and identify the centre-line
#datavisualization #network #gis #roadmap
Will Deakin · @wnd
60 followers · 228 posts · Server fosstodon.org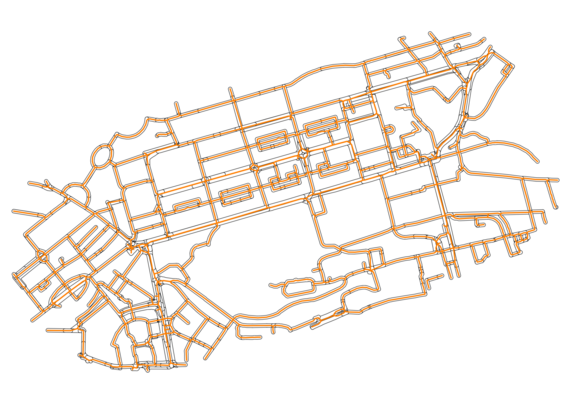
As a follow up from yesterday's post about network simplification, here is an approach based on Voronoi polygon to create the simplified network

Frank Hänel · @frankhaenel
14 followers · 28 posts · Server fosstodon.org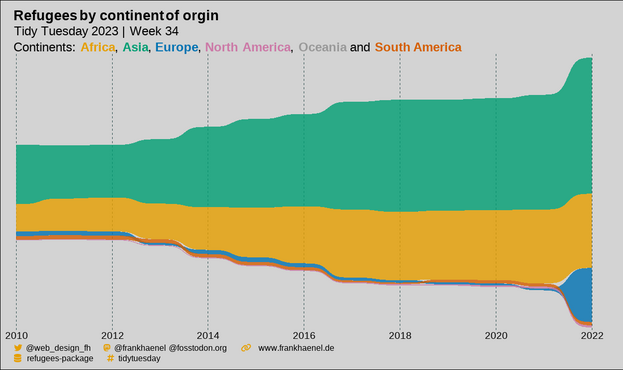
🌍 #TidyTuesday Week 34: Exploring Refugee Flows 📊✨ Visualizing movement across continents from 2010 to 2022. An insightful Sankey diagram shedding light on global dynamics.
🔗code: https://frankhaenel.de/tidytuesday/2023/week_34.html
#DataVisualization #Refugees #dataviz #rstats #r4ds #DataAnalysis 🗺️🔍
#tidytuesday #datavisualization #refugees #dataviz #rstats #r4ds #dataanalysis
Will Deakin · @wnd
60 followers · 228 posts · Server fosstodon.org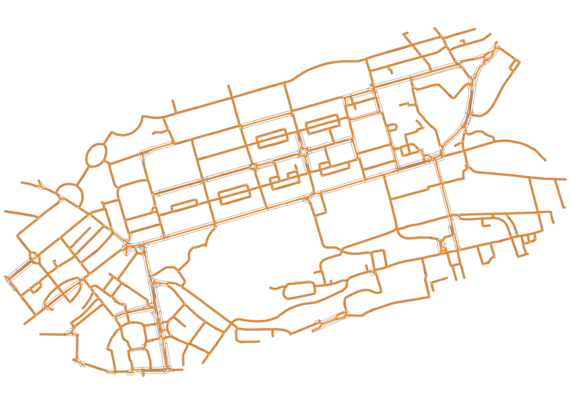
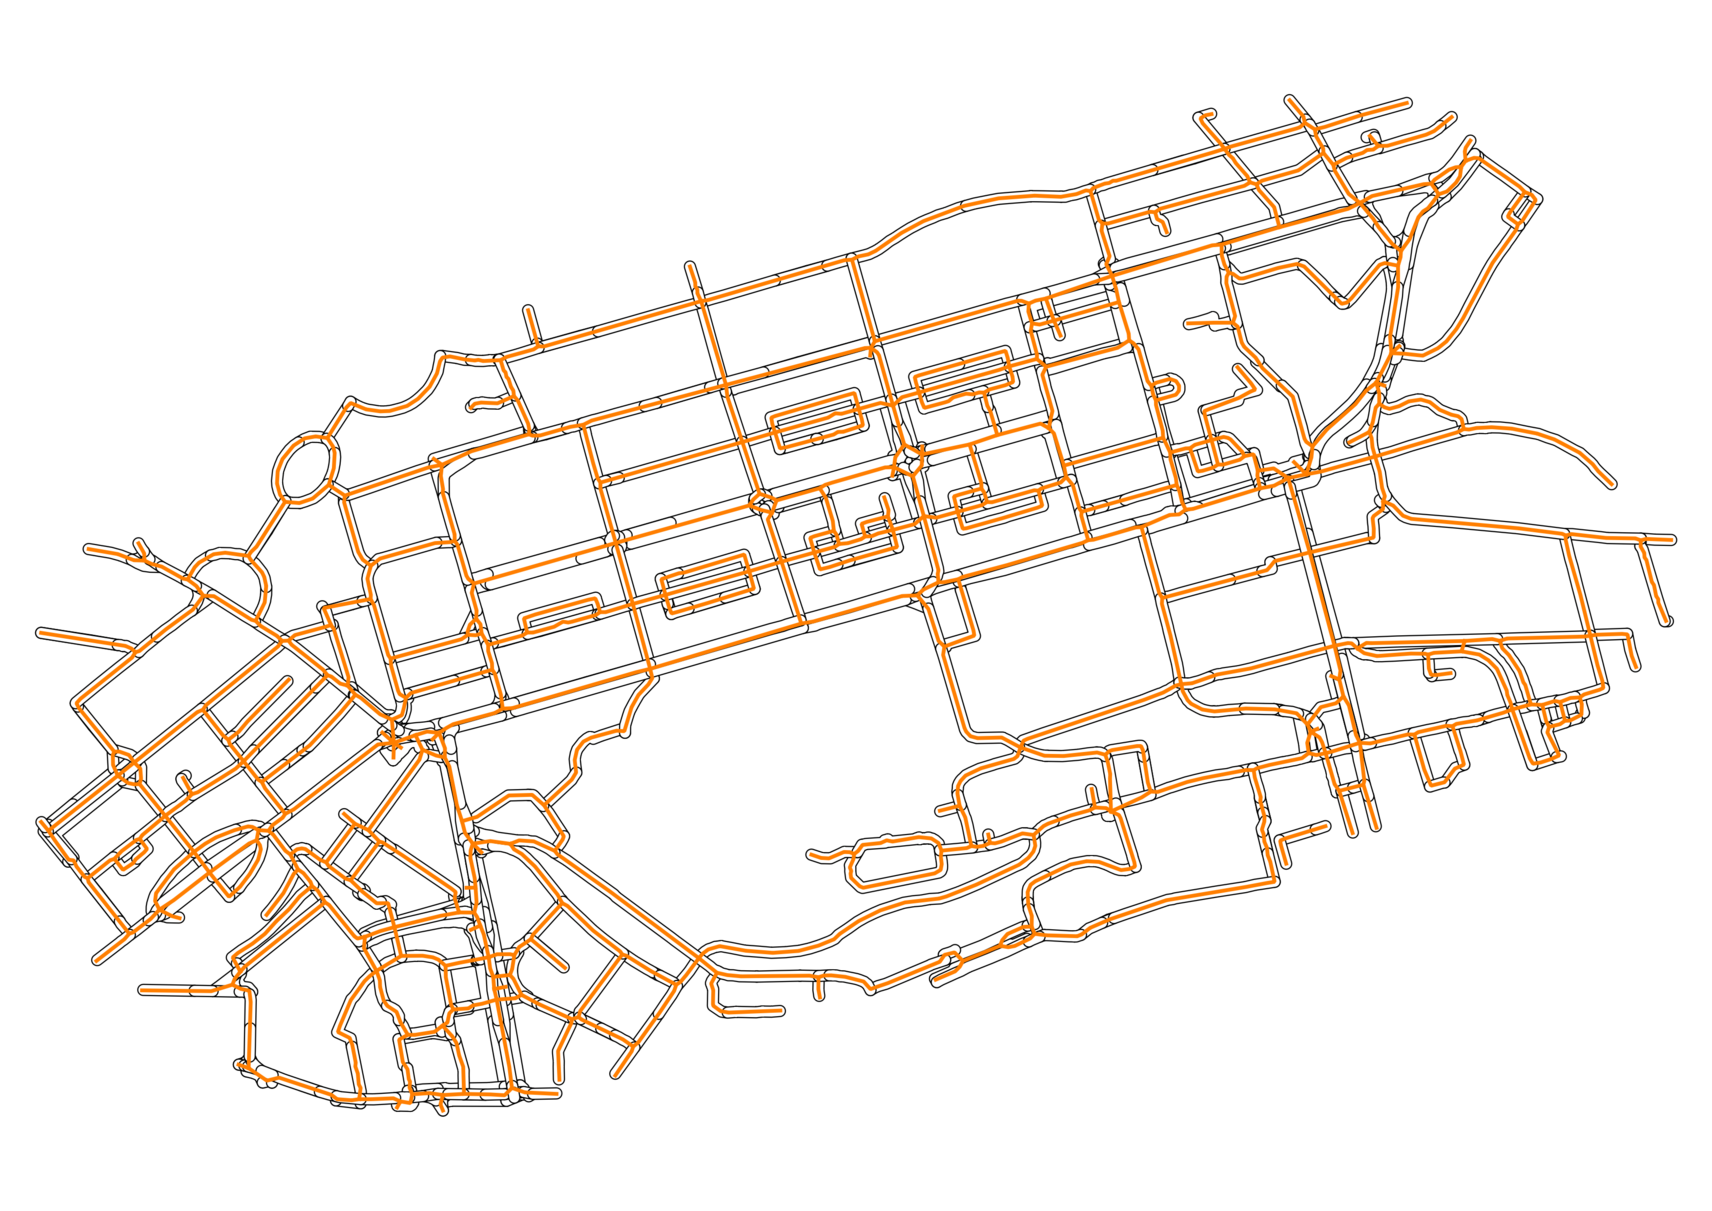
For those interested in such things, I have been thinking about network simplification
While there are standard vector polygon aggregation approaches, there would appear to be fewer for line vector
Here is an approach that uses skeletonization of a raster buffer to aggregate lines https://github.com/anisotropi4/arctic-tern
Example Edinburgh Princes Street with a simplified, primal and extended network
Currently lines are frizzy and will require post processing
#datavisualization #network #simplification
Rami Krispin :unverified: · @ramikrispin
1013 followers · 516 posts · Server mstdn.social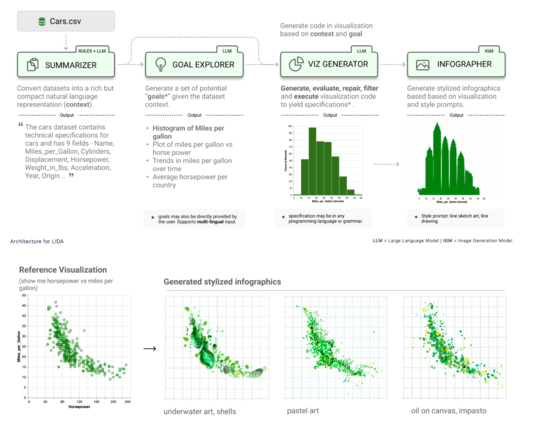
Automatic Generation of Visualizations and Infographics with LLMs 🚀🚀🚀
Microsoft released this cool application for creating data visualization with a language model - LIDA. The tool enables the creation of data visualization with the use of prompts. Demo available here 👇
➡ Installation:
pip install lida
Resources 📚
Documenation: https://microsoft.github.io/lida/
Code: https://github.com/microsoft/lida
#datavisualization #dataviz #DataScience #LLM

Alessio Pomaro · @alessiopomaro
93 followers · 664 posts · Server mastodon.uno📊 Microsoft presenta #Python in #Excel: un engine per l'analisi dei dati integrato direttamente nel foglio di calcolo.
🧠 Per piccole analisi e per la visualizzazione dei dati si tratta di uno strumento potente e a disposizione di tutti.
#python #excel #ai #machinelearning #dataanalysis #datavisualization

Francesca · @framoriniii
97 followers · 73 posts · Server vis.social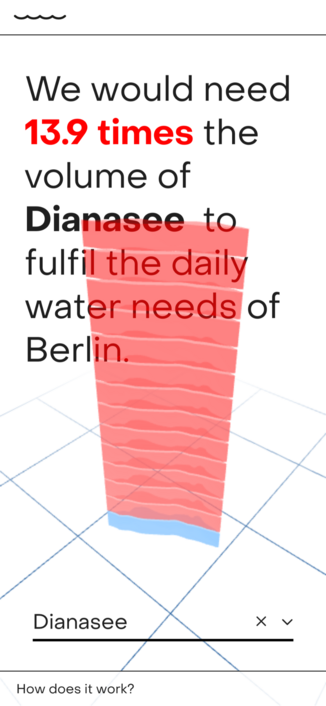
Working with some colleagues on a simple project to showing Berlin's water consumption as the local lakes capacity overshoot. Will post a demo soon and ask for feedback! #Threejs #datavisualization