Ry · @ryancee
29 followers · 65 posts · Server infosec.exchangeDay number 2 back at the coalface.....
Too early to want to curl into a fetal position and hope it all goes away?
Data, lots and lots of unformatted data to check for nasties, unpack, preprocess, process and then ingest......whilst trying not to run out of disk space or the will to live.
Please make it stop!
#developerhell #data #datavizualisation
Matt Eland · @IntegerMan
130 followers · 75 posts · Server techhub.socialThe new course in my master's program for January 2nd just unlocked on Canvas. This will be the midway marker for my degree and will result in a graduate certificate in data analytics at the end of this particular course. We're covering data visualization and reporting with Tableau, though I'm going to try to do some of it with permission in Power BI.
#datavis #datavizualisation #graduateschool #tableau #powerbi
#datavis #datavizualisation #graduateschool #tableau #powerbi
Hylke Rozema · @hylk3
18 followers · 24 posts · Server mastodon.nl:python: :kubernetes: :gitlab: Yihaa! Just finished a succesfull meeting pitching a dashboard with steering information instead of a monthly set of excell to be ploughed through by the management team! #datavizualisation #python #EBS #OracleAnalyticsServer
#oracleanalyticsserver #EBS #python #datavizualisation
· @caroubier
7 followers · 45 posts · Server mastodon.zaclys.comHey you guys,
Dear colleagues, I look for open source solutions to make pies, charts, from ElasticSearch data. I will test Grafana. What alternatives do you suggest? Thank you for your help. Cheers.
#datavizualisation #digipress #ES #Json #ElasticSearch #digitalhumanity
#digitalhumanity #elasticsearch #json #es #digipress #datavizualisation
∆ SAMEPERIODLASTTIME · @4V35
0 followers · 10 posts · Server social.tchncs.de∆ SAMEPERIODLASTTIME · @4V35
0 followers · 11 posts · Server social.tchncs.de· @caroubier
7 followers · 33 posts · Server mastodon.zaclys.comSalut a toutes et tous,
Qu'utilisez vous pour représenter en camembert, diagrammes ou autres des résultats de requêtes depuis des donnés d'ElasticSearch? Je cherche une solution directe sans passer par une extraction puis copier-coller vers une appli qui fait des graphiques...
Merci par avance.
#digitalhumanity #digipres #ElasticSearch #json #datavizualisation
#datavizualisation #json #elasticsearch #digipres #digitalhumanity
Nicola Rennie · @nrennie
841 followers · 110 posts · Server fosstodon.orgA simple plot for this week's #TidyTuesday hiding lots of messy data wrangling in the background! I calculated the change in estimated number of open museums in areas with different levels of deprivation 🏛️🏛️🏛️
Code: https://github.com/nrennie/tidytuesday/tree/main/2022/2022-11-22
#RStats #R4DS #DataViz #DataVisualisation #DataVizualisation
#tidytuesday #rstats #r4ds #dataviz #datavisualisation #datavizualisation
Nicola Rennie · @nrennie
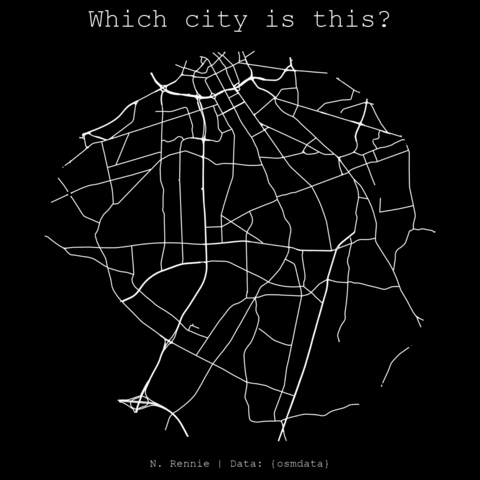
841 followers · 110 posts · Server fosstodon.orgFor the "minimal" prompt on #Day16 of the #30DayMapChallenge, can you guess which city this is just from the road network around it?
Code: https://github.com/nrennie/30DayMapChallenge/blob/main/2022/scripts/16_minimal.R
#RStats #15MinuteMaps #DataViz #DataVisualisation #DataVizualisation #Mapstodon #Maps
#day16 #30DayMapChallenge #rstats #15MinuteMaps #dataviz #datavisualisation #datavizualisation #mapstodon #maps
Nicola Rennie · @nrennie
841 followers · 110 posts · Server fosstodon.orgA thread about this week’s #TidyTuesday data on page metrics: recreating graphics using #RStats and detecting changes in time series data! To start off with, for this week’s data about page metrics, I recreated the graphic in this article [https://blog.datawrapper.de/why-web-pages-can-have-a-size-problem/](https://blog.datawrapper.de/why-web-pages-can-have-a-size-problem/) 🧵
#DataViz #R4DS #DataVisualisation #DataVizualisation #Statistics
#tidytuesday #rstats #dataviz #r4ds #datavisualisation #datavizualisation #statistics
Nicola Rennie · @nrennie
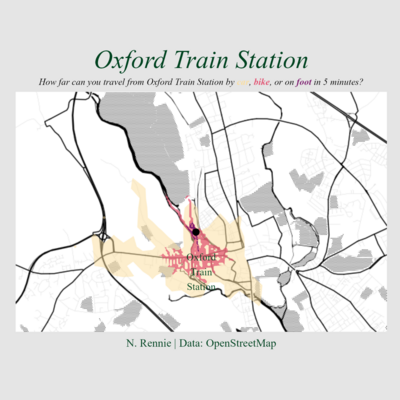
640 followers · 73 posts · Server fosstodon.orgIt's #Day13 of the #30DayMapChallenge and the theme is "5 minutes" - so how far can you get from Oxford Train Station in 5 minutes?
Code: https://github.com/nrennie/30DayMapChallenge/blob/main/2022/scripts/13_five_minutes.R
#RStats #15MinuteMaps #DataViz #Mapstodon #DataVisualisation #DataVizualisation #Spatial
#day13 #30DayMapChallenge #rstats #15MinuteMaps #dataviz #mapstodon #datavisualisation #datavizualisation #spatial
Nicola Rennie · @nrennie
640 followers · 73 posts · Server fosstodon.orgInspired by Calle Börstell to make something akin to radio dials for this week's #TidyTuesday dataset on radio stations in the USA!
Thanks to Frank Hull and Erin for the data this week!
Code: https://github.com/nrennie/tidytuesday/tree/main/2022/2022-11-08
#rstats #r4ds #DataViz #DataVisualisation #DataVizualisation
#tidytuesday #rstats #r4ds #dataviz #datavisualisation #datavizualisation
Vikki :verified: · @DataScienceNot2
591 followers · 126 posts · Server tech.lgbt@thegradient Hello! I'm a #DataScientist and #DataVizualisation enthusiast. I'm currently taking part in the #30DayMapChallenge and remastering my undergrad thesis to be a part of my #Data portfolio.
#datascientist #datavizualisation #30DayMapChallenge #data
Nicola Rennie · @nrennie
640 followers · 73 posts · Server fosstodon.orgThe "making of" in #ggplot2 recorded with {camcorder}!
YouTube: https://youtube.com/shorts/Z0b7cZJWSDM
#RStats #DataViz #r4ds #GBBO #DataVisualistion #TidyTuesday #DataScience #DataVizualisation
#ggplot2 #rstats #dataviz #r4ds #gbbo #dataVisualistion #tidytuesday #datascience #datavizualisation
Nicola Rennie · @nrennie
640 followers · 73 posts · Server fosstodon.orgInspired by Cara Thompson
to make some cakes for this week's #TidyTuesday using Great British Bake Off data! 🍰 🍰 🍰 The {bakeoff} R package is awesome!
Code: https://github.com/nrennie/tidytuesday/tree/main/2022/2022-10-25
#RStats #DataViz #r4ds #GBBO #DataVisualistion #ggplot2 #DataScience #DataVizualisation
#tidytuesday #rstats #dataviz #r4ds #gbbo #dataVisualistion #ggplot2 #datascience #datavizualisation
Norore · @Norore
278 followers · 5062 posts · Server social.zdx.frHello, vous vous souvenez de mon sondage sur camembert ou pas camembert ? Je vais vous faire travailler un peu 😅…
Vous préférez les barres ou les camemberts ? Qu’est-ce qui serait le mieux pour ce cas de figure 🤔 ?
#datavisualisation #datavizualisation #help
#datavisualisation #datavizualisation #help
Wolfgang Stief · @stiefkind
367 followers · 2414 posts · Server mastodon.socialNicht nur 2018 war voll mit spontanvagabundierenden Daten: https://informationisbeautiful.net/visualizations/worlds-biggest-data-breaches-hacks/ #datavizualisation
Raf · @Raf
298 followers · 5913 posts · Server mastodon.socialRT @hernandezguell@twitter.com: Course content from the Knight Center for Journalism in the America's massive open online course (MOOC) "Data Visualization for Storytelling and Discovery." #storytelling #datavizualisation
https://journalismcourses.org/data-viz-course-material.html
🐦🔗: https://twitter.com/hernandezguell/status/1033669058821013504
#datavizualisation #storytelling


