Deepali Kank · @deepali
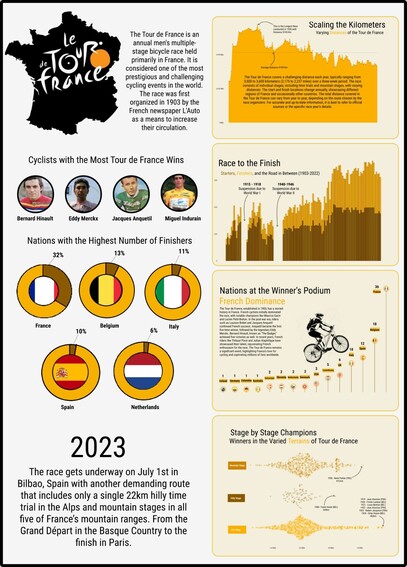
143 followers · 155 posts · Server fosstodon.orgI made an infographic about #TourdeFrance using #rstats and #figma
Code and images: github.com/deepdk/DataViz…
#DataVizualization
#tourdefrance #rstats #figma #datavizualization
chuchudachu · @bloom
45 followers · 252 posts · Server piaille.frHave you ever seen one of the amazing #datavizualization page on the @washingtonpost website?
(You scroll and data are changing, or you can select which data you’d like to see)
So the question: with which programming language is this magic made? #python
Sorry I don’t have any example to show as the url is quite too long for mastodon! 🥲
The Old Map Gallery · @oldmapgallery
1028 followers · 190 posts · Server sciencemastodon.comFrom 1970 a whole layer of organization over the NYC area for absorbing air traffic, huge patches in the air were designed to allow circling plains to wait for a place to land. An interesting visualization for a modern challenge
#maps #map #datavizualization #dataviz #NYC
#maps #map #datavizualization #dataviz #nyc
The Old Map Gallery · @oldmapgallery
946 followers · 171 posts · Server sciencemastodon.comSwitzerland's complex terrain has been a challenge for cartographers for generations. Here, Faden,(c. 1799) mapped the land with amazing detail for terrain as well as towns and roads. #map #maps #cartography #dataviz #datavizualization
#map #maps #cartography #dataviz #datavizualization
Dr. Katie L. Burke · @kburke
423 followers · 411 posts · Server mstdn.socialA #dataviz story:
#DataVizualization #sciart #scicomm
---
RT @ed_hawkins
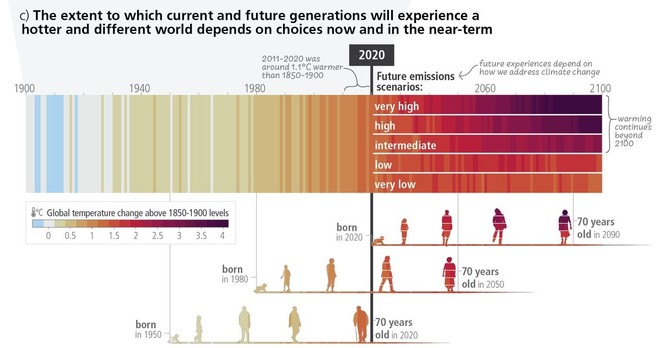
Yesterday the IPCC 6th Assessment published its Synthesis Report (SYR) which included this graphic (SYR.1c) which has been a popular way to discuss future warming in the context of different generations.
What were the inspirations for this graphic?
A thread... 🧵
https://twitter.com/ed_hawkins/status/1638117210303483905
#scicomm #sciart #datavizualization #dataviz
Eric Leung · @erictleung
107 followers · 21 posts · Server mastodon.socialSome amazing tips by @thomas_mock I'll definitely have bookmarked. It includes plenty of #RStats code for making better tables, mostly using the {gt} package, but tips are generalizable to whatever software you use.
#RStats #Tables #DataTables #DataVizualization #DataViz
https://themockup.blog/posts/2020-09-04-10-table-rules-in-r/
#rstats #tables #datatables #datavizualization #dataviz
DatavizAdventure · @Datavizadventure
26 followers · 14 posts · Server vis.socialJob Postings Growth (YoY%) for Top 50 Tech Occupations from 2021 to 2022📈📉
Growth and volume statistics show major increases in postings for engineering, development and data-related roles.
My second collaboration of 2023 is with the incredible Serena, creator of datawits in instagram😁😬
.
.
.
#Dataviz #Datavizualization #Dataisbeautiful #rstudio #Adobe #Graphicdesign #Graphics #Business #Datascience #Tech #Careerchange #Dataanalytics #Jobsearch #Technology #Career #Womenintech #DataVizSociety
#datavizsociety #womenintech #career #technology #jobsearch #dataanalytics #careerchange #tech #datascience #business #graphics #graphicdesign #adobe #rstudio #dataisbeautiful #datavizualization #dataviz
DatavizAdventure · @Datavizadventure
26 followers · 13 posts · Server vis.socialThe most watched Netflix shows in 2022!
My first collaboration of 2023 with
@pocketbizbytes (twitter)
.
.
.
#dataviz #datavizualization #dataisbeautiful #netflix #netflixseries #wednesday #flixpatrol #thecrown #tvshow #r #rstudio #adobe #graphicdesign #graphic #graphicdesigner #NewYear2023
#newyear2023 #graphicdesigner #graphic #graphicdesign #adobe #rstudio #r #tvshow #thecrown #flixpatrol #wednesday #netflixseries #netflix #dataisbeautiful #datavizualization #dataviz
bs2 · @bsmall2
196 followers · 3346 posts · Server mstdn.jpDrRacket 表視覚化 Visualization of Minamata fisheries decline data: https://ruhrspora.de/posts/7295ecf070e9013743b8005056009f8c
#DrRacket #DataVizualization #Minamata #水俣 #データ視覚化
#drracket #datavizualization #水俣 #データ視覚化 #minamata


