Nicolas P. Rougier · @rougier
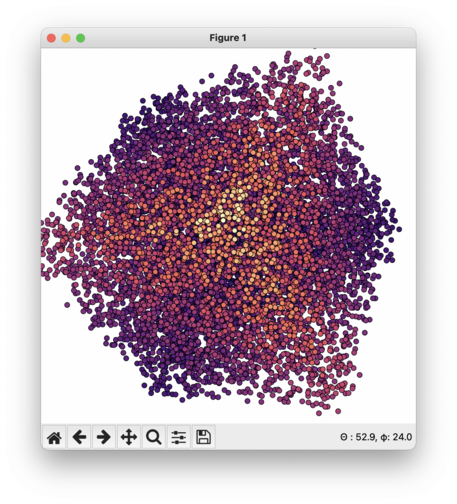
512 followers · 174 posts · Server toot.aquilenet.frWorking on #vispy 2.0: trying to define a graphic server protocol. Here is a first example using the matplotlib backend (10,000 points). The #datoviz (https://datoviz.org/) backend is able to draw 10,000,000 points real-time using same code (https://github.com/vispy/GSP). If interested, drop me an email ( we'll try to organize a workshop this year to discuss different approchaes to #dataviz).
Last updated 3 years ago
