datavis.blog · @datavisblog
10 followers · 6 posts · Server vis.socialDot plots are a space efficient way to compare values within one category split by a second category. This post introduces the chart type and provides an example use case.
https://datavis.blog/2023/02/28/dot-plots-in-tableau/
#Tableau #dotplot

Marc Reid · @marcreid
43 followers · 19 posts · Server vis.social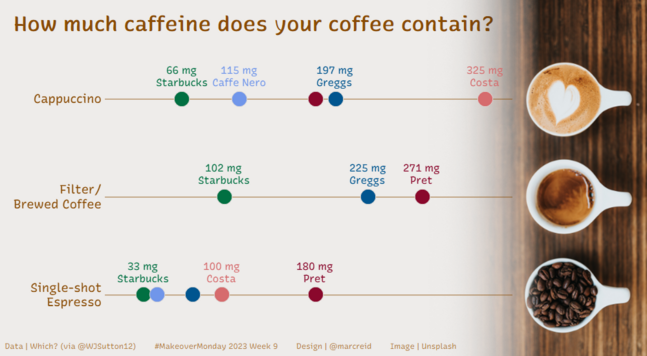
A dot plot for this week's #MakeoverMonday
How much caffeine does your coffee contain?
Data - Which?
Tableau Public -> https://tabsoft.co/3Za7Nhi
#Tableau #dotplot
#dotplot #tableau #makeovermonday

Gene Ontology · @go
182 followers · 109 posts · Server genomic.social
Here's a great #DotPlot showing #GeneOntology terms from van Kuijk et al., with a very nice use of the GO in their new @ESC_Journals #CardiovascularResearch paper!
---
RT @SluimerJudith
But what do they do? Gene ontology suggests common and different functions related to risk factors for cardiovascular disease (lipids, inflammation)
https://twitter.com/SluimerJudith/status/1620743440106651651
#dotplot #GeneOntology #cardiovascularresearch

Ethereum #eth · @ethereum
1140 followers · 43117 posts · Server framapiaf.orgFrom Cointelegraph.com: 3 reasons why Ethereum price can drop below $3K by the end of 2021 https://cointelegraph.com/news/3-reasons-why-ethereum-price-can-drop-below-3k-by-the-end-of-2021 #BearishDivergence #FederalReserve #EthereumPrice #RisingWedge #EtherPrice #Inflation #Ethereum #ETHPrice #Tapering #Stimulus #DotPlot #Ether #ETH #QE
#qe #eth #ether #dotplot #stimulus #tapering #ETHprice #ethereum #inflation #Etherprice #RisingWedge #ethereumprice #federalreserve #BearishDivergence