
Fonti · @fontikar
13 followers · 10 posts · Server fosstodon.org@lukasjung @josi thanks Lukas! I’m going through some chapters in Advanced R and and some vignettes in #dplyr! Will definitely check out your recommendation with #rlang docs :)

François Michonneau · @fmic_
484 followers · 74 posts · Server hachyderm.io
If you are wondering what the future of #databases looks like, you might be interested in this article https://doi.org/10.14778/3603581.3603604
The authors argue that despite increasing specialization, databases share the same components. By relying on standards, you can develop a composable system with:
- your preferred language interface (#SQL, #Ibis, #dplyr, ...). The query is converted into an intermediate representation (like #substrait)
- a query optimizer
- an execution engine
- an execution runtime
#databases #sql #ibis #dplyr #substrait

Olivier Grisel · @ogrisel
1957 followers · 262 posts · Server sigmoid.social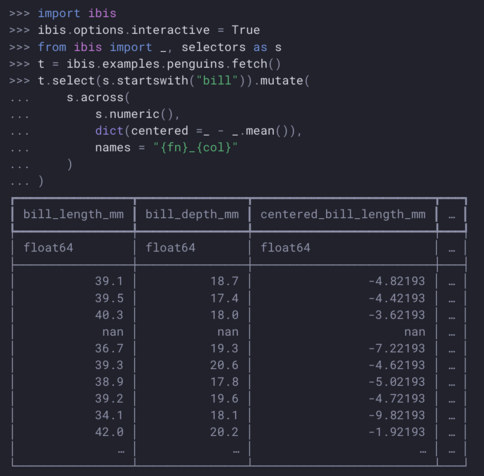
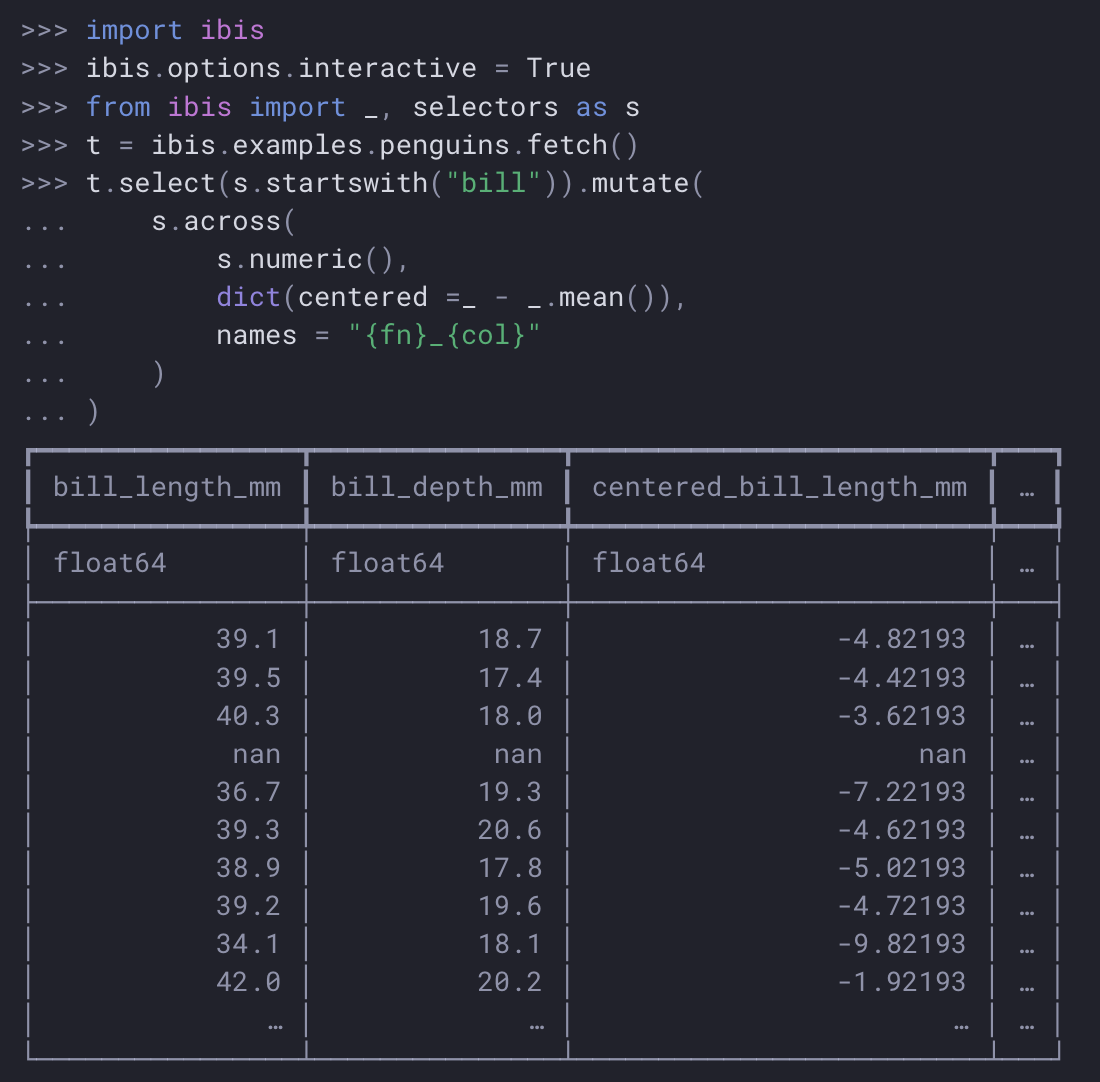
Yesterday I learned at the #EuroScipy2023 #IbisData tutorial that Ibis now offers an implementation of the across function first introduced in #dplyr to conveniently and concisely apply transformations on a set of columns defined by selectors (e.g. based on column data types or name patterns).
This is especially convenient to implement scalable, in-DB feature engineering for machine learning models.
More examples in these blog post:
#euroscipy2023 #ibisdata #dplyr

Steven P. Sanderson II, MPH · @stevensanderson
162 followers · 759 posts · Server mstdn.social
Imagine you have a bunch of data points and you want to know how many belong to different categories. This is where grouped counting comes in. We've got three fantastic methods for you to explore, each with its own flair: **`aggregate()`**, **`dplyr`**, and **`data.table`**.
Happy counting, fellow data explorer! 🎉🔍 #DataAnalysis #RProgramming #ExploreData #dplyr #aggregate #baser #r #rstats #datatable
Post: https://www.spsanderson.com/steveondata/posts/2023-08-10/
#datatable #RStats #r #baser #aggregate #dplyr #exploredata #rprogramming #dataanalysis

Kai 🐈⬛ · @kaio
65 followers · 278 posts · Server fosstodon.org
Marine Mas, PhD · @phdmas
38 followers · 112 posts · Server sciences.social
Steven P. Sanderson II, MPH · @stevensanderson
146 followers · 703 posts · Server mstdn.social
📢 Simplify Data Analysis in R: Easy Summarization Methods! 🚀
Are you an R enthusiast looking to streamline your data analysis? Look no further! Let's explore two fantastic ways to summarize data and gain valuable insights effortlessly! 📊
#DataAnalysis #RStats #DataScience #DataSummarization #SimplifyYourWork #HappyCoding #tapply #r #rstats #dplyr #tibble #summary #opensourcesoftware #opensourcecommunity #technology #innovation
See attached!
Blog Post: https://www.spsanderson.com/steveondata/posts/2023-07-26/
#innovation #Technology #OpenSourceCommunity #opensourcesoftware #summary #tibble #dplyr #r #tapply #HappyCoding #simplifyyourwork #datasummarization #DataScience #RStats #dataanalysis
Steven P. Sanderson II, MPH · @stevensanderson
146 followers · 703 posts · Server mstdn.social
Group percentages in R with #baser #dplyr and #datatable
#R #RStats #opensource
#OpenSource #RStats #r #datatable #dplyr #baser
Steven P. Sanderson II, MPH · @stevensanderson
141 followers · 686 posts · Server mstdn.social
I encourage you to roll up your sleeves and give it a try yourself. 💪🔍
Read the full blog post and start your exploration. Let's dive in and level up your data analysis game! 🚀📊
https://www.spsanderson.com/steveondata/posts/2023-07-17/
#Rprogramming #DataAnalysis #DuplicatesDetection #dplyr #BaseR #DataManipulation
#DataManipulation #baser #dplyr #duplicatesdetection #dataanalysis #rprogramming

Jesse Onland · @jdonland
37 followers · 75 posts · Server vis.socialComputing on a data frame in #dplyr:
One value per row? mutate
One per group? summarize
Anything else: reframe

Sharon Machlis · @smach
2138 followers · 28 posts · Server masto.machlis.com
“Intro to Data Science with R: Unlocking the power of R for public health data science”
New PDF to accompany free video courses by University of Geneva's GRAPH Network. Project supported by WHO.
https://drive.google.com/file/d/1Rw-hdMtlsGRbCF0yA52yQRcLVQ0aVHv9/view
Video courses: https://thegraphcourses.org/courses-portal/
R Foundations, Data Wrangling with dplyr, #DataViz with #ggplot2, Introduction to EpiGraphHub, and Intro to Geospatial Visualization with R
#dataviz #ggplot2 #rstats #rspatial #dplyr

Joshua de la Bruere · @delabj
375 followers · 423 posts · Server fosstodon.orgHey #rstats friends I'm looking at wrapping a typical join in a function in a fairly opinionated way, however, I want to be able to add extra conditions to the by clause. (Sometimes I may have multiple ids while this function handles some work logic ) is there a good way to combine the results of join_by?
Is append? Enquo the arguments? Any help is great

datamaps :rickwhoah: · @datamaps
409 followers · 798 posts · Server social.linux.pizza
well, people nowadays think that you need tons of dependencies to work (and #dplyr is also so verbose I get bored only just to code a few ops)
it is actually ridiculous the amount of libraries it installs...
But I wait to comment after actually having tried it, I won't mind learn a new approach if I can reap some benefits from it
François Michonneau · @fmic_
432 followers · 47 posts · Server hachyderm.io
A short blog post where I show how to use #DuckDB to connect to a remote #Parquet file hosted over HTTPS and work with it using #dplyr:
https://francoismichonneau.net/2023/06/duckdb-r-remote-data/
François Michonneau · @fmic_
484 followers · 74 posts · Server hachyderm.ioA short blog post where I show how to use #DuckDB to connect to a remote #Parquet file hosted over HTTPS and work with it using #dplyr:
https://francoismichonneau.net/2023/06/duckdb-r-remote-data/

Kit · @_kit
8 followers · 131 posts · Server fosstodon.org
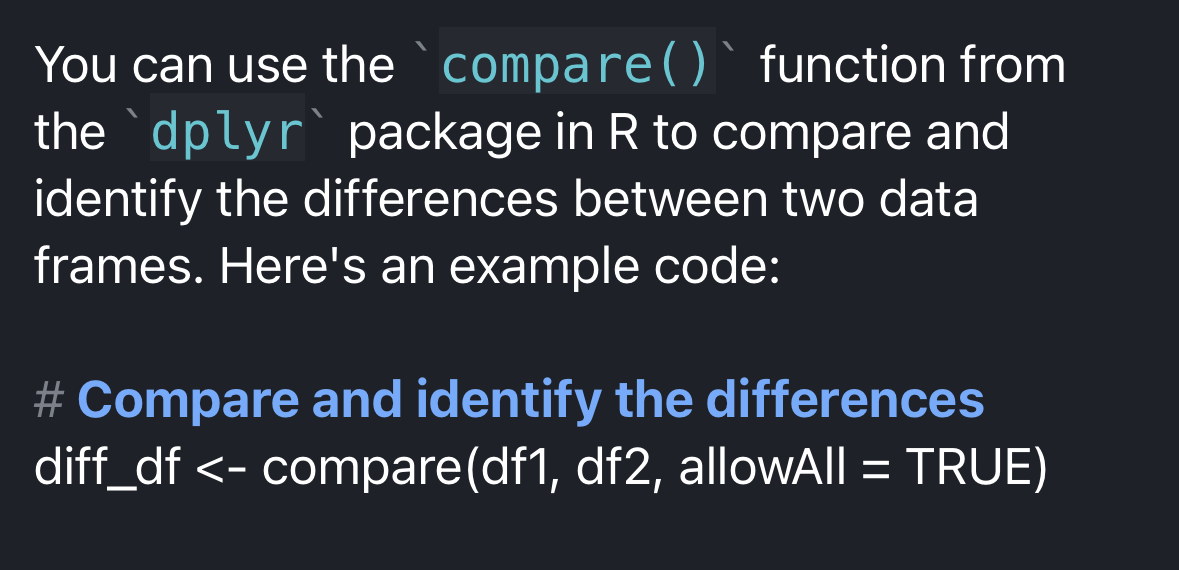
I know we’re up to our eyeballs in #ChatGPT goofs, but this one struck me as particularly puzzling.
Has there ever been a dplyr::compare (I have found no evidence)? Why aren’t there more arguments? Why is the third argument so specific? I’d love to know the provenance of the logic here. Cc: @hadleywickham #rstats #dplyr

Thomas Sandmann · @thomas_sandmann
296 followers · 735 posts · Server genomic.social@MrHedmad If you are comfortable writing SQL then #duckdb might be useful: https://duckdb.org/docs/data/csv/overview.html and if you are an #rstats person then you can query duckdb with #dplyr, too.
Steven P. Sanderson II, MPH · @stevensanderson
99 followers · 537 posts · Server mstdn.social
Are you tired of manually copying and pasting data from multiple sheets in an Excel file? Say no more! In this post, we will show you how to use R programming to read in an Excel file with multiple sheets using a simple function.
Post: https://www.spsanderson.com/steveondata/posts/rtip-2023-04-07/
#data #dataanlysis #excel #readxl #healthyr #r #rstats #opensource #softwaredevelopment #tibble #dplyr
#dplyr #tibble #softwaredevelopment #OpenSource #RStats #r #healthyr #readxl #Excel #dataanlysis #Data

Mike Blazanin · @mikeblazanin
261 followers · 697 posts · Server ecoevo.socialI just released gcplyr v1.5.0 on github.
gcplyr is an #RStats package that makes it easy to wrangle and do model-free analyses of #microbial growth curve data
https://mikeblazanin.github.io/gcplyr/
v1.5.0 includes:
- fixes for critical bugs in derivative calculation
- improved handling of NA values, including several new functions
- new function for linear interpolation
- new args when calculating area under the curve
#microbiology #MicrobialEcology #MicrobialEvolution #ggplot2 #tidyverse #dplyr #data
#rstats #microbial #microbiology #MicrobialEcology #MicrobialEvolution #ggplot2 #tidyverse #dplyr #data
Steven P. Sanderson II, MPH · @stevensanderson
99 followers · 537 posts · Server mstdn.social
Looking to analyze FAANG stocks? Check out this exciting R Shiny app! Well it won't really give a full or even close to a full analysis but it shows how you can make a very simple shiny app to analyze some data.
#r #rstats #opensource #software #tidyquant #tidydensity #dplyr #dt #shiny #faang #stocks #logreturns #stockreturns #densityplot #learning #data
Post: https://www.spsanderson.com/steveondata/posts/rtip-2023-04-05/
#Data #learning #densityplot #stockreturns #logreturns #stocks #faang #shiny #dt #dplyr #tidydensity #tidyquant #Software #OpenSource #RStats #r