
Denise Gutzmer · @DeniseGutzmer
411 followers · 993 posts · Server mindly.social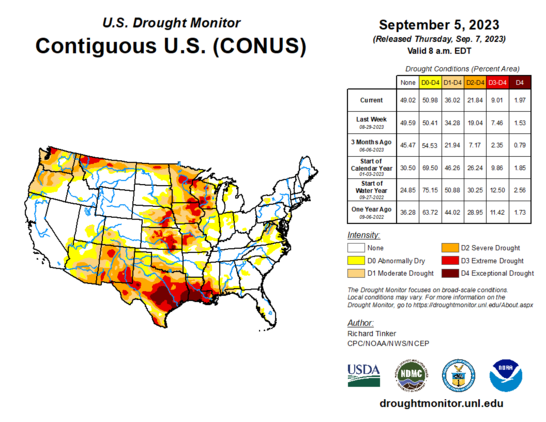
Drought expanded to cover 36.02% of the continental US, an increase of 1.74 points on the US Drought Monitor. #Drought intensified in parts of the Southwest, central US and along the East Coast.
#USDroughtMonitor #DroughtMonitor
https://droughtmonitor.unl.edu/CurrentMap.aspx
#drought #usdroughtmonitor #droughtmonitor
Denise Gutzmer · @DeniseGutzmer
406 followers · 988 posts · Server mindly.social
Drought continued to expand/intensify across parts of the southern and northern tiers of the continental US and the Midwest with some #drought relief in South #Texas from TS Harold. Abnormal dryness and drought cover 50.41% of the Lower 48, while 49.59% is free of dryness.
#DroughtMonitor #USDroughtMonitor
https://droughtmonitor.unl.edu/CurrentMap.aspx
#drought #texas #droughtmonitor #usdroughtmonitor
Denise Gutzmer · @DeniseGutzmer
397 followers · 953 posts · Server mindly.social
The North American Drought Monitor shows #drought expanding across Canada and Mexico over the past month. It covers 27.84% of #Canada, up from 19.42% at the end of June. In #Mexico, 49.56% of the country is affected by drought, up from 41.67% the previous month.
#DroughtMonitor #NorthAmericanDroughtMonitor
https://droughtmonitor.unl.edu/NADM/Home.aspx
#drought #canada #mexico #droughtmonitor #northamericandroughtmonitor
Denise Gutzmer · @DeniseGutzmer
397 followers · 951 posts · Server mindly.social
#Drought continued to expand/intensify in parts of the Southern US and ease in the Midwest, as has been the trend in recent weeks. #Flashdrought has developed in parts of East #Texas and #Louisiana. Drought covers 30.62% of the continental US.
#USDroughtMonitor #DroughtMonitor
https://droughtmonitor.unl.edu/CurrentMap.aspx
#drought #flashdrought #texas #louisiana #usdroughtmonitor #droughtmonitor
Denise Gutzmer · @DeniseGutzmer
392 followers · 934 posts · Server mindly.social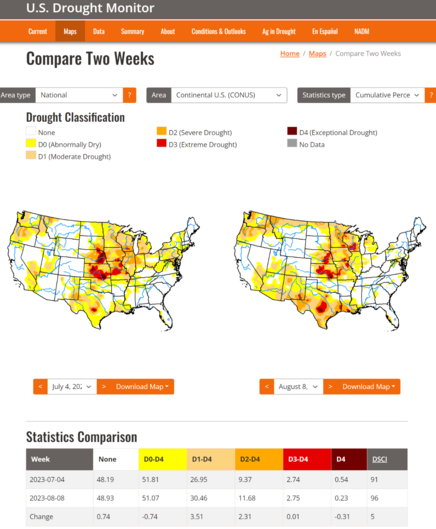
Drought has intensified quickly over the past 5 weeks in the #Southwest and #Texas, and to a lesser degree from #Montana to #Wisconsin. However, the central US to the Northeast has had #drought improvement over the same period.
#USDroughtMonitor #DroughtMonitor #FlashDrought
#southwest #texas #montana #Wisconsin #drought #usdroughtmonitor #droughtmonitor #flashdrought
medio pocillo ☕ · @mediopocillo
238 followers · 1548 posts · Server spore.socialMonitor de Sequía de los Estados Unidos
Mapa publicado: julio 20, 2023
https://droughtmonitor.unl.edu/ES/MapaActual/StateDroughtMonitor.aspx?PR
👉 @droughtcenter 🔗 https://mastodon.world/users/droughtcenter/statuses/110746583307022306
#droughtMonitor #monitorDeSequía #climate #science #PuertoRico #MastodonPR
#droughtmonitor #monitordesequia #climate #science #puertorico #mastodonpr

Deborah Edwards-Oñoro · @redcrew
381 followers · 6197 posts · Server mstdn.socialAccording to today's US Drought Monitor map, our southeast Michigan area finally moved from Moderate Drought to Abnormally Dry. Due to rain we had in the past week.
Other areas in the Midwest, Minnesota and Missouri, didn't fare as well.
https://droughtmonitor.unl.edu/CurrentMap/StateDroughtMonitor.aspx?Midwest
Denise Gutzmer · @DeniseGutzmer
373 followers · 885 posts · Server mindly.social
#Drought (D1-D4) decreased slightly by 1.05 percentage points in the continental US. Conditions eased in the Midwest, but worsened in #Texas, the Southwest and Minnesota.
#USDroughtMonitor #DroughtMonitor
#droughtmonitor #drought #texas #usdroughtmonitor
Denise Gutzmer · @DeniseGutzmer
368 followers · 871 posts · Server mindly.social
In June, #Canada had a mix of #drought intensification and improvements on the North American #Drought Monitor. To the south, #Mexico mainly saw dry conditions.
#NorthAmericanDroughtMonitor #DroughtMonitor
https://droughtmonitor.unl.edu/NADM/Home.aspx
#canada #drought #mexico #northamericandroughtmonitor #droughtmonitor
Denise Gutzmer · @DeniseGutzmer
367 followers · 870 posts · Server mindly.social
Drought remains worst in the central U.S., with a mix of expanding dryness and #drought in the Pacific Northwest to #Minnesota and #Wisconsin. Conditions eased in parts of the Plains, Midwest and Northeast. The area covered by drought in the contiguous US remained near 27%.
#DroughtMonitor #USDroughtMonitor
#drought #minnesota #Wisconsin #droughtmonitor #usdroughtmonitor
Denise Gutzmer · @DeniseGutzmer
352 followers · 857 posts · Server mindly.social
Parts of the Midwest continued to swelter in #drought on the US #DroughtMonitor, while other reaches received some relief from the dryness. The amount of the contiguous US affected by drought (D1-D4) was 26.95%.
Denise Gutzmer · @DeniseGutzmer
350 followers · 847 posts · Server mindly.social
Drought continued to worsen in the #Midwest, #Texas and the Pacific Northwest this week, but eased in the East and parts of the Plains. #Drought (D1-D4) affecting 27.00% of the continental U.S. on the #DroughtMonitor.
https://droughtmonitor.unl.edu/CurrentMap.aspx
#midwest #texas #drought #droughtmonitor
Denise Gutzmer · @DeniseGutzmer
352 followers · 833 posts · Server mindly.social
Drought continued to intensify across the Midwest and parts of the Northeast again this week as #flashdrought developed, threatening corn and other crops.
#Drought covers 27.11% of the contiguous US after drought/dryness began ramping up a month ago.
#USDroughtMonitor #DroughtMonitor
https://droughtmonitor.unl.edu/CurrentMap.aspx
#flashdrought #drought #usdroughtmonitor #droughtmonitor

John Dissauer · @JohnD
17 followers · 108 posts · Server twit.social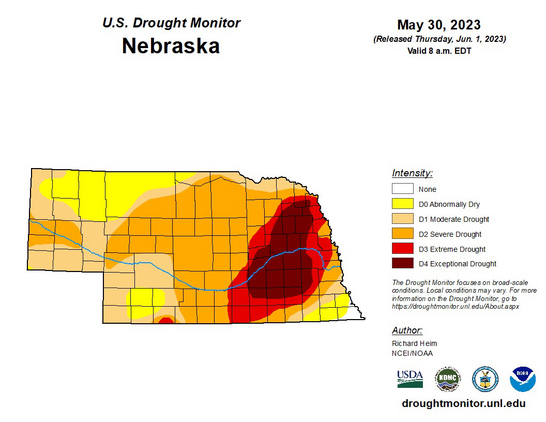
NEED WATER: Drought conditions are escalating in Nebraska.
The latest #DroughtMonitor shows "Exceptional Drought" conditions have expanded 57% over the previous week in eastern Nebraska.
#droughtmonitor #newx #agwx #drought
John Dissauer · @JohnD
17 followers · 107 posts · Server twit.social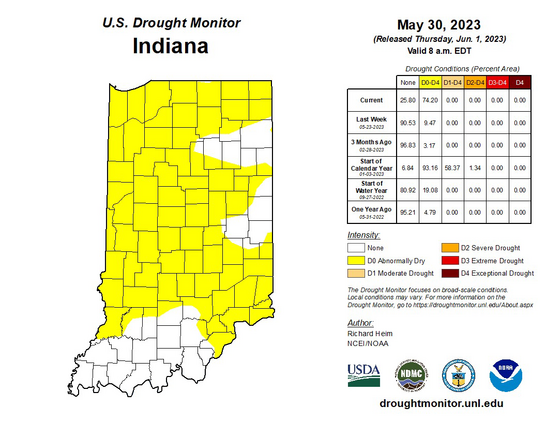
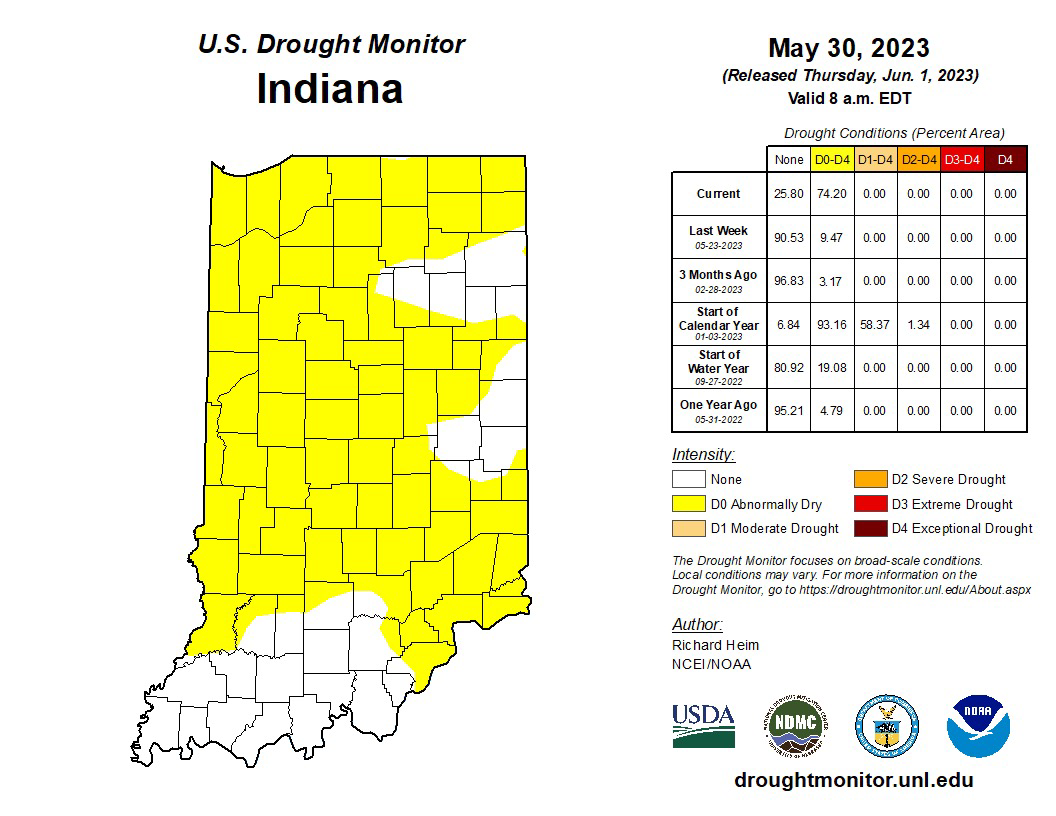
KEEP WATERING: The #Hoosier state is now feeling the effects of dry conditions.
75% of Indiana is classified as "Abnormally Dry" as of the latest #DroughtMonitor issued this morning. The area included is up 683% from last week.
#Hoosier #droughtmonitor #inwx #agwx #drought
John Dissauer · @JohnD
17 followers · 106 posts · Server twit.social
Denise Gutzmer · @DeniseGutzmer
341 followers · 785 posts · Server mindly.social
The amount of drought (D1-D4) on the US #DroughtMonitor decreased to 18.95%. It's been three years since there was so little #drought in the Lower 48.
The amount of abnormal dryness (D0), however, exploded across the Midwest to the East Coast, jumping by 9.45%.
Denise Gutzmer · @DeniseGutzmer
335 followers · 774 posts · Server mindly.social
The drought improvement trend continued across the US for another week with just 19.2% of the contiguous US in #drought. This is the first time since June 2020 that less than 20% of the Lower 48 has been affected.
#DroughtMonitor

Denise Gutzmer · @DeniseGutzmer
330 followers · 756 posts · Server mindly.social
Drought coverage across the contiguous US shrank this week to just 20.35% on the US #DroughtMonitor. Significant drought improvement occurred largely between the Rocky Mountains and the Mississippi River. The #drought improvement trend of the past 29 weeks continues.
Denise Gutzmer · @DeniseGutzmer
324 followers · 732 posts · Server mindly.social
Which parts of the US experience #drought most frequently? The US #DroughtMonitor has shown parts of the Southwest to be affected most often since 2010. Parts of the Midwest and Northeast have been affected the least over the same time frame.