
lil5 :xfce: :golang: · @lil5
70 followers · 942 posts · Server fosstodon.org
If you power your heating with electricity ⚡️ check this out: a map of how
#electricity is generated per county
Colored from green 🌱 to brown 🪨
https://github.com/electricitymaps/electricitymaps-contrib

Stefan Holzheu · @HolzheuStefan
2340 followers · 62 posts · Server mastodon.green
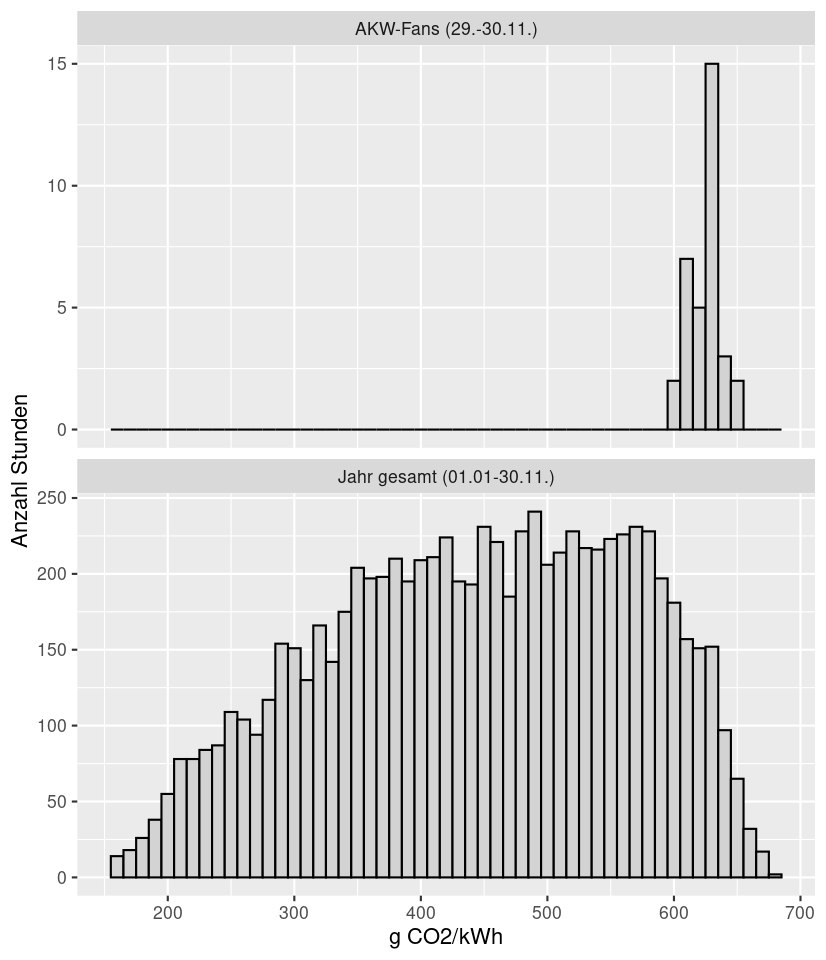
Auf Twitter läuft gerade wieder #ElectricityMap-Cherrypicking vom feinsten. 😅
Würde man die Sceenshots der AKW-Fans zu einer Verteilung zusammenbauen, käme der obere Plot heraus.
Unten sieht man die Verteilung des kompletten Jahrs 2022.
Natürlich ist noch viel zu tun und der EE-Ausbau wurde ja von der alten BuReg regelrecht abgewürgt. Aber ganz so schlecht wie das Bild der AKW-Fans ist es eben doch nicht.

Tykayn · @tykayn
-1 followers · 35190 posts · Server mastodon.cipherbliss.com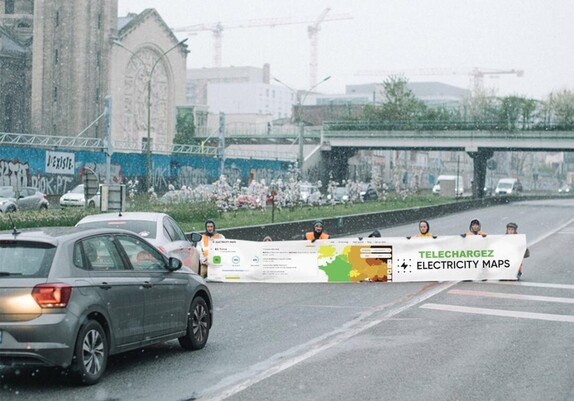

Ruth Mottram · @Ruth_Mottram
1699 followers · 1272 posts · Server fediscience.org@Dr_BoAbrahamsen @ckhrulev btw, do you know about #ElectricityMap? It shows in real time the carbon intensity of the local grid and where the power sources are coming from..

Les voix du nucléaire · @voixdunucleaire
-1 followers · 253 posts · Server mastodon.cipherbliss.com
RT @voixdunucleaire@twitter.com
🌐 Nouvelle mise à jour importante de l'application #ElectricityMap : l'intensité carbone des moyens de production d'#électricité est affinée en fonction de leur localisation (centrales en fonctionmt, combustibles utilisés) & de sources récentes.
#énergie #climat #dataviz
⬇️⬇️⬇️
🐦🔗: https://twitter.com/voixdunucleaire/status/1593122060615946240
#electricitymap #electricite #energie #climat #dataviz
Les voix du nucléaire · @voixdunucleaire
-1 followers · 242 posts · Server mastodon.cipherbliss.com
🌐 Nouvelle mise à jour importante de l'application #ElectricityMap : l'intensité carbone des moyens de production d'#électricité est affinée en fonction de leur localisation (centrales en fonctionmt, combustibles utilisés) & de sources récentes.
#electricitymap #electricite #energie #climat #dataviz
Tykayn · @tykayn
-1 followers · 35083 posts · Server mastodon.cipherbliss.com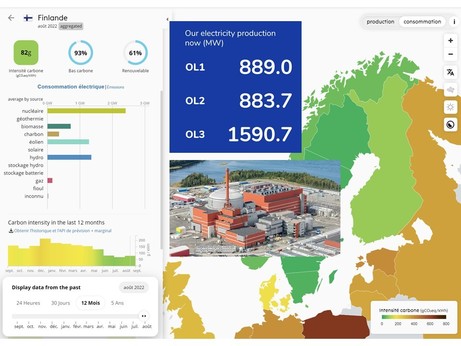
RT @voixdunucleaire
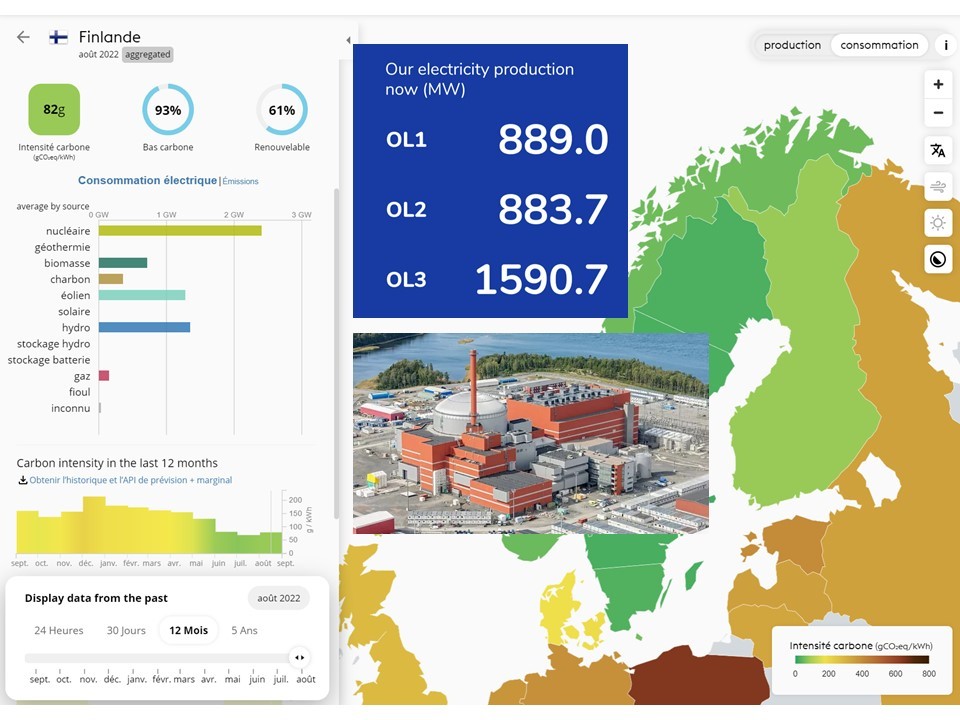
⚡ 1590 MW !
L'électricité finlandaise passe au 🟢
Les finlandais n'appellent pas pour rien l'#EPR d'Olkiluoto le plus grand acte du pays pour le #climat.
#electricitymap, intensité carbone de l'élec. 🇫🇮 ces 12 derniers mois. #OL3 monte en puissance depuis le printemps.
📷: TVO
#epr #climat #electricitymap #OL3

Gerald Söllinger · @geraldco
53 followers · 148 posts · Server graz.social
Schon mal gefragt, wo eurer Strom herkommt?
#electricitymap visualisiert das in echtzeit (stündlich) und berechnet gleichzeitig noch die #CO2 Emissionen.

dada · @dada
2966 followers · 29233 posts · Server diaspodon.frelectricityMap - https://app.electricitymap.org/
> A real-time visualisation of the CO2 emissions of electricity consumption
Source : https://github.com/electricityMap/electricitymap-contrib
#electricity #co2 #electricitymap

Julien M. · @julm
485 followers · 4935 posts · Server framapiaf.org#electricityMap #Environnement #CO2
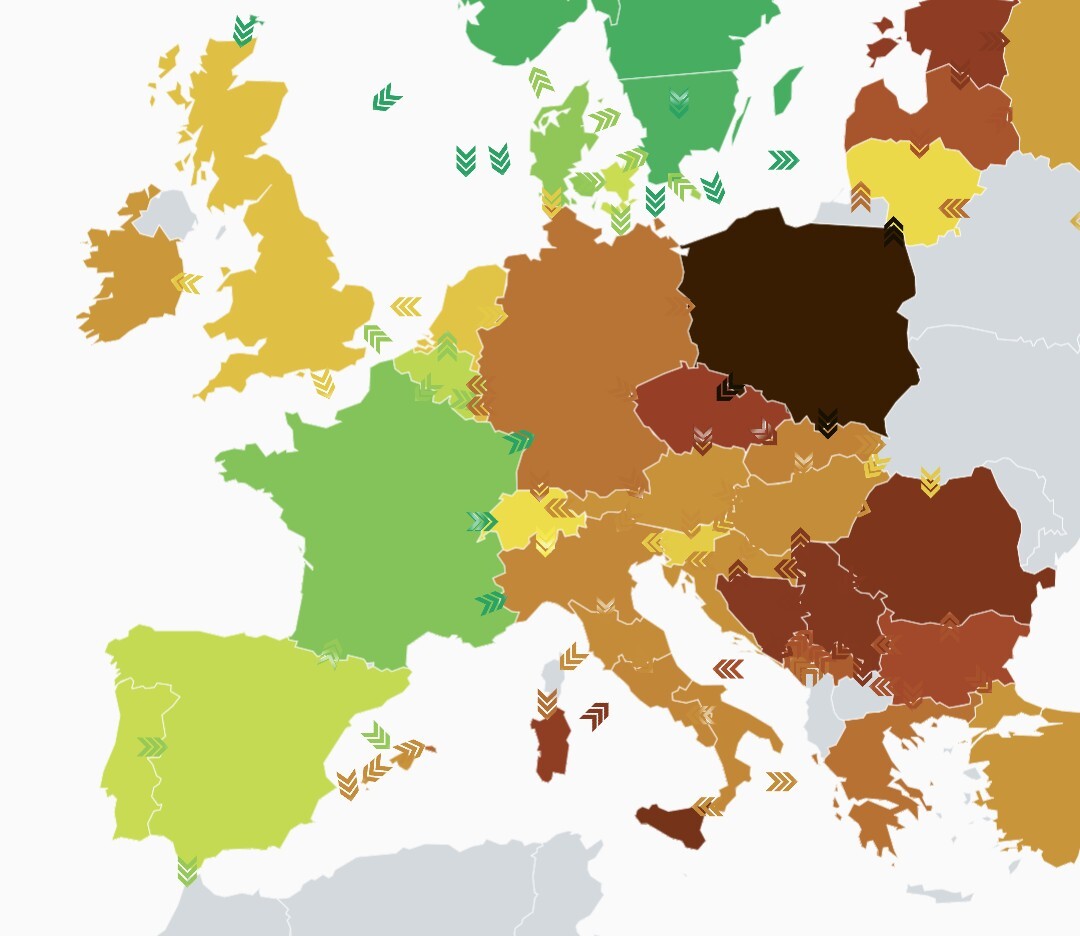
> Nous colorons les zones de la #carte en fonction des quantités de gaz à #EffetDeSerre émises pour chaque unité d’#électricité consommée là bas (c’est son #IntensitéCarbonne). Des couleurs plus vertes signifient une #consommation d’électricité plus respectueuse du #climat.
https://www.electricitymap.org/map
#OpenSource
#opensource #climat #consommation #IntensitéCarbonne #électricité #effetdeserre #carte #co2 #environnement #electricitymap