
Tuomas Väisänen 📼🧟♂️ · @waeiski
685 followers · 954 posts · Server vis.socialOk, there is a #python #DataViz issue regarding point pattern analysis my colleagues are struggling with.
It seems that #Seaborn "stretches" two-dimensional #KDE plots in a weird way with some #geopandas data, whereas running the same analysis in #QGIS with the exact same data provides good and expected results.
One option would be to go full #matplotlib to see if it is related to contour plots, but I have not gone there yet.
#matplotlib #qgis #geopandas #kde #seaborn #dataviz #python

Lost Mapper · @lostmapper
3 followers · 5 posts · Server mapstodon.space
I switched from gpxpy to #Geopandas and am now generating both a #GeoPackage and #GPX file of the combined tracks: https://github.com/lostmapper/strava-gpx-merge

Josh Carlson :qgis: · @jcarlson
415 followers · 808 posts · Server mapstodon.spaceWoot woot!
#FOSS4GNA accepted my proposal!
If any of y'all wanna hear about how I used #GeoPandas to replace a legacy proprietary system, you are in luck.
Anybody out there currently using #DevNet or #BruceHarris for their farmland assessments, take particular note. I can help make things easier for you!
#foss4gna #geopandas #devnet #bruceharris

AI6YR · @ai6yr
3477 followers · 16471 posts · Server m.ai6yr.orgWoohoo, solved complex #GIS software problem (finally) in #python and #geopandas -- took me a lot longer than usual.

shapefile · @shapefile
197 followers · 168 posts · Server mapstodon.spaceDid you know, #geopandas can read and write directly to and from zipped #shapefiles, a.k.a #shizzle files (.shz). #gischat
https://geopandas.org/en/stable/docs/user_guide/io.html
#geopandas #shapefiles #shizzle #gischat

Alexandre B A Villares 🐍 · @villares
853 followers · 1351 posts · Server ciberlandia.pt@shizamura maybe we should leard #geopandas ... (and there are other related libs mentioned on its docs) https://geopandas.org/en/stable/gallery/plotting_basemap_background.html

Lordo · @lordolordor
1035 followers · 1980 posts · Server newsie.social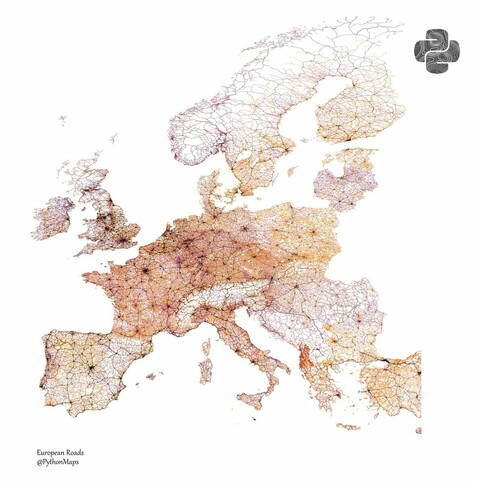
RT @PythonMaps@twitter.com
Roads of Europe! Shows all roads from highways (black) down to lanes (orange) and everything in between!
This map was generated using #Matplotlib #Numpy #Geopandas.
#Python #DataScience #Data #DataVisualization #Europe.
🐦🔗: https://twitter.com/PythonMaps/status/1613988903010340864
#matplotlib #numpy #geopandas #python #datascience #data #datavisualization #europe

Paul Marrow 🇪🇺 · @evopma
355 followers · 437 posts · Server ecoevo.social@underdarkGIS I've been looking at a #FCC dataset about complaints to a US cable company in 2015. #Pandas #GeoPandas and #MovingPandas can hold the data. Investigating how to use distance measures to calculate trajectories. (This is a hypothetical example, no data exists about how the company dealt with the complaints and thus whether they had staff moving around the country.)
#fcc #pandas #geopandas #movingpandas

Jonathan Lenoir · @jonlen
229 followers · 317 posts · Server ecoevo.socialRT @JohannesHUhl1@twitter.com
Animating #map distortions: Transverse #Mercator #projection of each #UTM zone applied to the globe. Made in #python using #pyproj, #geopandas, #shapely, #matplotlib, and #PIL. #cartography #geospatial #geoviz #dataviz #gischat #gis #geopython #geovisualization #mapping
🐦🔗: https://twitter.com/JohannesHUhl1/status/1611885483252142081
#map #mercator #projection #utm #python #pyproj #geopandas #shapely #matplotlib #PIL #cartography #geospatial #geoviz #dataviz #gischat #gis #geopython #geovisualization #mapping

Jorge Cornejo :lah: :zac: · @xchido
4 followers · 5 posts · Server ataricafe.com#FOSS #Geospatial emojis added
#ArcGIS :arcgis:
#cog :cog:
#gdal :gdal:
#GoogleEarth :gearth:
#EarthEngine :gearth_engine:
#geopandas :geopandas:
#GRASSGIS :grassgis:
#NumPy :numpy:
#osgeo :osgeo:
#OpenStreetMap :osm:
#pandas :pandas:
#PostGIS :postgis:
#Postgres :postgres:
#QGIS :qgis:
#RStats :rstat:
#SAGAGIS :saga:
#arcgis #cog #gdal #googleearth #earthengine #geopandas #grassgis #numpy #osgeo #openstreetmap #pandas #postgis #postgres #qgis #rstats #foss #geospatial #sagagis

@Eric.B ©️ · @u4y0u
42 followers · 75 posts · Server mastouille.fr
Jorge Cornejo :verified: · @xchido
9 followers · 41 posts · Server nerdculture.de#ArcGIS :arcgis:
#cog :cog:
#gdal :gdal:
#GoogleEarth :gearth:
#EarthEngine :gearth_engine:
#geopandas :geopandas:
#grassgis :grass:
#NumPy :numpy:
#osgeo :osgeo:
#OpenStreetMap :osm:
#pandas :pandas:
#PostGIS :postgis:
#Postgres :postgres:
#QGIS :qgis:
#RStats :rstat:
#arcgis #cog #gdal #googleearth #EarthEngine #geopandas #grassgis #numpy #osgeo #openstreetmap #pandas #postgis #postgres #qgis #rstats

Eduardo Graells-Garrido 🐦 · @ZorzalErrante
78 followers · 63 posts · Server vis.social
#30DayMapChallenge / Music
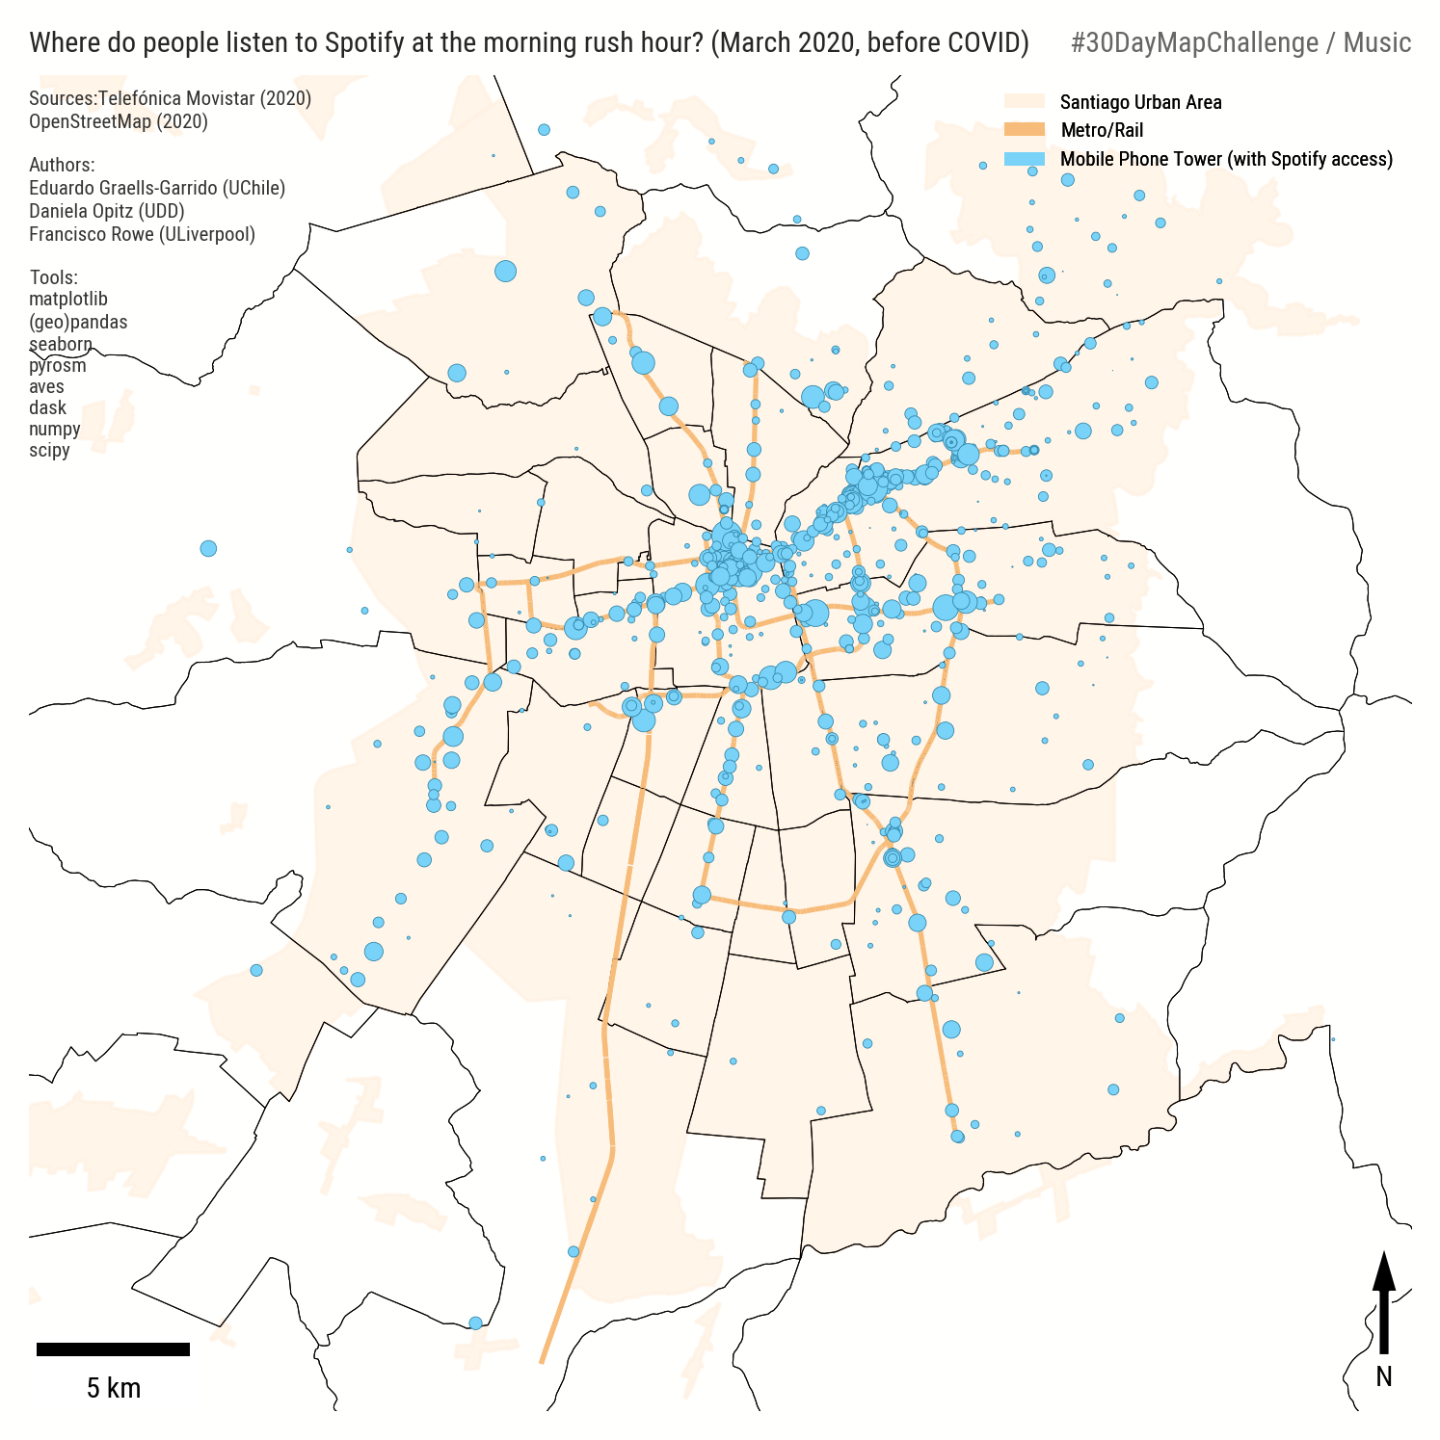
Where do people listen to music at commuting times? Using mobile phone data, we can observe that mostly when moving in public transportation! This bubble map shows mobile phone towers scattered around the city where Spotify is accessed to.
This is part of a WIP paper where we analyze several signals to infer the mode split (share of usage per mode of transportation) in Chilean cities.
#geopandas #matplotlib #30DayMapChallenge

Javed Ali · @javedali
114 followers · 6 posts · Server fediscience.org
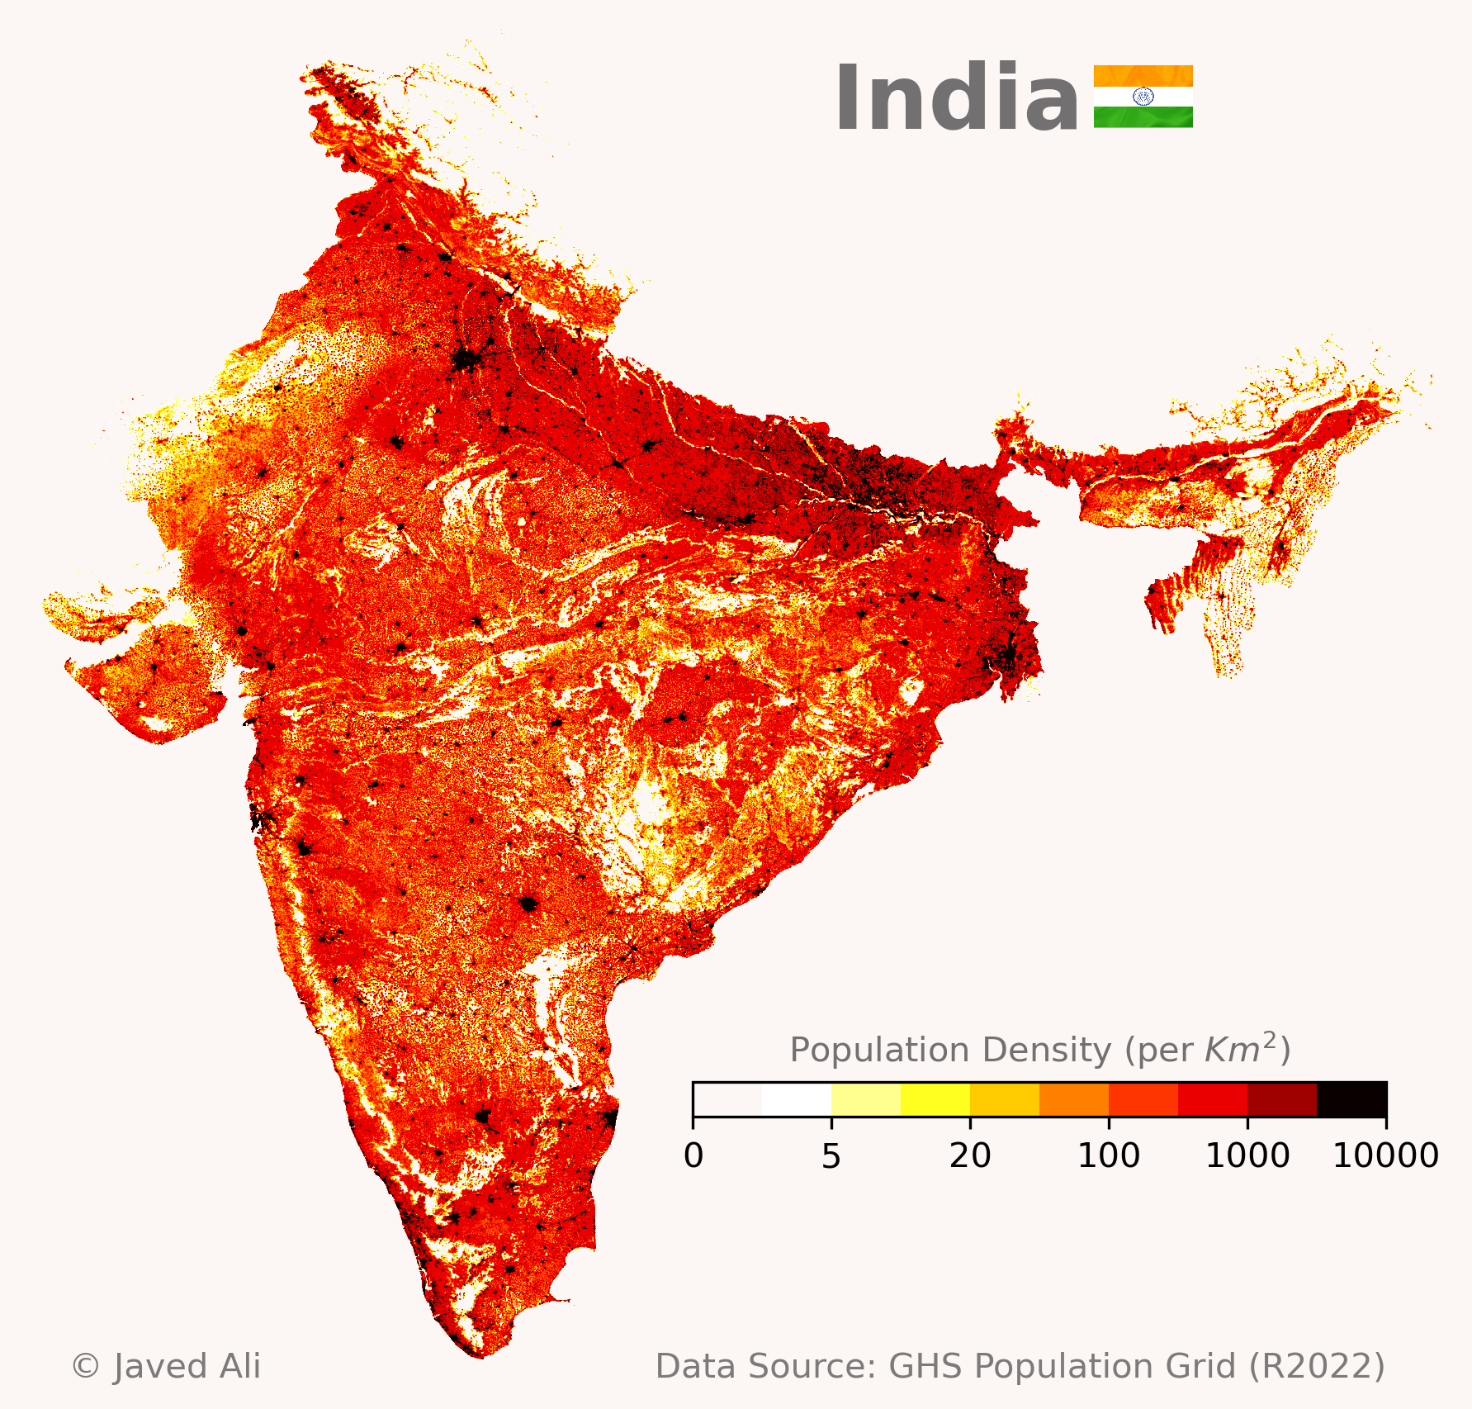
Population density map of #India 🇮🇳.
On the map, you can see many dark hotspots denoting densely populated cities and towns, mixed in with lighter regions with less people. All major #Indian cities show high population densities, including #NewDelhi, #Kolkata, #Chennai, #Bengaluru, #Hyderabad, and #Mumbai.
I created this map in #python using #matplotlib #geopandas #rasterio packages. For population data, I used the 2022 GHS population grid data.
#dataviz #datavisualization #30DayMapChallenge #Rasterio #geopandas #matplotlib #python #mumbai #Hyderabad #bengaluru #Chennai #kolkata #newdelhi #indian #india
Javed Ali · @javedali
107 followers · 5 posts · Server fediscience.org
#Map of all roads and streets in the #OrlandoCity, #Florida by designations.
I created this map using #Matplotlib and #Geopandas libraries in #Python. I used the road data from #OpenStreetMap, and the City of Orlando's Data Hub for city boundaries.
#30daymapchallenge #datavisualization #pythonprogramming #dataviz #mapping @matplotlib@beta.birdsite.live @matplotlib@vis.social
#mapping #dataviz #pythonprogramming #datavisualization #30DayMapChallenge #openstreetmap #python #geopandas #matplotlib #florida #orlandocity #map
Eduardo Graells-Garrido 🐦 · @ZorzalErrante
75 followers · 44 posts · Server vis.social
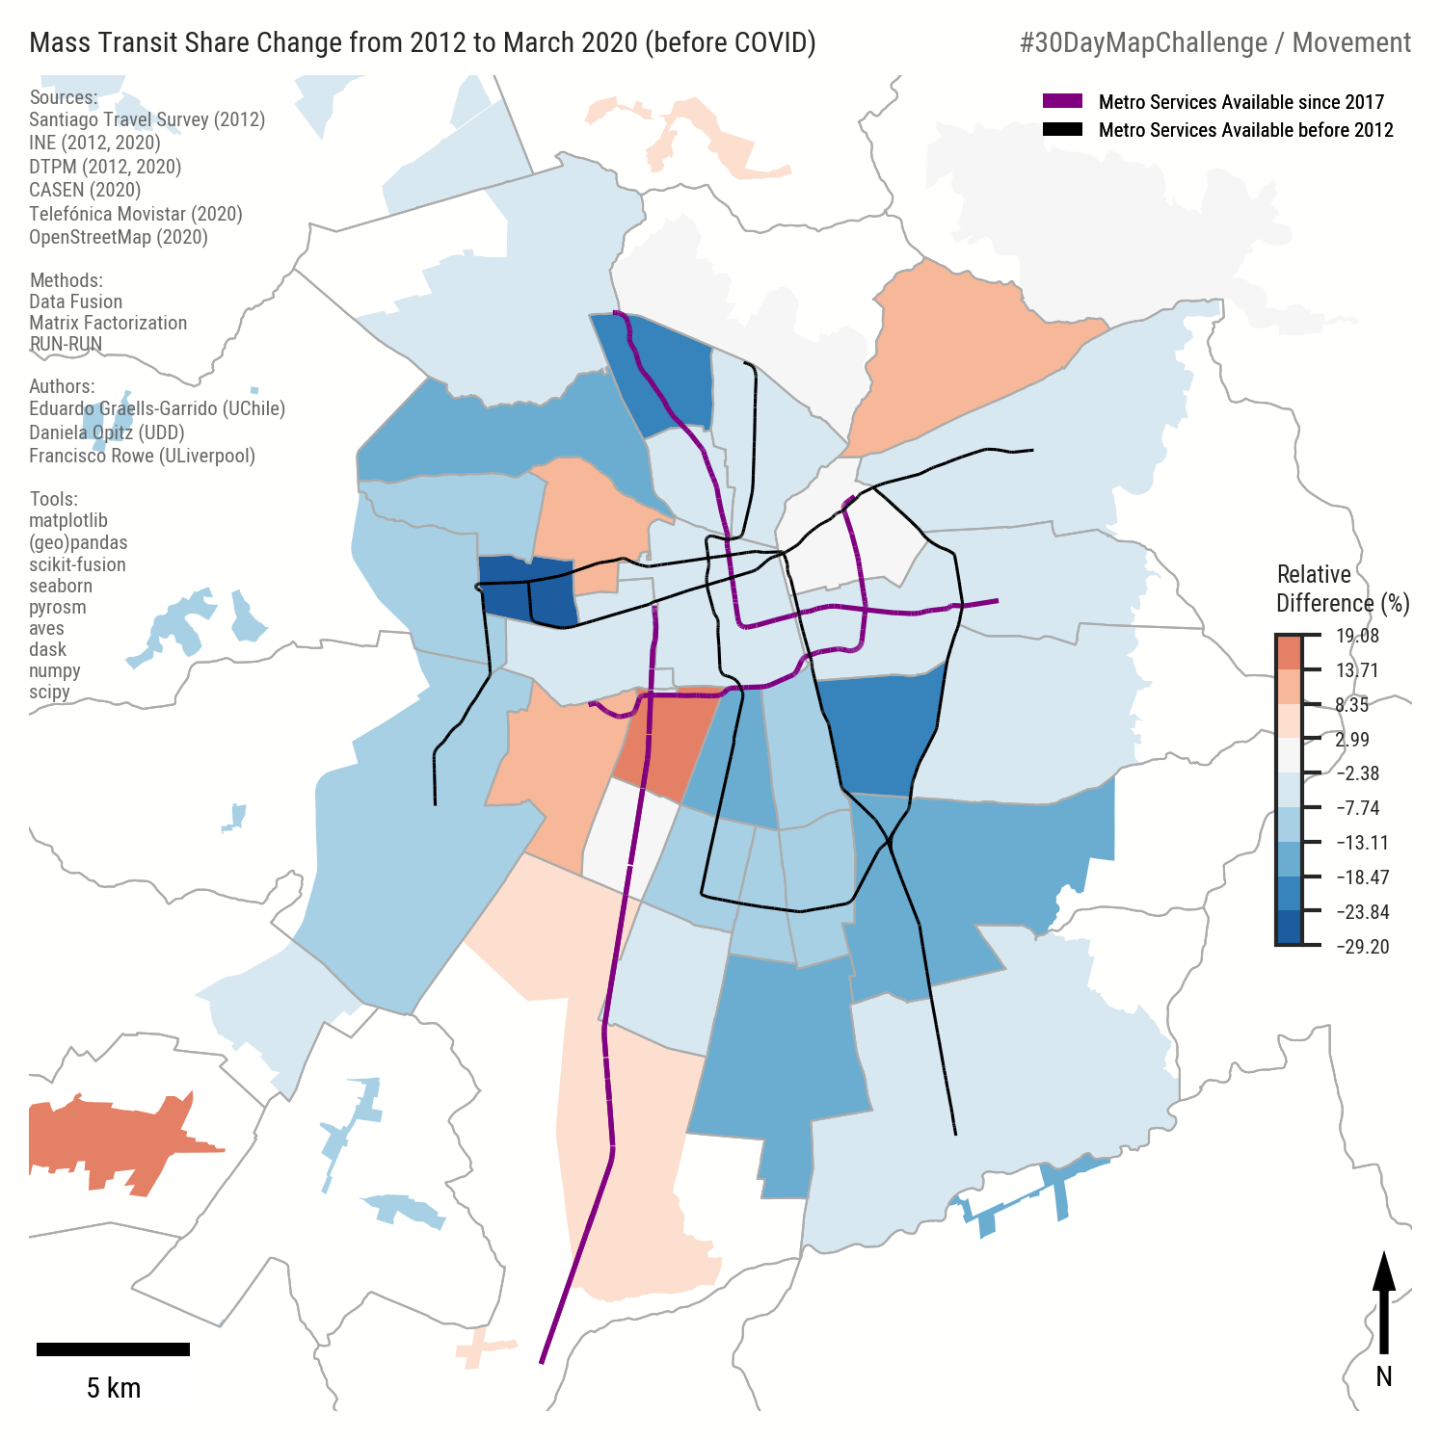
#30DayMapChallenge / Movement: Change in mass transit share from 2012 to 2020 (before covid) in Santiago, Chile.
Public transport share was reduced almost eveywhere, except in areas near new metro/rail infra., as well as municipalities where we hypothesize that remote work has reduced motorized transport (thus increasing mass transit share relatively). We measured this using data fusion of mobile phone data and multiple official sources.
Made with #matplotlib and #geopandas, among other tools.
#geopandas #matplotlib #30DayMapChallenge

Michael Szell · @mszll
434 followers · 25 posts · Server datasci.socialJust added these fancy custom #emojis to our server https://datasci.social
#pandas :python:
#rstats :rstats:
#pandas :pandas:
#numpy :numpy:
#geopandas :geopandas:
#osm :osm:
If I'm missing anything vital for #DataScience, let me know!
#emojis #pandas #rstats #numpy #geopandas #osm #datascience

Philipp Gärtner · @Mixed_Pixels
92 followers · 9 posts · Server mapstodon.spaceWe have beautiful geospatial emojis in the mapstodon.space
#ArcGIS :arcgis:
#cog :cog:
#gdal :gdal:
#GoogleEarth :gearth:
#EarthEngine :gearth_engine:
#geopandas :geopandas:
#grassgis :grass:
#NumPy :numpy:
#osgeo :osgeo:
#OpenStreetMap :osm:
#pandas :pandas:
#PostGIS :postgis:
#Postgres :postgres:
#QGIS :qgis:
#RStats :rstat:
#arcgis #cog #gdal #GoogleEarth #earthengine #geopandas #grassgis #numpy #osgeo #OpenStreetMap #pandas #postgis #postgres #qgis #RStats

Tanguy Fardet · @tfardet
602 followers · 2753 posts · Server scicomm.xyzHey #Mapstodon, is there a Python tool to select the best equal-area #projection for a given region of the world?
Basically I'm looking for something like https://projectionwizard.org/ but in Python.
Or, if that does not exist, I'd be interested in any resource telling me about the criteria to switch between Albers conic, Cylindrical, Oblique Lambert azimuthal, and Transverse cylindrical equal-area projections.
I'm sure it's latitude, but more details would be good ^^
#maps #crs #gis #geopandas
#geopandas #gis #crs #maps #projection #mapstodon
Tanguy Fardet · @tfardet
594 followers · 2736 posts · Server scicomm.xyzAny #osmnx users here?
I encountered a weird issue today: a request with geometries_from_polygon that I had already run successfully X times and that was cached locally suddenly started returning an empty GeoDataFrame...
I also checked that the #overpass API also returns an empty result as JSON but I don't think anything changed...
Even the osmnx.geometries_from_place("Ivry-sur-Seine", tags={"buildings": True}) does that...
I've no idea what's going on :s
#maps #mapstodon #geopandas #osm #gis #overpass #osmnx