
Louise Sinks · @lsinks
1 followers · 3 posts · Server fosstodon.orgInspired by @nrennie #tidytuesday entry, I decided to learn how to make animated gifs. I chose to use the #gganimate package. Code and narrative and animations at
https://lsinks.github.io/posts/2023-07-11-tidytuesday-temps/temperatures.html

Matthew Kay · @mjskay
1637 followers · 585 posts · Server fediscience.orgFinally, I've tried to ensure compatibility with other packages, like #gganimate and #ggnewscale. Here's the gganimate gapminder example using a multiply blend.

shikharabhat · @shikharabhat
186 followers · 47 posts · Server ecoevo.socialJust discovered the incredible #rstats package #gganimate by @thomasp85 and David Robinson that builds on @hadleywickham 's #ggplot2, and it's so fun! Here's a graph showing 10 realizations each of a population following a stochastic logistic eqn for K = 100 (red) and K = 200 (blue). Dotted lines are the deterministic logistic equation. Making this animation from an existing (static) ggplot figure took me 2 lines of code. @rweekly
@rforecology

ThinkR · @thinkr
185 followers · 11 posts · Server fosstodon.org
#RstatsFR - Nouvel article sur le blog: "Animer vos graphiques avec des gifs en mettant des étoiles dans les yeux de votre public" by @Brt_Arthur
💪 #GGAnimate va vous mettre des étoiles plein les yeux... et des paillettes dans votre vie ? 🤩
👉https://thinkr.fr/animer-vos-graphiques-avec-des-gifs-en-mettant-des-etoiles-dans-les-yeux-de-votre-public
#RStats

David 🏳️🌈 · @dmendsev
45 followers · 194 posts · Server mastodon.lolFor this week's #Tidytuesday #dataviz I'm attempting both #gganimate and a bit of adding narrative to the data (cats uk).
I made up in my mind that these three cats had a love story in the streets of a village in Cornwall, UK.
Maybe next time I should just stick to visualizing 😅
#Rstats
#tidytuesday #dataviz #gganimate #rstats

Antonio Páez · @paezha
728 followers · 1462 posts · Server mastodon.onlinePrompt of the day: Debug view. This gif is part of the debugging process while trying to code waves. The words are the opening of #Melville's #MobyDick.
Coded in #Rstats with #ggplot2 and #gganimate
The code is available in my #Genuary2023 repository:
https://github.com/paezha/genuary2023/tree/master/2022-01-05_Debug-View
#genuary2023 #gganimate #ggplot2 #rstats #mobydick #melville #GENUARY #genuary5
Antonio Páez · @paezha
728 followers · 1462 posts · Server mastodon.onlineAccidental gltich: this is not what I was aiming for.
Coded in #Rstats with #ggplot2 and #gganimate
#generativeart #creativecoding #gganimate #ggplot2 #rstats #rtistry #GENUARY #genuary2
Antonio Páez · @paezha
728 followers · 1462 posts · Server mastodon.onlineI call this system "Fiesta".
It is an animation showing slices of three spheres. The spheres are sliced over the z-axis in constant angular increments. The effect is like fireworks.
Coded in #Rstats using #ggplot2 and #gganimate. The code is available in my #genuary2023 repository:
https://github.com/paezha/genuary2023/tree/master/2022-01-01_Perfect-loop
#creativecoding #generativeart #rtistry #genuary2023 #gganimate #ggplot2 #rstats #GENUARY #genuary1

Wombat the EE · @wombat_ee
50 followers · 189 posts · Server mastodon.energyCalifornia's doing pretty alright for a state with only one nuclear plant and very little hydro because of the drought.
RT @GrantChalmers@twitter.com
Carbon Intensity of Electricity consumption in December 2022. Daily minimum vs maximum, overall median represented by a blue asterisk. #rstats #ggplot2 #gganimate #ESG #cleanenergy #energytwitter h/t
@ElectricityMaps@twitter.com
🐦🔗: https://twitter.com/GrantChalmers/status/1609317852275970048
#rstats #ggplot2 #gganimate #ESG #cleanenergy #EnergyTwitter

Gregor Gorjanc · @GregorGorjanc
118 followers · 245 posts · Server fediscience.orgRT @lnalborczyk@twitter.com
What does happen when fitting a linear regression model with an optimisation procedure? How does it find the "best" line?
A graphical answer illustrating the iterative nature of the optimisation procedure (here, minimising the root-mean-square deviation).
🐦🔗: https://twitter.com/lnalborczyk/status/1608743748233756672

Sónia Cabral · @soncabral2022
246 followers · 2133 posts · Server mastodon.social
RT @lnalborczyk@twitter.com
What does happen when fitting a linear regression model with an optimisation procedure? How does it find the "best" line?
A graphical answer illustrating the iterative nature of the optimisation procedure (here, minimising the root-mean-square deviation).
🐦🔗: https://twitter.com/lnalborczyk/status/1608743748233756672

Ryan · @ryanahart
14 followers · 5 posts · Server fosstodon.org'Tis the season for some crafting, albeit digital.
Merry Christmas and happy holidays!

Juli Nagel · @juli_nagel
423 followers · 109 posts · Server fosstodon.orgI don't think my #rstats code for day 9 of the #AdventOfCode2022 will win a beauty competition, BUT I saved every position of every knot, just for this #gganimate.
It's too slow for my taste, but any attempt on speeding it up resulted in too many green dots plotted at the same time (I already struggled to make the gold line stay AND have the right number of green dots appear), or the gold line being wonky.
Find the code here:
https://github.com/einGlasRotwein/advent_of_code_2022
PS: This beast takes > 30 min to render.
#rstats #AdventOfCode2022 #gganimate

Jon Spring · @Spring
53 followers · 46 posts · Server data-folks.masto.host
Oy, that was a scrappy #adventofcode day 9 for me. I used #gganimate for some debugging to check it was working right.

IandLoveandData · @deepsha
55 followers · 16 posts · Server fosstodon.orgFor this week's #TidyTuesday I wanted to combine #ggmap and #gganimate. The reveal transition didn't work as expected and I cleaned the data to be cumulative so the previously approved elevators showed up as new ones start popping. Created functions to replicate for any year. #rstats Code: https://github.com/deepshamenghani/tidytuesday/tree/master/2022/Week_49_Elevators
#tidytuesday #ggmap #gganimate #rstats

Blandine Le Cain · @blandinelc
69 followers · 43 posts · Server mastodon.social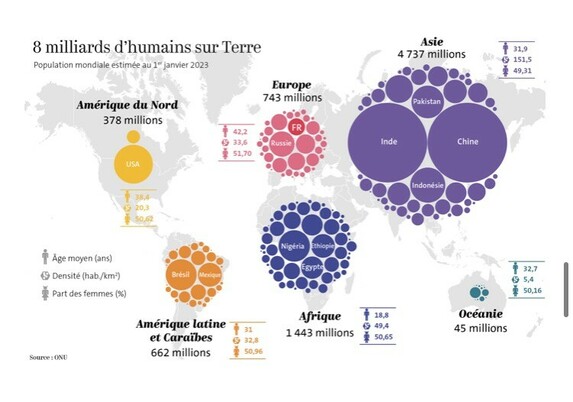
Sur ce sujet, une question en particulier : comment représenter visuellement la répartition entre continents en se détachant un peu de la géographie, sans la perdre ? Ce qui a donné, à gauche, une infographie réalisée avec Illustrator par notre service infographie. A droite, une version animée réalisée grâce au package assez magique {cartogram} #cartogram #gganimate [3/8]

Liza (she/her) · @lizabolton
113 followers · 75 posts · Server mas.to
@economics nice to connect! I don't do much with #gganimate, but I would like to play with it more. You might find this #rstats optional assignment I did with my students fun! We created 'breathing exercises.
Liza (she/her) · @lizabolton
344 followers · 368 posts · Server mas.to@economics nice to connect! I don't do much with #gganimate, but I would like to play with it more. You might find this #rstats optional assignment I did with my students fun! We created 'breathing exercises.

Marcel Ribeiro-Dantas, PhD🔎📊 · @mribeirodantas
114 followers · 5605 posts · Server mastodon.socialRT @ryanpholbrook@twitter.com
A thread of classifiers learning a decision rule. Dashed line is optimal boundary. Animations with #gganimate by @thomasp85@twitter.com and @drob@twitter.com. #rstats
Logistic regression {stats::glm} with each class having normally distributed features. (1/n)
🐦🔗: https://twitter.com/ryanpholbrook/status/1218526167961088000