
Nicola Rennie · @nrennie
1835 followers · 727 posts · Server fosstodon.org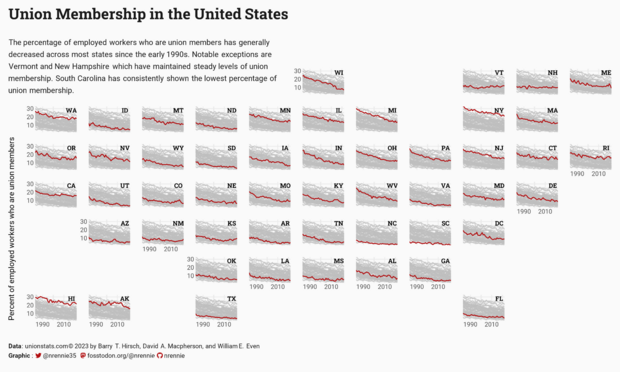
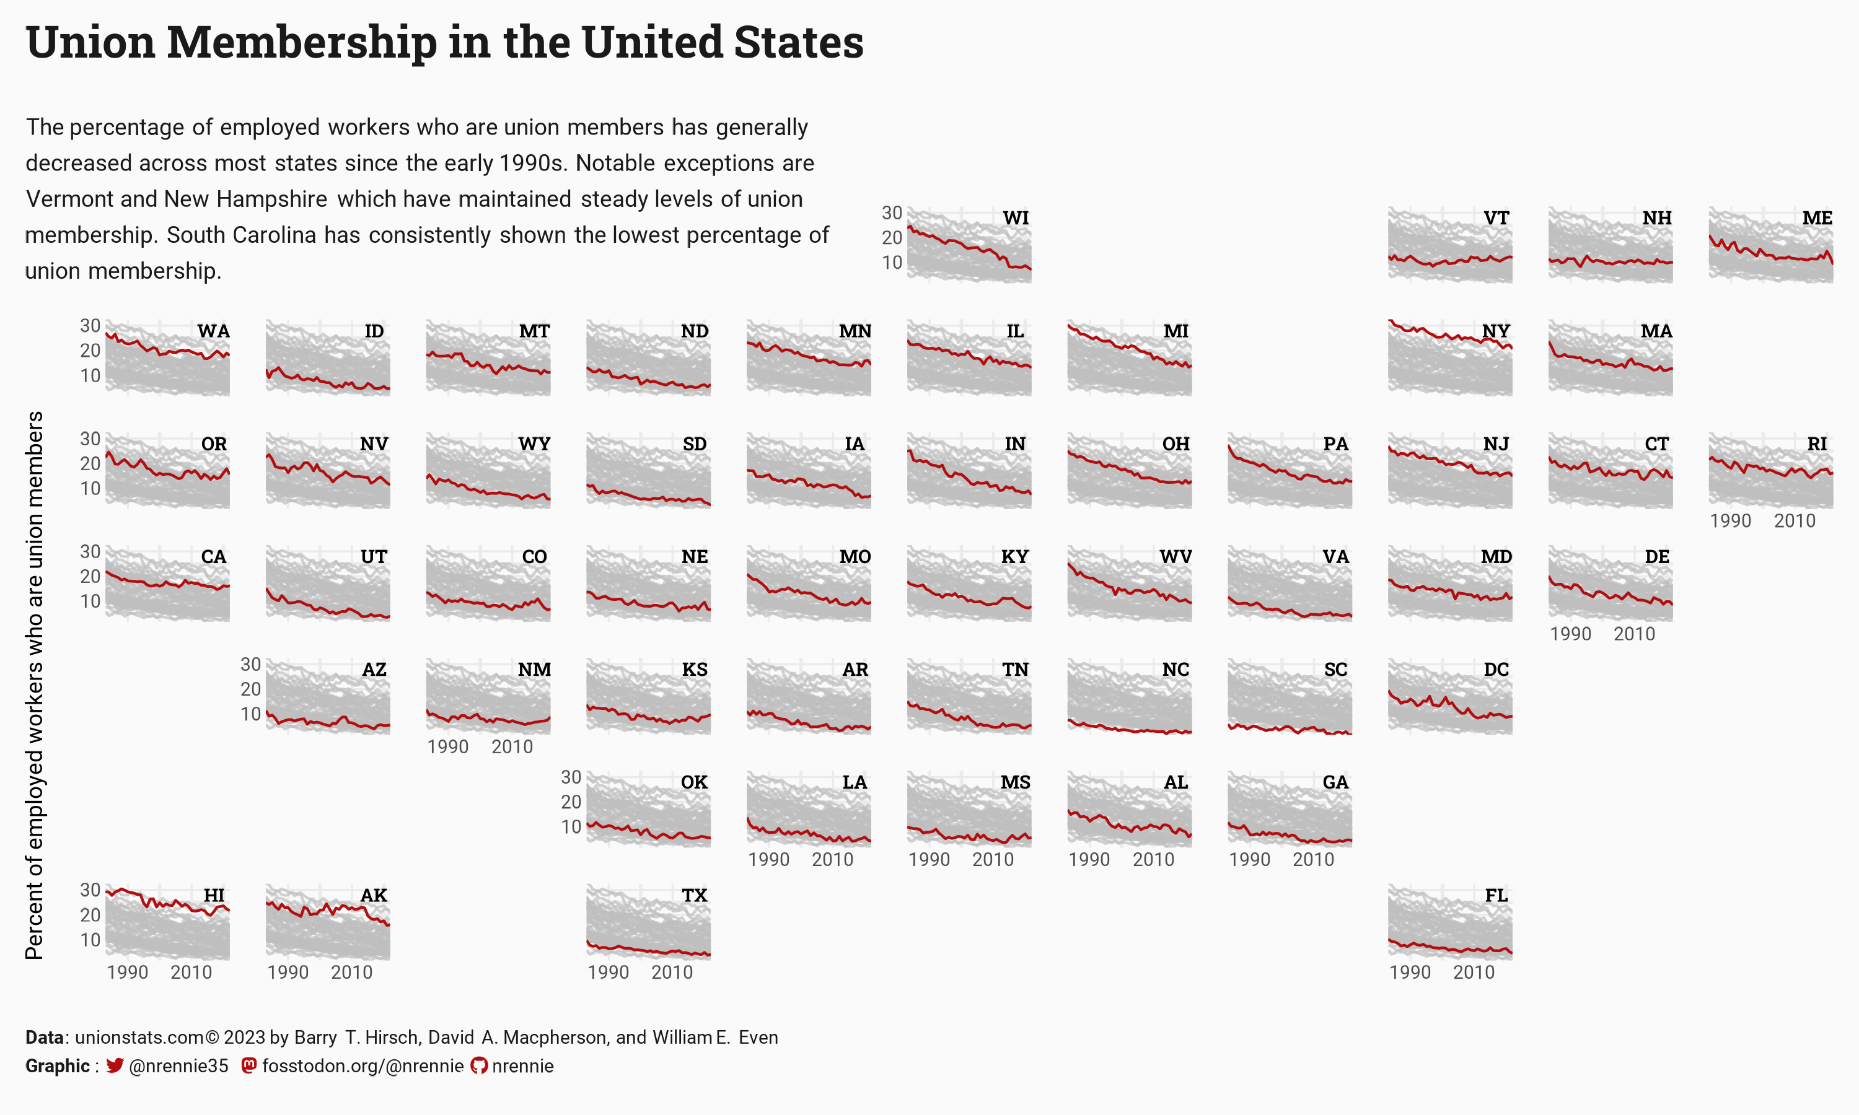
Catching up on last week's #TidyTuesday, and keeping it simple with some line charts! This plot uses two of my favourite #ggplot2 extension packages:
🗺️ {geofacet} for visualising data across different geographic regions
📈 {gghighlight} for highlighting a subset of values in a chart, here showing each state in relation to others
Code: https://github.com/nrennie/tidytuesday/tree/main/2023/2023-09-05
#tidytuesday #ggplot2 #rstats #dataviz #r4ds

Calle Börstell · @c_borstell
178 followers · 44 posts · Server fediscience.org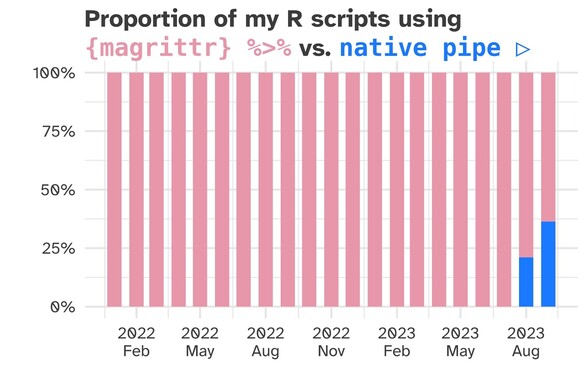
While doing teaching prep for a computational linguistics class, updating the scripts to include the new native pipe operator |>.
Did a little meta-analysis of my own #RStats scripts and the relative use of either pipe: change in progress! #tidyverse #ggplot2

Steven Ponce · @sponce1
0 followers · 29 posts · Server graphics.social
Here is my #viz for the #TidyTuesday challenge – W36. This one is about union membership in the United States, 1970-2022.
.
This week's data comes from the Union Membership, Coverage, and Earnings from the CPS.
.
📂: https://github.com/poncest/tidytuesday/tree/main/2023/Week_36
.
#rstats | #r4ds | #tidyverse | #dataviz | #ggplot2
#viz #tidytuesday #rstats #r4ds #tidyverse #dataviz #ggplot2
Calle Börstell · @c_borstell
178 followers · 41 posts · Server fediscience.org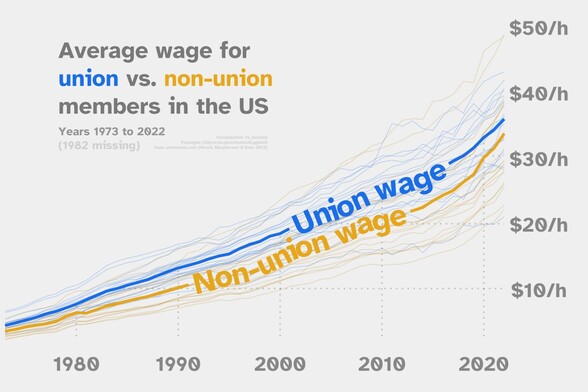
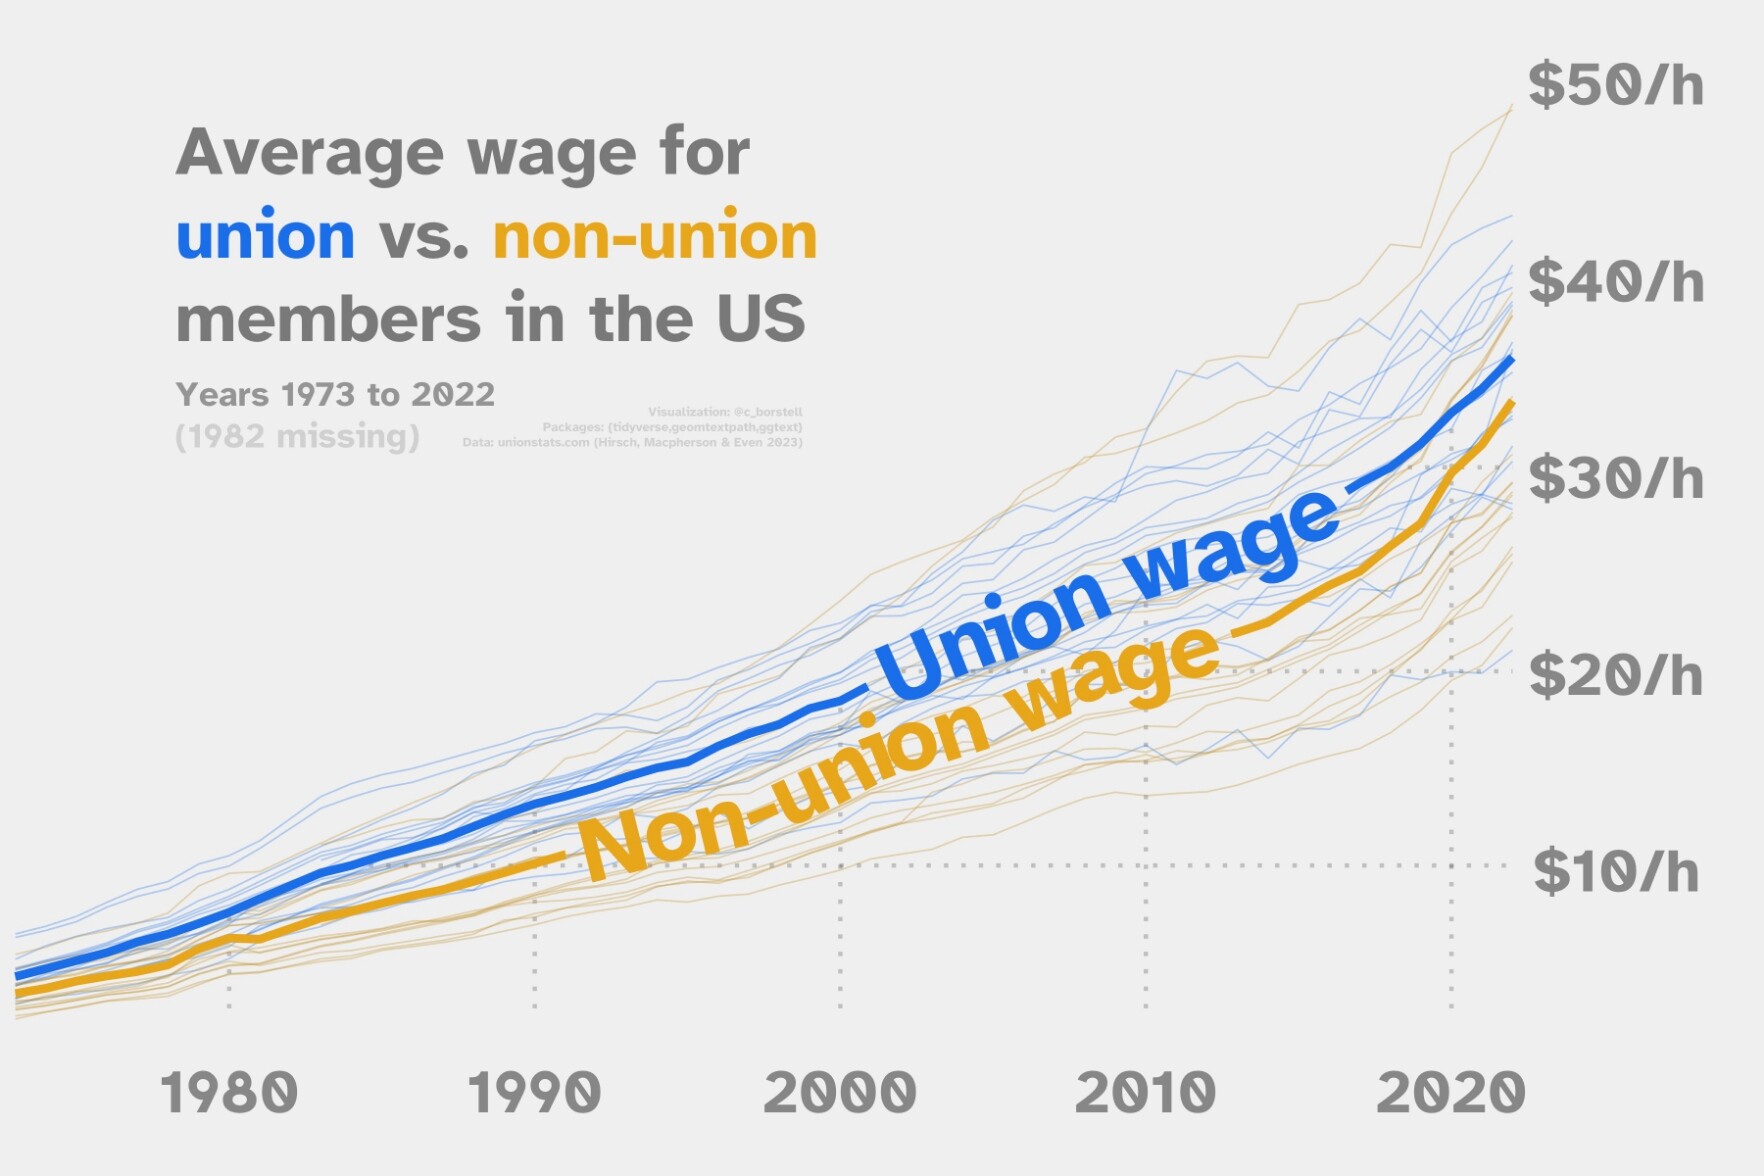
#TidyTuesday week 36: US union wages
🔗: https://github.com/borstell/tidytuesday/tree/main/2023/2023-09-05
#RStats #tidyverse #ggplot2 #dataviz
#dataviz #ggplot2 #tidyverse #rstats #TidyTuesday
Steven Ponce · @sponce1
0 followers · 29 posts · Server graphics.social
Here is my #viz for the #SWDchallenge – SEP 2023 | makeover magic
.
The data comes from the book Storytelling with Data: Let's Practice! This #viz is about the actual vs. projected target of reaching 450 accounts.
.
🔗: https://community.storytellingwithdata.com/challenges/sep-2023-makeover-magic/line-chart-actual-vs-projected
.
📂: https://github.com/poncest/SWDchallange/tree/main/2023/09_September
.
#SWDchallange | #dataviz | #rstats | #ggplot2
#viz #swdchallenge #swdchallange #dataviz #rstats #ggplot2

Meghan Harris · @meghansharris
392 followers · 260 posts · Server fosstodon.org

Steven P. Sanderson II, MPH · @stevensanderson
163 followers · 781 posts · Server mstdn.social
📊 Elevate data presentations with elegant Lollipop Charts in R! 🍭 Compare, emphasize, and visualize outliers effortlessly. Dive into creating your own stunning charts using ggplot2. Unveil data stories that captivate!
#DataViz #LollipopCharts 🚀📊 #ggplot2
Post: https://www.spsanderson.com/steveondata/posts/2023-08-31/
#ggplot2 #lollipopcharts #dataviz

ChrisAdamsEcon :betahat: · @chrisadamsecon
948 followers · 3877 posts · Server econtwitter.net#Rstats question. Any ideas out there to automatically create alt text from ggplot objects? #accessibility #alt #ggplot2
#rstats #accessibility #alt #ggplot2

Janekdererste · @janekdererste
20 followers · 433 posts · Server det.social@geospacedman true. For me #tidyverse and #ggplot2 are synonym for #R, as I just use it for data wrangling and plotting.
Steven P. Sanderson II, MPH · @stevensanderson
162 followers · 764 posts · Server mstdn.social
📢 Exciting news! Learn to visualize categorical data in R with these engaging charts:
1️⃣ Barplots with ggplot2's geom_bar()
2️⃣ Grouped boxplots with base R and ggplot2
3️⃣ Mosaic plots
🔍 Check out the guide here: https://www.spsanderson.com/steveondata/posts/2023-08-29/
🔬 Experiment with your own data and uncover valuable insights!
#ggplot2 #visualization #r #RStats #datavisualization

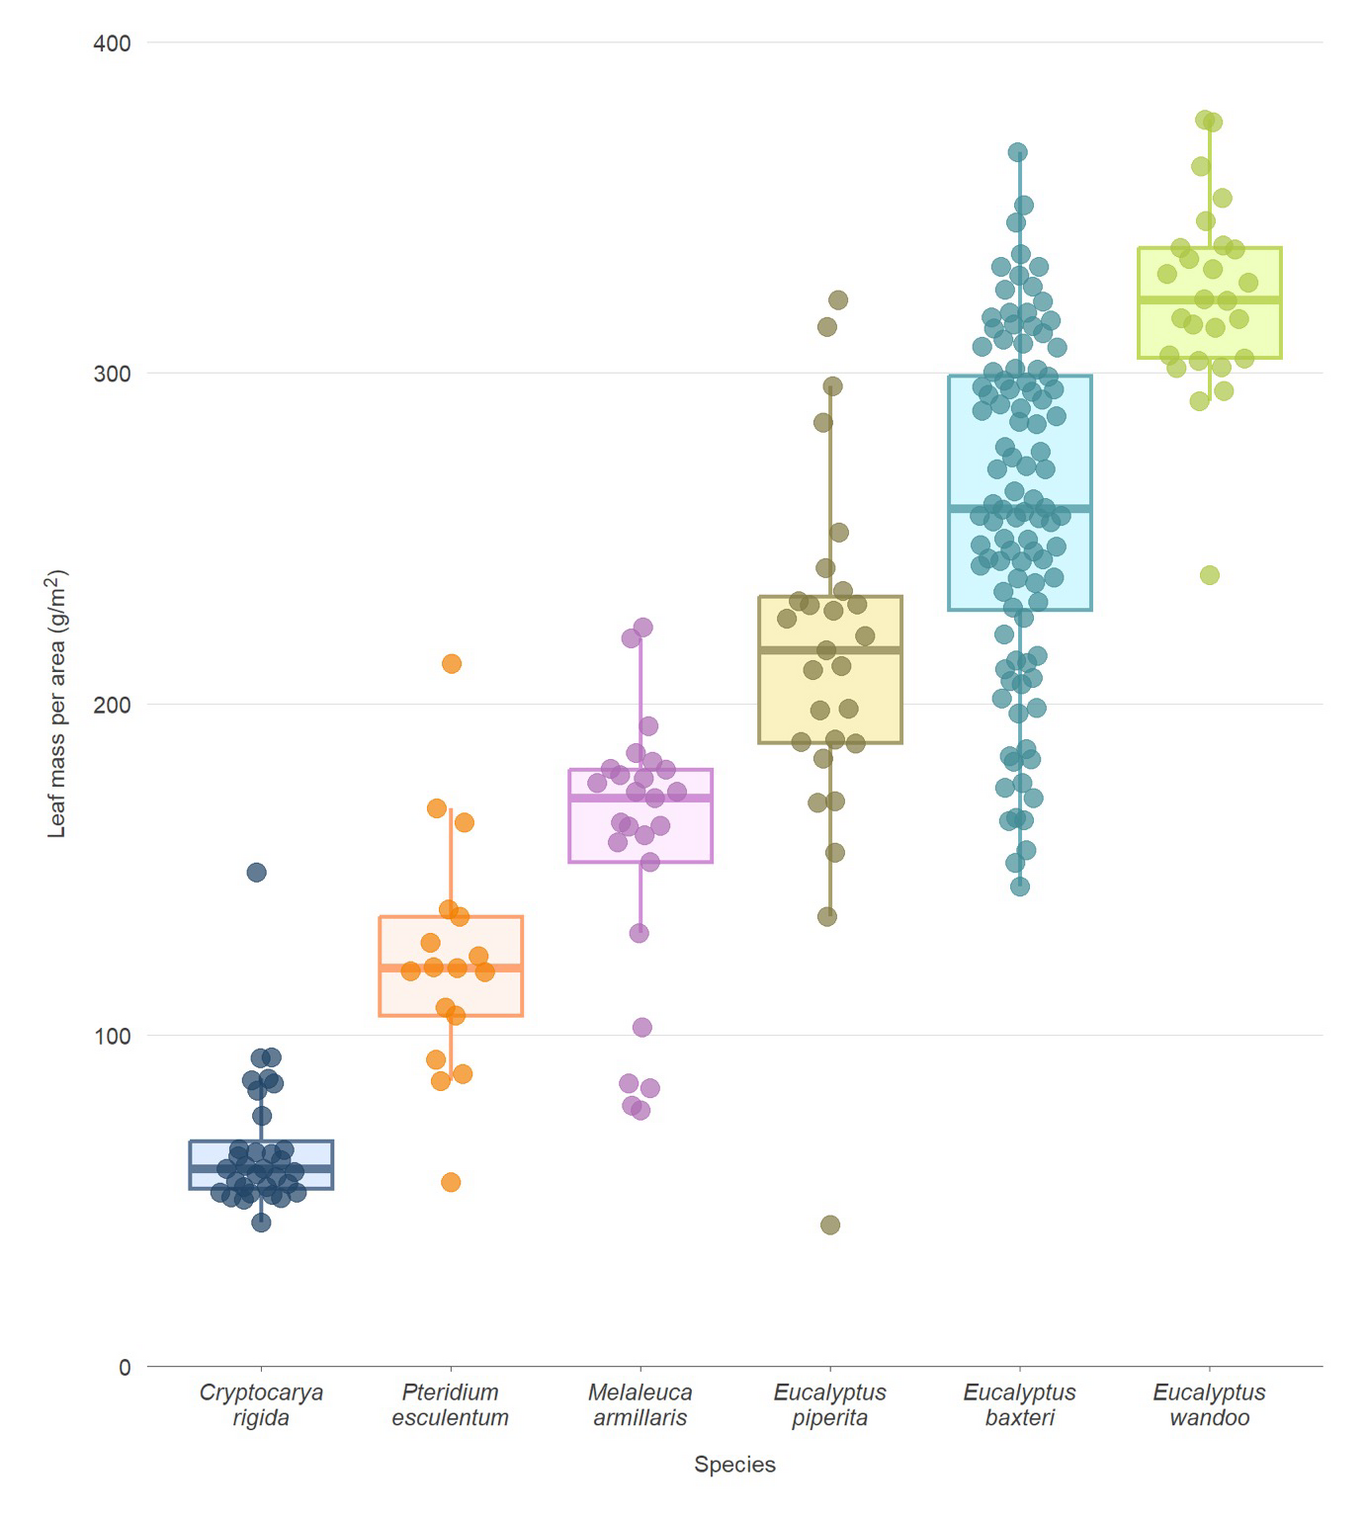
Dax Kellie · @daxkellie
56 followers · 12 posts · Server ecoevo.social
Learn how easy it is to make beeswarm and raincloud plots (more transparent alternatives to box plots) using {ggbeeswarm}, {ggdist} & {gghalves} in a new ALA Labs post by me & Shandiya Balasubramaniam
https://labs.ala.org.au/posts/2023-08-28_alternatives-to-box-plots/post.html
#rstats #dataviz #QuartoPub #austraits #ggplot2
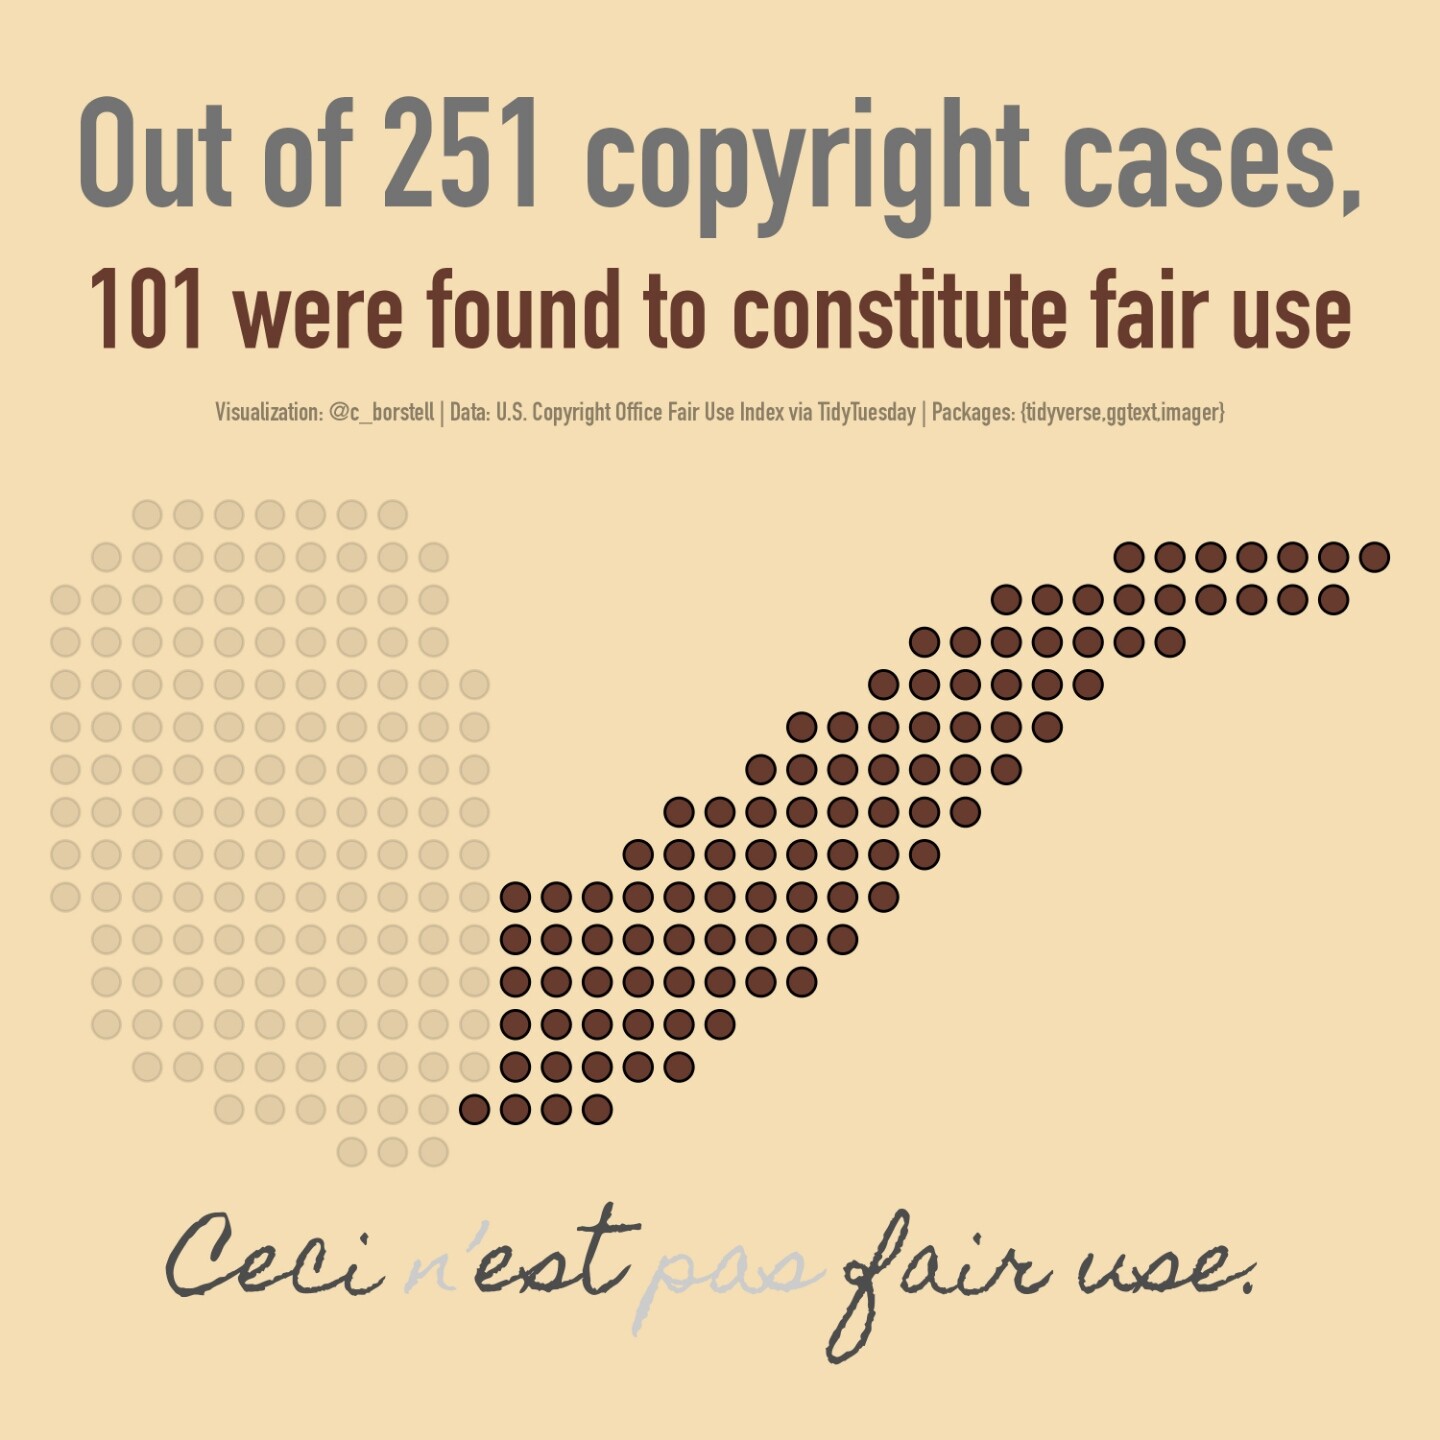
Calle Börstell · @c_borstell
173 followers · 38 posts · Server fediscience.org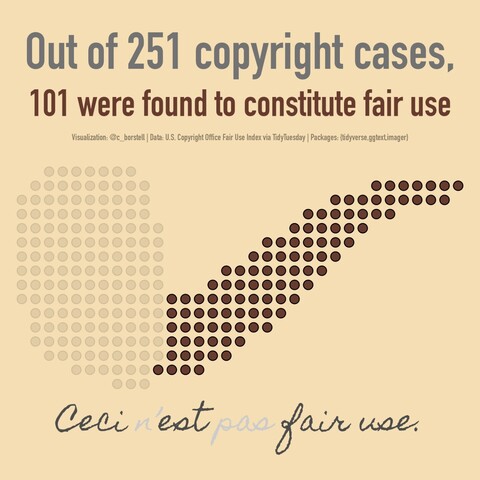
#TidyTuesday week 35: Fair Use Index
🔗: https://github.com/borstell/tidytuesday/tree/main/2023/2023-08-29/
#dataviz #ggplot2 #tidyverse #TidyTuesday

Datascience · @datascience
524 followers · 301 posts · Server genomic.social"Graphic Design with #ggplot2": All material from this 2 day workshop can be found at https://rstudio-conf-2022.github.io/ggplot2-graphic-design/ #rstats #design

Dan Couture · @mathyourlife
156 followers · 458 posts · Server mstdn.social
Meghan Harris · @meghansharris
388 followers · 258 posts · Server fosstodon.org
Steven P. Sanderson II, MPH · @stevensanderson
162 followers · 761 posts · Server mstdn.social

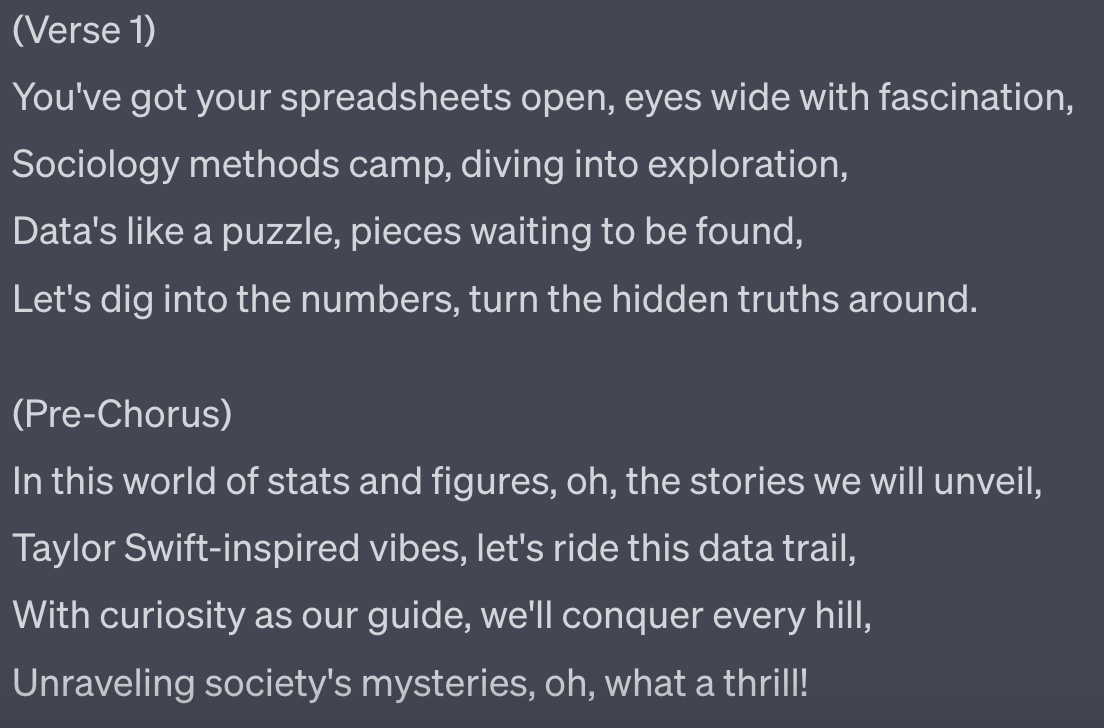
Angela Li · @angela
589 followers · 71 posts · Server fediscience.org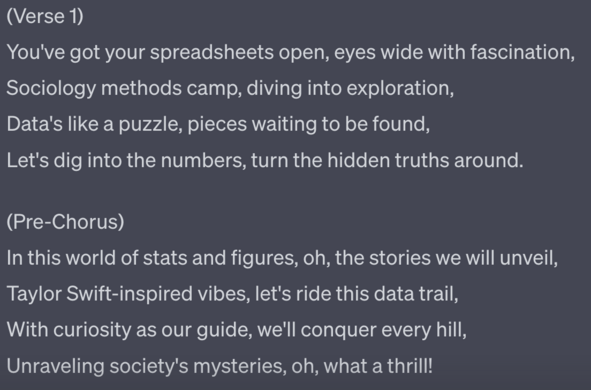
I demonstrated a few use cases for our grads (debugging a #ggplot2 error, asking #ChatGPT to list all the helper functions for the "select" function in the #tidyverse, translate Stata code to #rstats, etc).
But my absolute favorite example was when I prompted ChatGPT to write a song about data manipulation in the style of Taylor Swift. See results below...
#rstats #tidyverse #chatgpt #ggplot2

Umair Durrani · @transportationtalk
27 followers · 80 posts · Server fosstodon.org
Steven Ponce · @sponce1
0 followers · 26 posts · Server graphics.social
Here is my #viz for the #TidyTuesday challenge – W33. This one is spam emails.
.
This week's data comes from the Rdatasets package.
.
📂: https://github.com/poncest/tidytuesday/tree/main/2023/Week_33
.
#rstats | #r4ds | #tidyverse | #dataviz | #ggplot2
#viz #tidytuesday #rstats #r4ds #tidyverse #dataviz #ggplot2

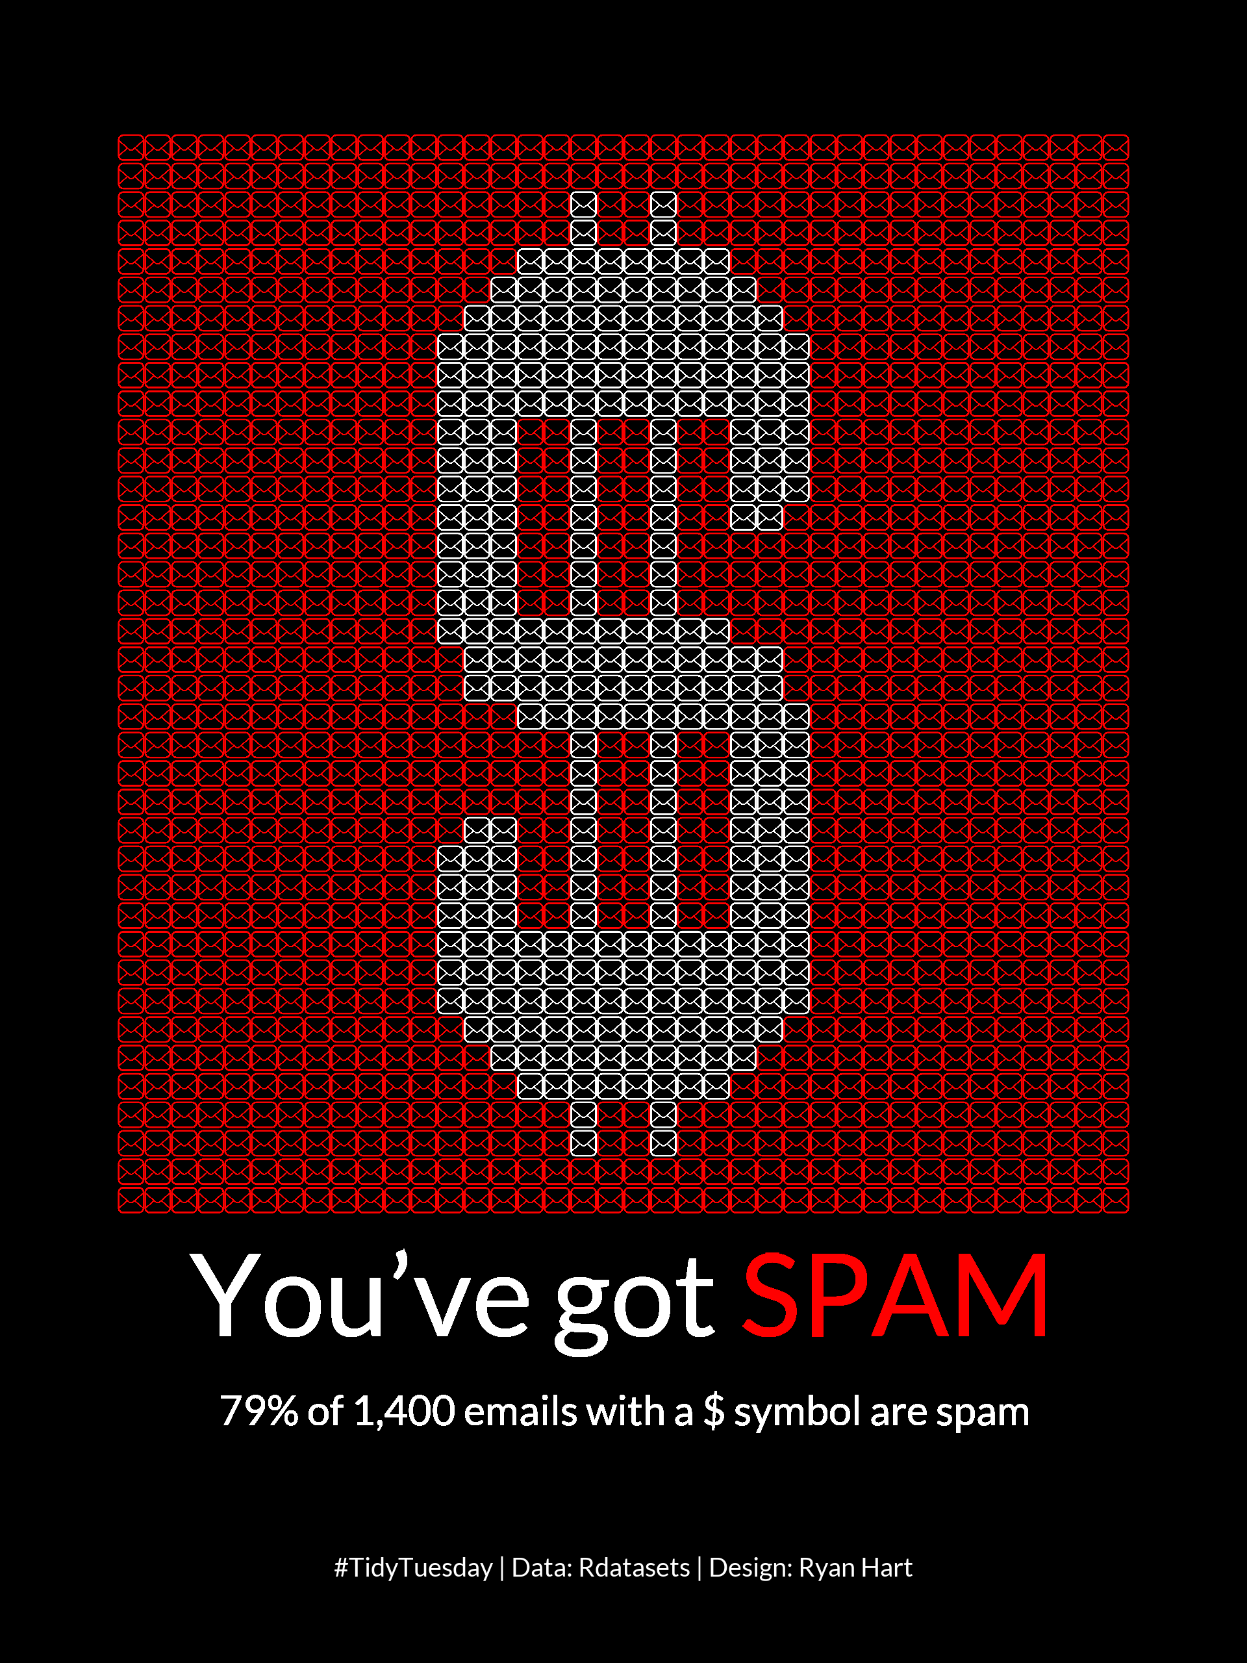
Ryan · @ryanahart
48 followers · 91 posts · Server fosstodon.org
#TidyTuesday | Week 33 | Spam Email
Subset of the Spam E-mail database included in the Rdatasets package
code: https://github.com/curatedmess/TidyTuesday/blob/main/2023/08152023/spam.R
#tidytuesday #rstats #dataviz #ggplot2