
Joseph Elfelt · @mappingsupport
575 followers · 500 posts · Server m.ai6yr.org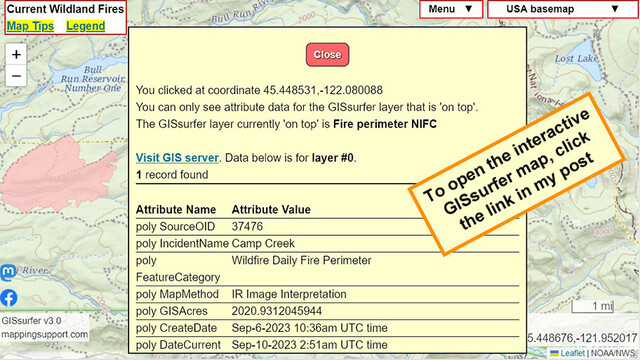
@ai6yr @WXFanatic @bretthoover
GISsurfer uses the #ArcGIS REST API.
For ArcGIS MapServer data that supports 'dynamic layers' that API makes it fairly easy to add labels to the map.
For ArcGIS FeatureServer data that API does not support labels.
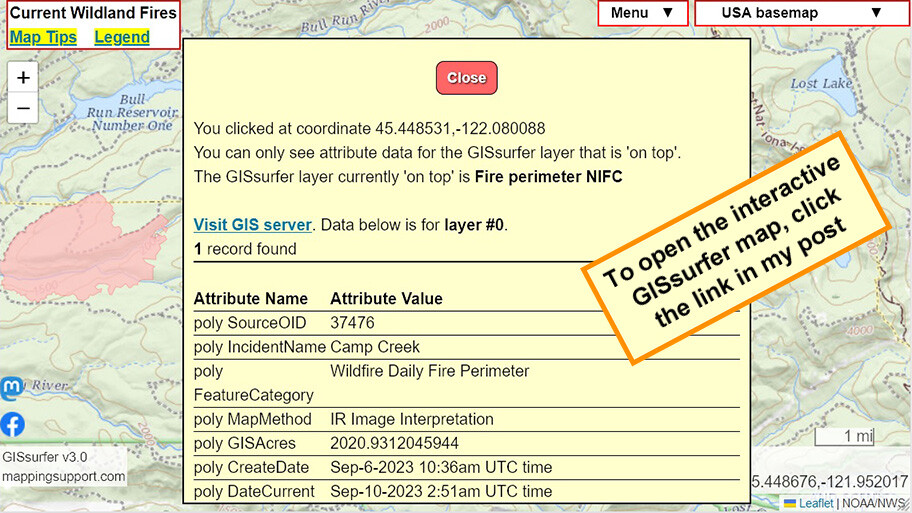
So the only way to see the fire name on a GISsurfer map is to click inside a perimeter. Note that the fire perimeter has to be the 'top' layer. #Wildfire
Open #GISsurfer map:
https://mappingsupport.com/p2/gissurfer.php?center=45.448676,-121.952017&zoom=12&basemap=USA_basemap&overlay=VIIRS_7_day,MODIS_7_day,State_boundary,Fire_perimeter_NIFC&data=https://mappingsupport.com/p2/special_maps/disaster/USA_wildland_fire.txt
Joseph Elfelt · @mappingsupport
571 followers · 497 posts · Server m.ai6yr.org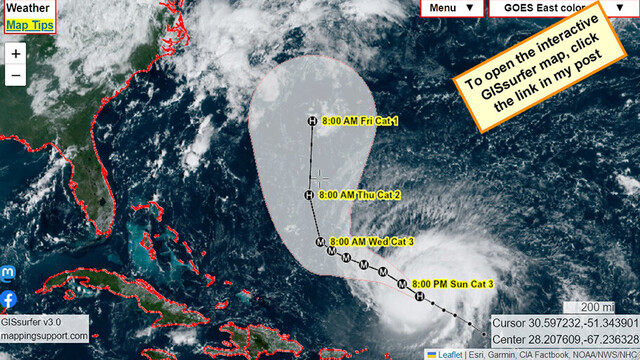
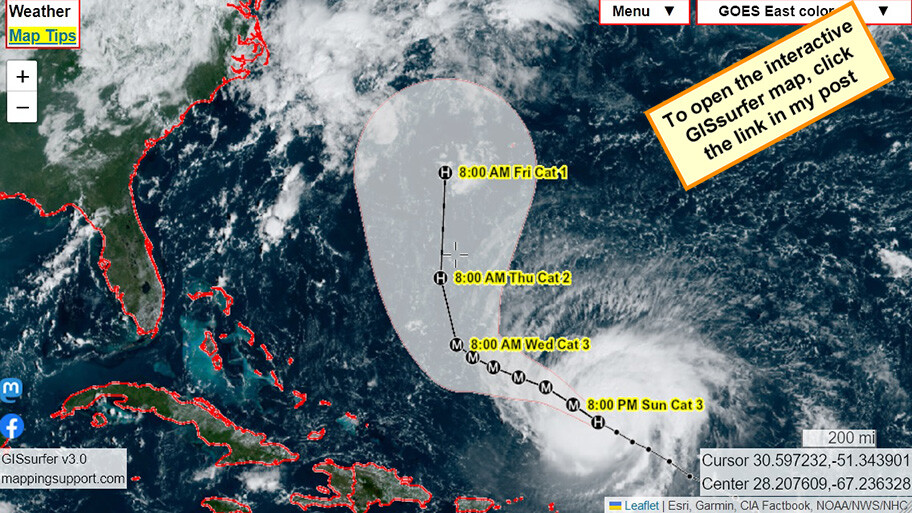
Each time you open this interactive #GIS map you will see the latest view of #HurricaneLee from the GOES East satellite.
#Hurricane
Open #GISsurfer map:
https://mappingsupport.com/p2/gissurfer.php?center=28.207609,-67.236328&zoom=5&basemap=GOES_East_color&overlay=Country,Forecast_error_cone,Hurricane/Storm_observed_track,Hurricane/Storm_observed_position,Hurricane/Storm_forecast_track,Hurricane/Storm_forecast_position&data=https://mappingsupport.com/p2/special_maps/disaster/USA_weather.txt
#gis #hurricanelee #hurricane #gissurfer
Joseph Elfelt · @mappingsupport
571 followers · 497 posts · Server m.ai6yr.org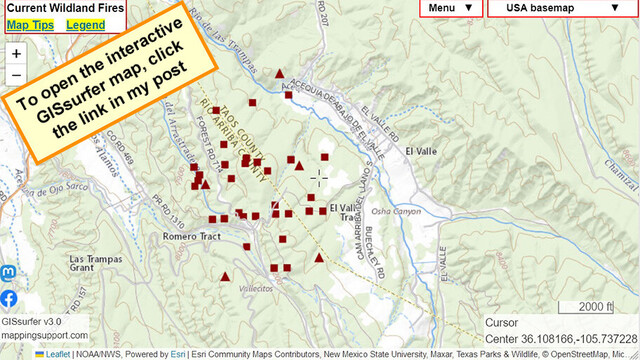
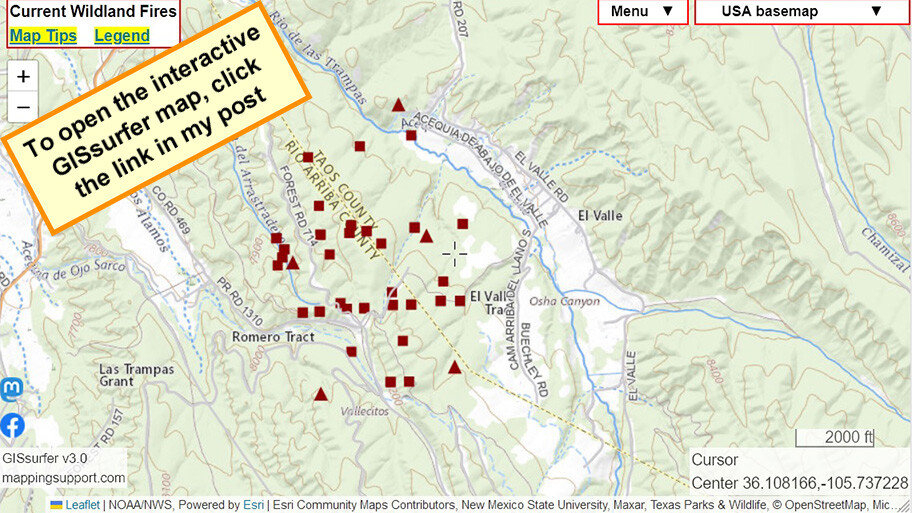
#ElValleFire, #NewMexico. NNE of Sante Fe.
Interactive #GIS map shows MODIS and VIIRS satellite heat detections. This data is *not* real time, locations are only approximate. Although detections are sometimes ‘false positive’, never rely on any map to ignore an order to evacuate
Click ‘Map tips’ for more info.
#NMFire #NMwx
Open #GISsurfer map:
https://mappingsupport.com/p2/gissurfer.php?center=36.108166,-105.737228&zoom=14&basemap=USA_basemap&overlay=VIIRS_7_day,MODIS_7_day,State_boundary,USA_roads&data=https://mappingsupport.com/p2/special_maps/disaster/USA_wildland_fire.txt
#elvallefire #newmexico #gis #nmfire #nmwx #gissurfer
Joseph Elfelt · @mappingsupport
571 followers · 497 posts · Server m.ai6yr.org
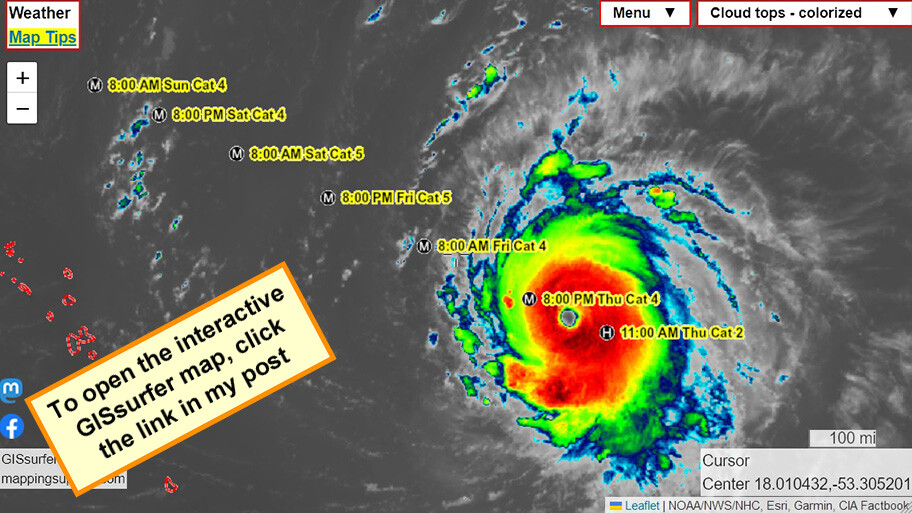
#HurricaneLee now forecast to reach #Category5 late on Friday.
Note the scale in the lower right corner of the map.
#Hurricane
Open #GISsurfer map:
https://mappingsupport.com/p2/gissurfer.php?center=18.010432,-53.305201&zoom=6&basemap=Cloud_tops_-_colorized&overlay=Hurricane/Storm_forecast_position,Country&data=https://mappingsupport.com/p2/special_maps/disaster/USA_weather.txt
#hurricanelee #category5 #hurricane #gissurfer
Joseph Elfelt · @mappingsupport
547 followers · 489 posts · Server m.ai6yr.org
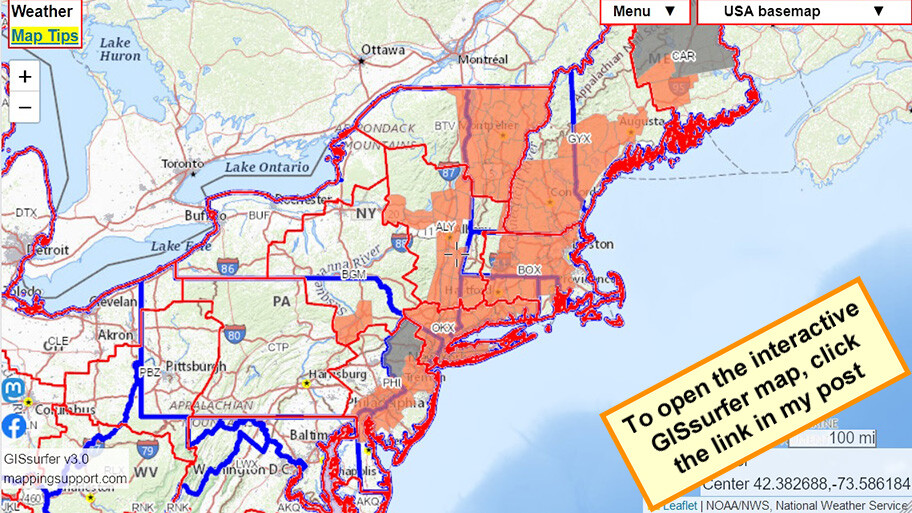
Got heat?
Orange areas have a heat advisory. NOAA’s ‘forecast discussion’ is one of the best weather explainers. To read it, open the map, click inside any red-outlined area, follow the link.
Map has *lots* of other #GIS weather layers you can turn on. Click “Map tips” upper left corner for help.
#Geospatial
Open #GISsurfer map:
https://mappingsupport.com/p2/gissurfer.php?center=42.382688,-73.586184&zoom=6&basemap=USA_basemap&overlay=State_boundary,Weather_watch_warning,Forecast_discussion&data=https://mappingsupport.com/p2/special_maps/disaster/USA_weather.txt
Joseph Elfelt · @mappingsupport
541 followers · 483 posts · Server m.ai6yr.org2/3 To make the KMZ files in my prior post I used #GISsurfer to take a series of screenshots that exactly adjoin. Each screenshot is 100% map. GISsurfer provides the georeference data.
Then I used photo editing software to stitch the screenshots together. Easy to do since the screenshots exactly adjoin.
Windows file manager was used to make the KMZ file by combining KML syntax (provided by GISsurfer) and the finished image.
Joseph Elfelt · @mappingsupport
536 followers · 476 posts · Server m.ai6yr.org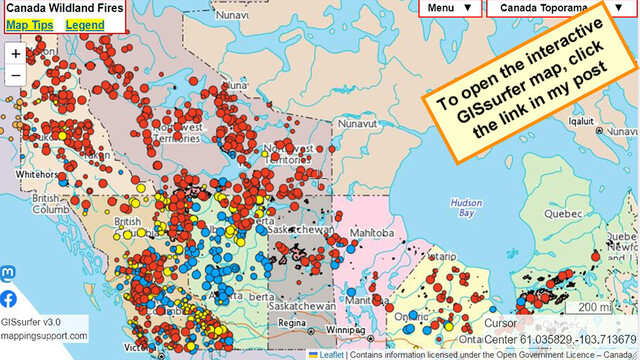
Remember hearing about #wildfires in #Canada this summer? It is still happening. Each red dot on this #GIS map is an uncontrolled #wildfire
Open #GISsurfer map:
https://mappingsupport.com/p2/gissurfer.php?center=61.035829,-103.713679&zoom=4&basemap=Canada_Toporama&overlay=CA_fire_perimeter,CA_active_fires&txtfile=https://mappingsupport.com/p2/special_maps/disaster/Canada_wildland_fire.txt
#wildfires #canada #gis #Wildfire #gissurfer
Joseph Elfelt · @mappingsupport
536 followers · 474 posts · Server m.ai6yr.org
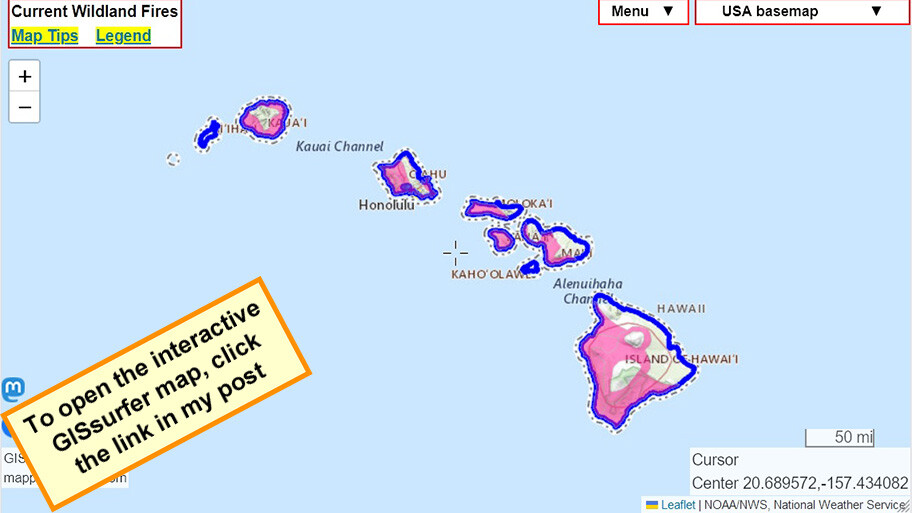
#RedFlagWarning for #Hawaii today.
For details - including timing - open the map, zoom in, click any red area, follow the link.
Click “Map tips” upper left corner for more info.
Open #GISsurfer map:
https://mappingsupport.com/p2/gissurfer.php?center=20.689572,-157.434082&zoom=7&basemap=USA_basemap&overlay=State_boundary,Red_flag_warning&data=https://mappingsupport.com/p2/special_maps/disaster/USA_wildland_fire.txt
#redflagwarning #hawaii #hifire #hiwx #gissurfer
Joseph Elfelt · @mappingsupport
536 followers · 474 posts · Server m.ai6yr.org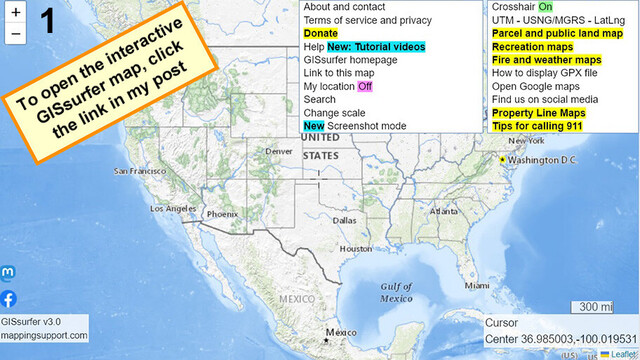
#GISsurfer tips
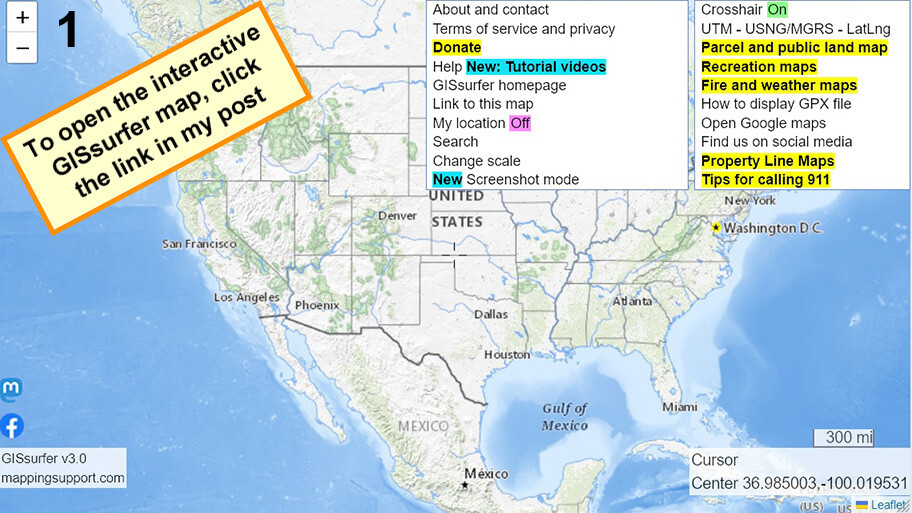
Link to open the default map:
https://mappingsupport.com/p2/gissurfer.php
If you click the Menu button then you see the choices in screenshot 1. Several choices lead to GISsurfer maps that display parcel lines, public land, wildfires, weather and various recreation maps.
If you click Menu > Link to this map, then you see a popup like in screenshot 2. That link will replicate the map on your screen.
Joseph Elfelt · @mappingsupport
509 followers · 442 posts · Server m.ai6yr.org
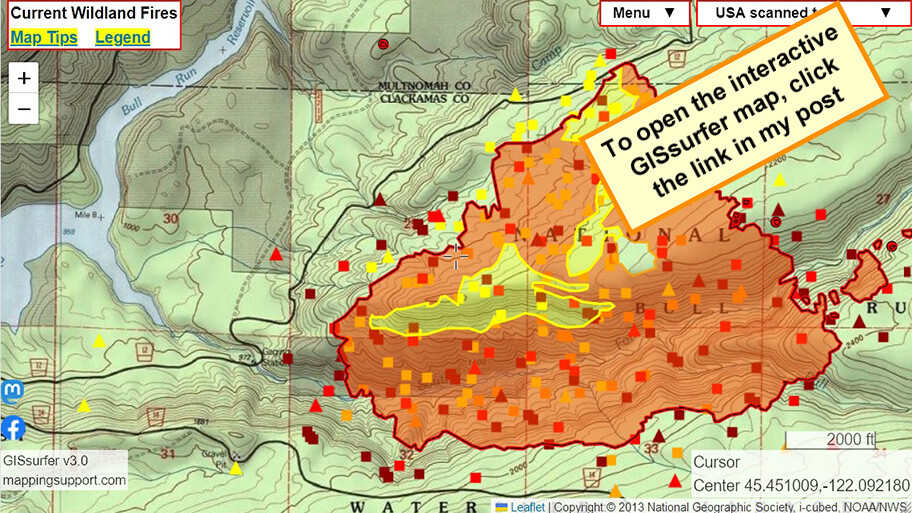
8/27 morning.
Interactive #GIS map for #CampCreekFire SE of #Portland Oregon
Infrared flight last night 10:19pm. IR analyst determined 1,226 acres burned.
Red shading = intense heat.
This watershed is #Portland water supply.
See links for “Map Tips” and “Legend” in upper left corner.
#ORwx #ORfire #WildlandFire
Open #GISsurfer map:
https://mappingsupport.com/p2/gissurfer.php?center=45.451009,-122.092180&zoom=14&basemap=USA_scanned_topo&overlay=VIIRS_7_day,MODIS_7_day,State_boundary&fire=OR,Campcreek&data=https://mappingsupport.com/p2/special_maps/disaster/USA_wildland_fire.txt
#gis #campcreekfire #portland #orwx #orfire #wildlandfire #gissurfer
Joseph Elfelt · @mappingsupport
509 followers · 441 posts · Server m.ai6yr.org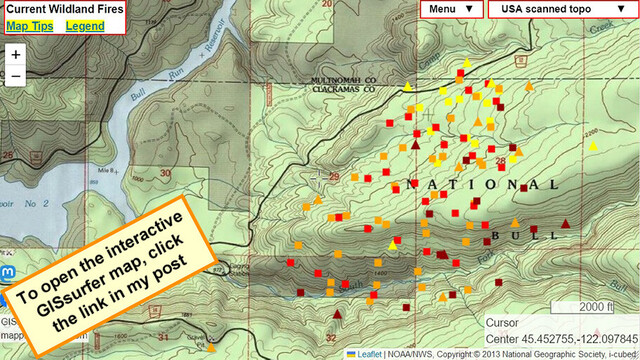
Interactive #GIS map for #CampCreekFire SE of #Portland Oregon and near that town’s water supply.
Dark red symbols are *heat* detections by MODIS and VIIRS satellites within prior 6 hours. This data is not real time, locations are approximate and sometimes ‘false positive”. Two links in upper left corner have more info.
#ORwx #ORfire #WildlandFire #Geospatial #Maps #Mapping #Leaflet #ArcGIS #WebMap
Open #GISsurfer map:
https://mappingsupport.com/p2/gissurfer.php?center=45.452755,-122.097845&zoom=14&basemap=USA_scanned_topo&overlay=VIIRS_7_day,MODIS_7_day,State_boundary&data=https://mappingsupport.com/p2/special_maps/disaster/USA_wildland_fire.txt
#gis #campcreekfire #portland #orwx #orfire #wildlandfire #geospatial #maps #mapping #leaflet #arcgis #webmap #gissurfer
Joseph Elfelt · @mappingsupport
507 followers · 437 posts · Server m.ai6yr.org
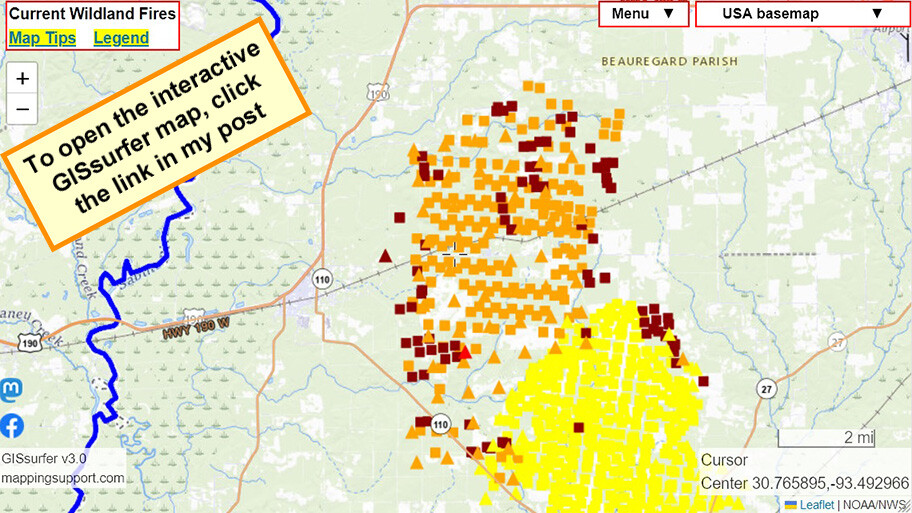
Interactive #GIS map for #TigerIslandFire in SW part of #Louisiana. Town of #Merryville just west of the fire has been evacuated.
Dark red symbols are *heat* detections by MODIS and VIIRS satellites within prior 6 hours. This data is not real time, locations are approximate and sometimes ‘false positive”. Two links in upper left corner have more info.
#LAwx #LAfire #WildlandFire #Geospatial #Maps #Mapping #Leaflet #ArcGIS #WebMap
Open #GISsurfer map:
https://mappingsupport.com/p2/gissurfer.php?center=30.765895,-93.492966&zoom=12&basemap=USA_basemap&overlay=VIIRS_7_day,MODIS_7_day,State_boundary,USA_roads&data=https://mappingsupport.com/p2/special_maps/disaster/USA_wildland_fire.txt
#gis #tigerislandfire #louisiana #merryville #lawx #lafire #wildlandfire #geospatial #maps #mapping #leaflet #arcgis #webmap #gissurfer
Joseph Elfelt · @mappingsupport
504 followers · 433 posts · Server m.ai6yr.org
#RedFlagWarning includes *west* slopes of Cascade Mountains.
For details - including timing - open the map, zoom in, click your area of interest, follow the link.
Click “Map tips” upper left corner for more info.
#PNW #WAfire #WAwx #ORfire #ORwx #CAfire #CAwx #Wildfire #GIS
Open #GISsurfer map:
https://mappingsupport.com/p2/gissurfer.php?center=44.237006,-122.563477&zoom=6&basemap=USA_basemap&overlay=State_boundary,Weather_watch_warning&data=https://mappingsupport.com/p2/special_maps/disaster/USA_weather.txt
#redflagwarning #pnw #wafire #wawx #orfire #orwx #cafire #cawx #Wildfire #gis #gissurfer
Joseph Elfelt · @mappingsupport
498 followers · 430 posts · Server m.ai6yr.org
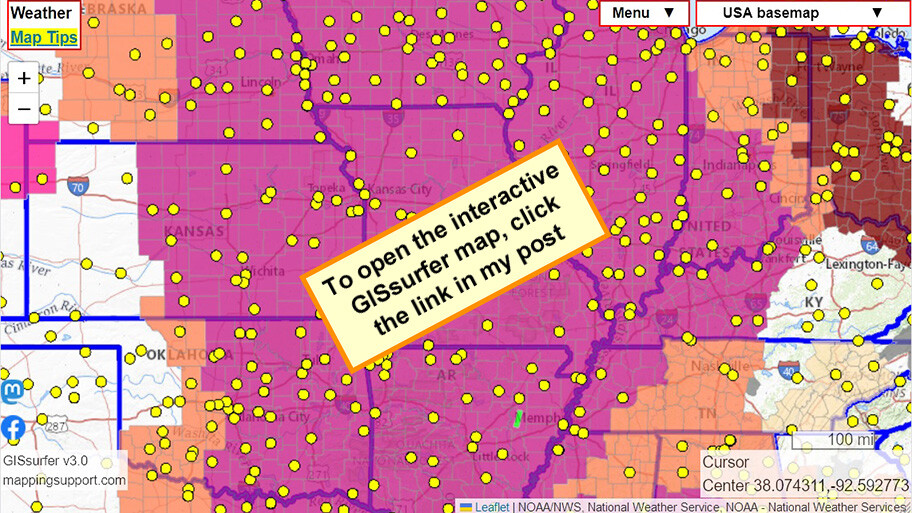
Misery index.
Open the map, click any yellow dot, follow the link, look at the column labeled “Heat index”.
The screen shot is for Kansas City. I just picked this one randomly.
#heatwave
Edit: Forgot to mention that it is about 65 degrees coming up on 1pm here near Redmond WA. Partly sunny. Showers expected later.
Open #GISsurfer map:
https://mappingsupport.com/p2/gissurfer.php?center=38.074311,-92.592773&zoom=6&basemap=USA_basemap&overlay=State_boundary,Weather_watch_warning,Weather_station_NWS&data=https://mappingsupport.com/p2/special_maps/disaster/USA_weather.txt
Joseph Elfelt · @mappingsupport
483 followers · 415 posts · Server m.ai6yr.org
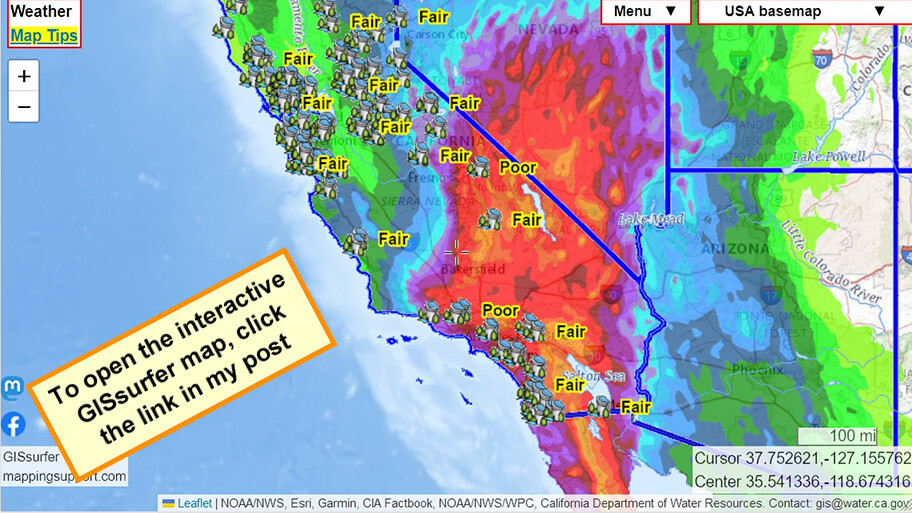
Interactive #GIS map always shows estimate for rain over next 3 days. Also shows dams that are *not* rated “satisfactory” and where the state has some jurisdiction. Click any dam for details.
To get the most benefit from the map please read the “Map tips” link in upper left corner.
#HurricaneHilary #hurricane #hilary #CAwx #NVwx #FlashFlood
Open #GISsurfer map:
https://mappingsupport.com/p2/gissurfer.php?center=35.541336,-118.674316&zoom=6&basemap=USA_basemap&overlay=Country,Rain_forecast_day_1-3,State_boundary,Lake_river_stream,USA_roads,California_unsatisfactory_dam&data=https://mappingsupport.com/p2/special_maps/disaster/USA_weather.txt
#gis #hurricanehilary #hurricane #hilary #cawx #nvwx #flashflood #gissurfer
Joseph Elfelt · @mappingsupport
481 followers · 414 posts · Server m.ai6yr.org
Each time you open this interactive #GIS map it shows the latest view from the GOES West satellite.
To read NOAA's forecast discussion click in any red-outlined area and follow the link.
Map has *lots* of weather layers you can turn on including streamgages and weather stations. Both of those layers lead to near real time data. Need help? Click “Map tips” upper left corner.
#HurricaneHilary #hurricane #hilary #CAwx #NVwx #FlashFlood
Open #GISsurfer map:
https://mappingsupport.com/p2/gissurfer.php?center=35.637274,-100.810547&zoom=4&basemap=GOES_West_color&overlay=Country,State_boundary,Weather_watch_warning,Forecast_discussion&data=https://mappingsupport.com/p2/special_maps/disaster/USA_weather.txt
#gis #hurricanehilary #hurricane #hilary #cawx #nvwx #flashflood #gissurfer
Joseph Elfelt · @mappingsupport
481 followers · 413 posts · Server m.ai6yr.org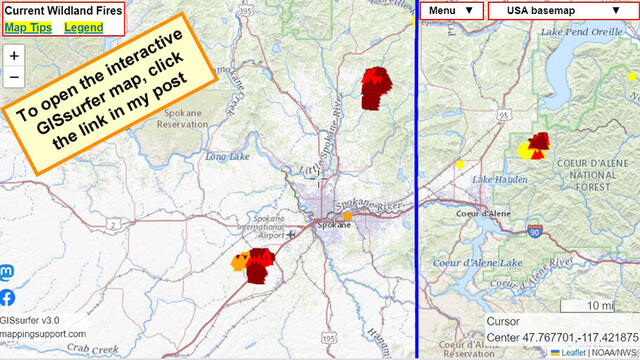
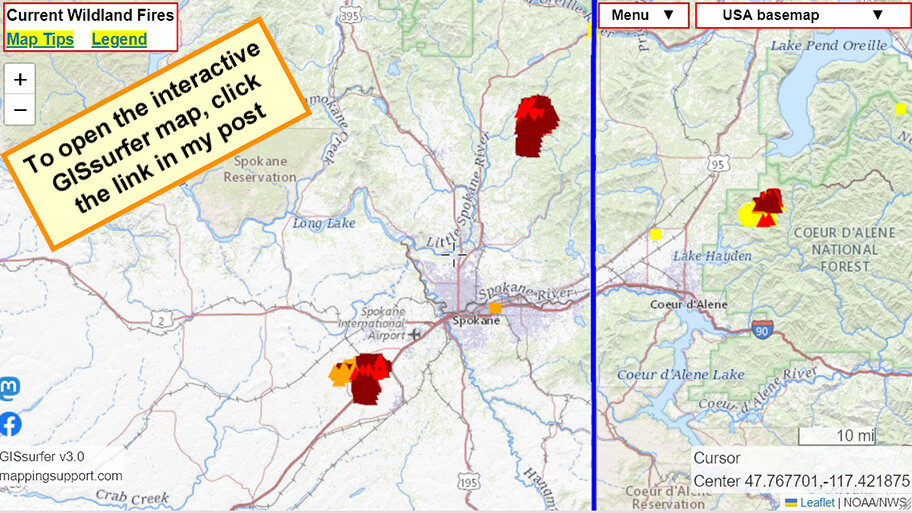
Interactive #GIS map shows MODIS/VIIRS satellite heat detections for #GrayFire SW of Spokane Washington and #OregonRoadFire north of Spokane. Zoom in for details.
Dark red = heat detection within prior 6 hours.
To learn more about MODIS/VIIRS click “Map tips” upper left corner.
Open #GISsurfer map:
https://mappingsupport.com/p2/gissurfer.php?center=47.767701,-117.421875&zoom=9&basemap=USA_basemap&overlay=VIIRS_7_day,MODIS_7_day,State_boundary&data=https://mappingsupport.com/p2/special_maps/disaster/USA_wildland_fire.txt
#gis #grayfire #oregonroadfire #gissurfer
Joseph Elfelt · @mappingsupport
480 followers · 412 posts · Server m.ai6yr.org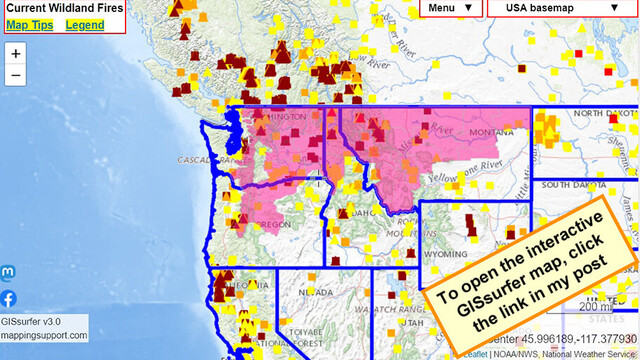
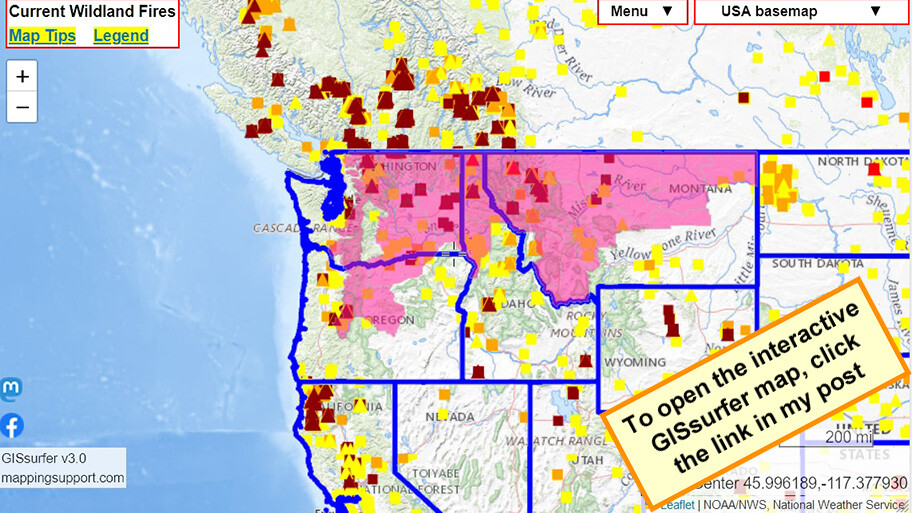
#RedFlagWarning includes *west* slopes of Cascade Mountains.
For details open the map, zoom in, click your area of interest, follow the link.
Click “Map tips” upper left corner for more info.
#PNW #WAfire #WAwx #ORfire #ORwx #IDfire #IDwx #MTfire #MTwx #Wildfire #GIS
Open #GISsurfer map:
https://mappingsupport.com/p2/gissurfer.php?center=46.148533,-115.048828&zoom=5&basemap=USA_basemap&overlay=VIIRS_7_day,MODIS_7_day,State_boundary,Red_flag_warning&data=https://mappingsupport.com/p2/special_maps/disaster/USA_wildland_fire.txt
#redflagwarning #pnw #wafire #wawx #orfire #orwx #idfire #idwx #mtfire #mtwx #Wildfire #gis #gissurfer
Joseph Elfelt · @mappingsupport
480 followers · 411 posts · Server m.ai6yr.org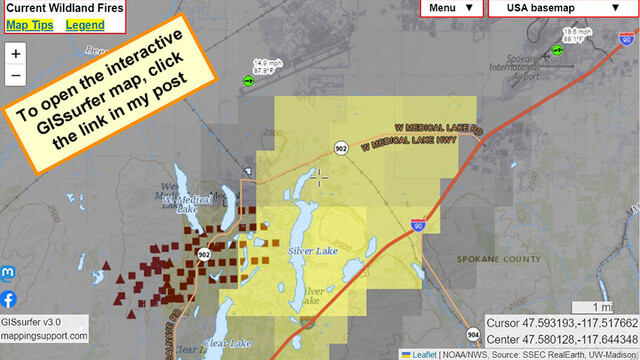
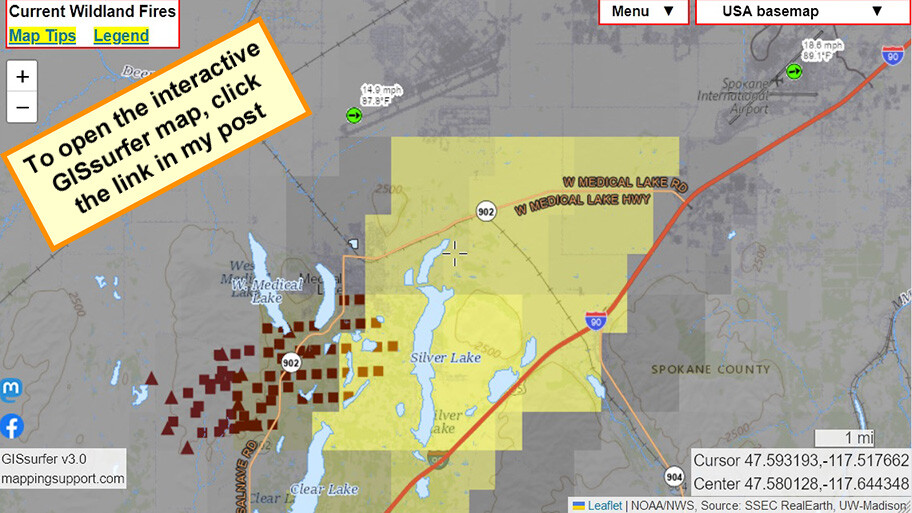
Latest satellite heat detections for #GrayFire Spokane County, WA. Large yellow squares are detections by GOES satellite. Some of that data is likely smoke but not fire on the ground - at least yet.
Never rely on any map to ignore an order to evacuate.
I-90 closed in both directions.
Green symbols are clickable for weather data including wind gust speed. #WAfire #WAwx #Wildfire
Open #GISsurfer map:
https://mappingsupport.com/p2/gissurfer.php?center=47.580128,-117.644348&zoom=12&basemap=USA_basemap&overlay=State_boundary,MODIS_7_day,VIIRS_7_day,GOES_west_fire_enhanced,Lake_river_stream,USA_roads,Wind_temperature_and_more...&data=https://mappingsupport.com/p2/special_maps/disaster/USA_wildland_fire.txt
#grayfire #wafire #wawx #Wildfire #gissurfer
Joseph Elfelt · @mappingsupport
479 followers · 410 posts · Server m.ai6yr.org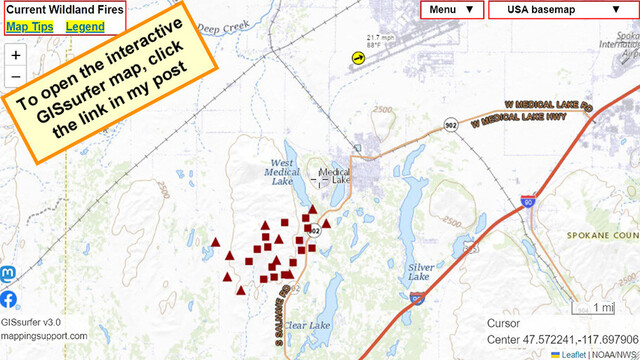
Interactive #GIS map for #GrayFire Spokane County, WA. Town of #MedicalLake (pop 5,000+) ordered to evacuate *now*.
Weather station at airport just to the north shows WSW wind gusting to 31mph. I see reports fire has already jumped the lake on the west side of town.
To get the most benefit from the map see 2 links upper left corner.
#WAfire #WAwx #Wildfire #GIS #Geospatial #Maps #Mapping #Leaflet #ArcGIS #WebMap
Open #GISsurfer map:
https://mappingsupport.com/p2/gissurfer.php?center=47.568592,-117.688465&zoom=13&basemap=USA_imagery&overlay=State_boundary,USA_roads,MODIS_7_day,VIIRS_7_day,Fire_perimeter_NIFC&data=https://mappingsupport.com/p2/special_maps/disaster/USA_wildland_fire.txt
#gis #grayfire #medicallake #wafire #wawx #Wildfire #geospatial #maps #mapping #leaflet #arcgis #webmap #gissurfer