
.:. brainsik · @brainsik
63 followers · 404 posts · Server hachyderm.io

theStoicGurn (he/him) · @theStoicGurn
3 followers · 124 posts · Server disabled.socialML/AI/graphing ain't all that. Yet.
Spotify keeps trying to tell me what I want and what I want is to finish this single, ridiculous day-long playlist that's the story - in flashback and flashforward* - of how I got an AI to fall for and then dump me, told in and with the songs I used to make woo and lament.
Keep trying though, the machines. We might yet get life imitating art.
#ML #graphing #AI #music #Spotify #etc
*It's not close to finished, and if I make it chronological it never will be
#ml #graphing #ai #music #spotify #etc

Earth To Ria 🛸 · @EarthToRia
550 followers · 902 posts · Server mindly.socialDesmos is the best thing since sliced bread!
No need for expensive graphing calculators anymore.
Incredibly, the Ti-84 is the same price it was back in 1998, lol.

Haojia Wu · @haojiawu
123 followers · 30 posts · Server mastodon.haojia-wu.comWow, R plots in a second with an AI-powered app, RTutor, developed by Steven Ge team! Totally blown away after several trials on my own dataset. This is a life saver, especially when you want a quick look on your data.
#ChatGPT #rstats #graphing #AI
http://rtutor.ai
#chatgpt #rstats #graphing #ai

GenghisKen Coar · @GenghisKen
16 followers · 62 posts · Server ruby.social@adnan @timhutton @aallan
Selectively, one hopes.
Personally, I just want my #birdsocial archives for A) searchable reference, and B) connexion #graphing.
(Amusingly enough, autocorrect initially turned "#birdsocial" into "#botdsocial". 🤣)
#birdsocial #graphing #botdsocial

Boiling Steam · @boilingsteam
2990 followers · 7723 posts · Server mastodon.cloudVirtual Graph Paper: https://virtual-graph-paper.com/ #webapp #virtualgraphpaper #graphing
#webapp #virtualgraphpaper #graphing

Darrin L Rogers · @DarrinLRogers
50 followers · 70 posts · Server fediscience.org
Oh god why am I #graphing instead of doing my actual work?
Anyway, here's the graph.
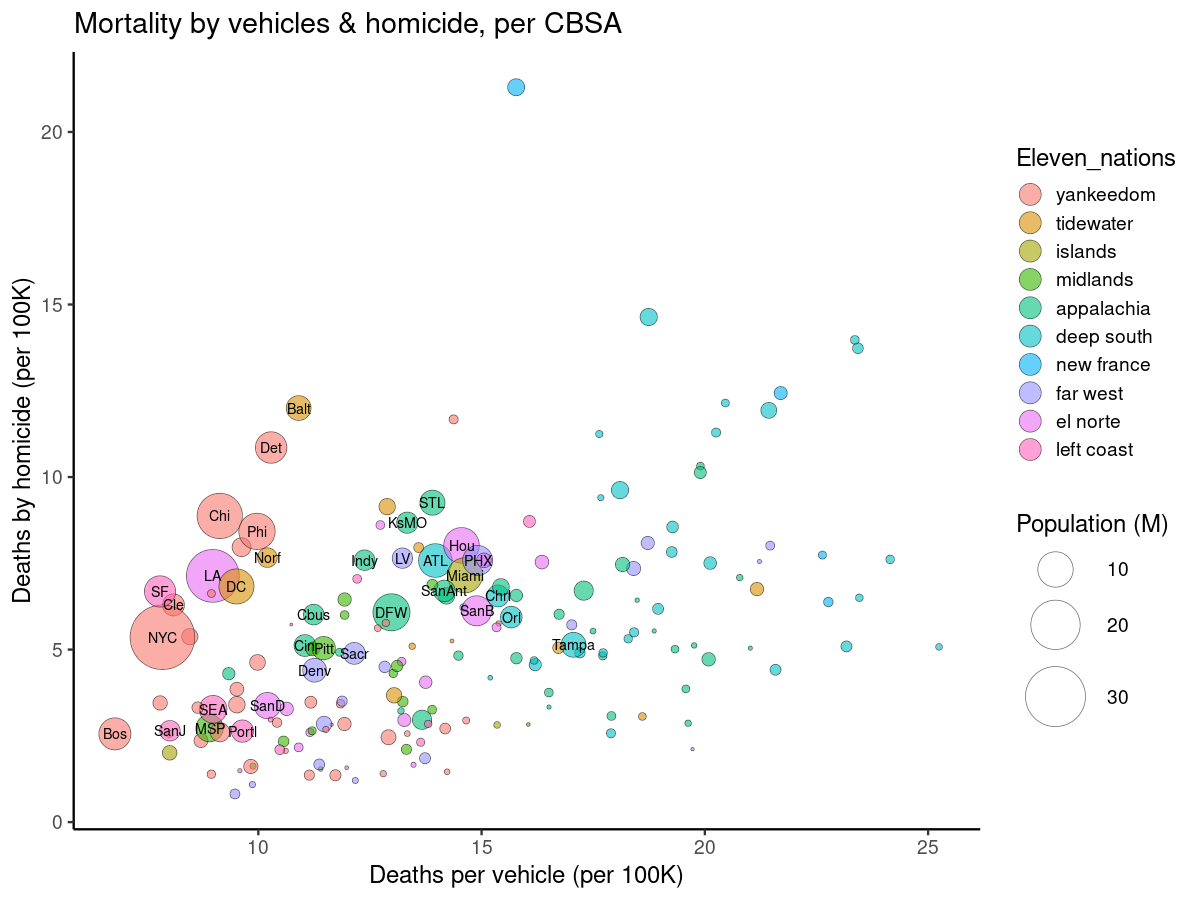
My contribution to a twitter convo about which major cities in the US are safest. The data comes from the CDC Wonder service: Compressed Mortality.
Each point is a CBSA (a census-based statistical area; i.e., a metro area). The circle sizes are proportionate to population. I added colors for Woodward's "11 American nations."
Absolutely do not base your life decisions on this graph. I accept no responsibility

FOSSlife · @FOSSlife
865 followers · 1026 posts · Server mastodon.fosslife.org
As data rapidly expands, Gartner research forecasts exponential growth of graph technology https://buff.ly/3oCL1Pz #data #Gartner #graphing #GraphDatabase #database #Analytics
#Analytics #database #GraphDatabase #graphing #Gartner #data
FOSSlife · @FOSSlife
864 followers · 1026 posts · Server mastodon.fosslife.org
This tutorial from Juni Learning shows you how to graph survey data in Python https://buff.ly/3mbbhzl #Python #DataScience #tutorial #beginners #coding #graphing #JuniLearning
#JuniLearning #graphing #coding #beginners #tutorial #datascience #Python

2877133136 · @2877133136
1 followers · 13801 posts · Server 285936586.masto.hostA 3D graphing calculator which lets the user enter a function which can return complex values.
OscarLitorell/complex-graphing: A 3D graphing calculator which lets the user enter a function which can return complex values.
https://github.com/OscarLitorell/complex-graphing
#JavaScript #calculator #graphing #3D
2877133136 · @2877133136
1 followers · 13750 posts · Server 285936586.masto.hostCemetech | Tools | SourceCoder 3
https://www.cemetech.net/sc/
#Cemetech #Cemetech.net #Kerm_Martian #KermMartian #Doors_CS #TI-83+ #TI-84+ #programming #graphing #calculator #BASIC #ASM
#ASM #BASIC #calculator #graphing #programming #TI #Doors_CS #KermMartian #Kerm_Martian #Cemetech

Dick Smiths Fair Go Supporters · @dsfgs
178 followers · 12401 posts · Server activism.openworlds.info@dredmorbius
"The human-moderators issue becomes less problematic if there are at least multiple authorities fully independent of one another."
This is how #i2p addressing works, if we're not mistaken. Also a #fourColoured #graphing method. It can take a few minutes for someone to have access to #i2pWebsites after performing the command, 'i2prouter start'.
Interested in #humanReadable? Then check it out :)
#i2p #fourColoured #graphing #i2pWebsites #humanReadable #i2prouter #decentralisation #internet #meshnet