brozu ▪️ · @brozu
98 followers · 769 posts · Server mastodon.unoTutorial su come NON fare un analisi di un calciatore in una singola partita di #calcio.
Passo 1 - specifica le percentuali dei passaggi riusciti senza indicare quanti sono i totali.
Passo 2 - metti un #heatmap a caso che non ho capito cosa diamine dovrebbe indicare tranne il fatto di come si sia mosso in campo. Quindi, ok: abbiamo scoperto che si muove.
#dataanalysis #dataviz #footballdata #seriea #Reijnders #bologna #BolognaMilan
#calcio #heatmap #dataanalysis #dataviz #footballdata #seriea #reijnders #bologna #BolognaMilan
Peter Czanik · @PCzanik
304 followers · 548 posts · Server fosstodon.orgYou can create a #heatmap of network #attackers using #syslog_ng, #GeoIP and #Kibana. Is it just eye candy? Do you have any practical use for it? I am curious about your opinion / #experience with attack heat maps!
#heatmap #attackers #syslog_ng #geoip #kibana #experience
Thomas Mielke :verified: · @thomas
201 followers · 1024 posts · Server mielke.social@cycleholic_
So sieht das bei mir hier in der Umgebung nach knapp 15.000 Laufkilometern aus...
#Strava #Heatmap
Tim Hinkle · @thinkle
2 followers · 1 posts · Server urbanists.socialYesterday I surpassed 3,500 miles since I started tracking rides in 2019 using the Bike Citizens app. Most of those miles have been #BikeCommuting in #Detroit, but it also takes in rides in #NYC, #Milwaukee, #Amsterdam, #Groningen, #Eindhoven and #Haarlem.
#bikes #BikeTooter #HeatMap #ciclismo #fiets #fietsen #fietser #bicicletta #AndareinBici
#bikecommuting #detroit #nyc #Milwaukee #amsterdam #groningen #eindhoven #haarlem #bikes #BikeTooter #heatmap #ciclismo #fiets #fietsen #Fietser #bicicletta #andareinbici
K2 · @Krosen_nw
1192 followers · 16153 posts · Server mindly.socialElias Dabbas :verified: · @elias
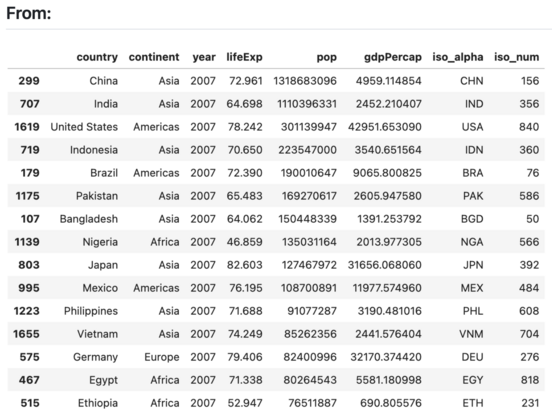
55 followers · 81 posts · Server seocommunity.socialFirst steps at visualizing tables in a clear and (hopefully) beautiful way.
Get/edit the code here:
#DataScience #DataVisualization #Plotly #Barchart #Heatmap #Python
#datascience #datavisualization #plotly #barchart #heatmap #python
Natenom · @natenom
2268 followers · 34 posts · Server social.anoxinon.deEine #Heatmap aus #GPX-Dateien erstellen – Mit einem #Python-Tool
Man braucht übrigens kein Strava, das Tool referenziert damit nur die bekannten Strava Heatmaps übern Namen.
Nur die Kacheln für die Karte werden von #OpenStreetMap heruntergeladen.
https://natenom.de/2023/06/eine-headmap-aus-gpx-dateien-erstellen-mit-einem-python-tool/
#heatmap #gpx #python #openstreetmap #fahrrad
Heiko · @ostfriese
142 followers · 4582 posts · Server social.tchncs.de#Strava #heatmap feature can be #abused to find home #addresses https://www.bleepingcomputer.com/news/security/strava-heatmap-feature-can-be-abused-to-find-home-addresses/
#addresses #abused #heatmap #strava
Ansgar Schmidt :verified: · @Ansi
509 followers · 1598 posts · Server mastodon.cloudJWST Scans an Ultra-Hot Jupiter’s Atmosphere https://www.universetoday.com/161719/jwst-scans-an-ultra-hot-jupiters-atmosphere/ #exoplanetatmospheres #ultra-hotjupiters #atmosphere #exoplanets #astronomy #wasp-18b #heatmap #niriss #heat #jwst
#exoplanetatmospheres #ultra #atmosphere #exoplanets #astronomy #wasp #heatmap #NIRISS #heat #jwst
Santi Raumdeuter :arsenal: · @raumdeuter
119 followers · 1077 posts · Server arsenalfc.socialgeoObserver · @geoObserver
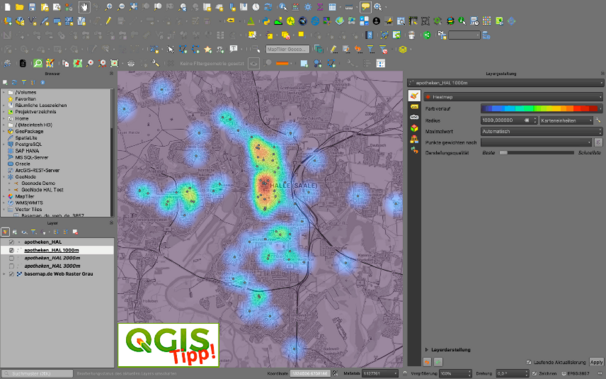
345 followers · 219 posts · Server mastodon.socialQGIS-Tipp: Heatmaps oder die Apotheken von Halle https://geoobserver.wordpress.com/2023/02/22/qgis-tipp-heatmaps-oder-die-apotheken-von-halle/ #heatmap #qgis #switch2qgis #gistribe #gischat #fossgis #foss4g #OSGeo #DataViz #opensource #spatial #geospatial #opendata #open #data #mapping #gis #geo #geoObserver
#heatmap #qgis #switch2qgis #gistribe #gischat #fossgis #foss4g #osgeo #dataviz #opensource #spatial #geospatial #opendata #open #data #mapping #gis #geo #geoobserver
geoObserver · @geoObserver
345 followers · 219 posts · Server mastodon.socialQGIS-Tipp: Heatmaps oder die Apotheken von Halle https://geoobserver.wordpress.com/2023/02/22/qgis-tipp-heatmaps-oder-die-apotheken-von-halle/ #heatmap #qgis #switch2qgis #gistribe #gischat #fossgis #foss4g #OSGeo #DataViz #opensource #spatial #geospatial #opendata #open #data #mapping #gis #geo #geoObserver
#heatmap #qgis #switch2qgis #gistribe #gischat #fossgis #foss4g #osgeo #dataviz #opensource #spatial #geospatial #opendata #open #data #mapping #gis #geo #geoobserver
Natenom · @natenom
2116 followers · 115 posts · Server social.anoxinon.deDas Programm #GoldenCheetah kann von Haus aus eine #Heatmap erzeugen.
Leider nur mit #GoogleMaps als Kartenmaterial, obwohl sonstige Karten mit #OpenStreetMap gefüttert werden.
Veröffentlichen darf man das so leider nicht. Und es wird "For developing only..." überall eingeblendet.
Gibts Tricks, damit das Programm auch bei der Heatmap OSM verwendet?
#Fahrrad #Training #Mobilität #Auswertung @fedibikes
Danke 😊
#goldencheetah #heatmap #googlemaps #openstreetmap #fahrrad #training #mobilitat #auswertung
El Uatu · @EL_Uatu
110 followers · 395 posts · Server genart.socialSomething noticeable on Solana...
#python #matplotlib #seaborn #heatmap #data
#python #matplotlib #seaborn #heatmap #data
buwel · @buwel
111 followers · 1495 posts · Server social.tchncs.deZu dem Thema:
Hat #Strava die #Heatmap jetzt komplett in den kostenpflichtigen Bereich geschoben?
Die waren für #OSM sehr hilfreich
#OpenStreetMap
#openstreetmap #osm #heatmap #strava
neko · @neko
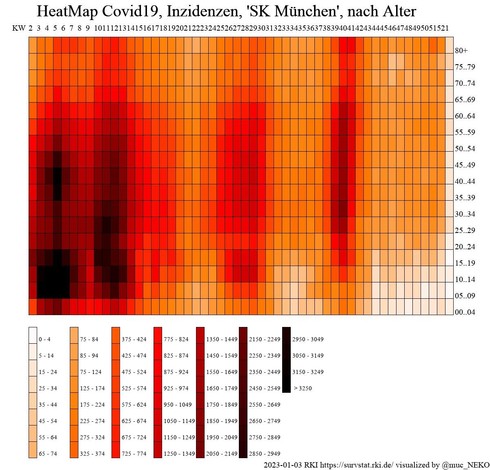
31 followers · 135 posts · Server muenchen.social#MUC #Muenchen #HeatMap #COVID19 #Inzidenzen nach Alter
#CoronaMUC @CoronaMUC
Daten: 03.01.2023 (RKI / https://survstat.rki.de/ )
Inzidenzen-Top4:
KW01 Meldetag 1/7:
75..79: 43.55
80+: 29.99
55..59: 27.29
25..29: 30.05
KW01:
00..04: 10.16
05..09: 4.43
10..14: 6.68
15..19: 1.67
20..24: 14.89
25..29: 30.05
30..34: 16.21
35..39: 20.40
40..44: 20.30
45..49: 20.27
50..54: 24.26
55..59: 27.29
60..64: 18.20
65..69: 16.38
70..74: 20.68
75..79: 43.55
80+: 29.99
#coronamuc #inzidenzen #COVID19 #heatmap #muenchen #muc
neko · @neko
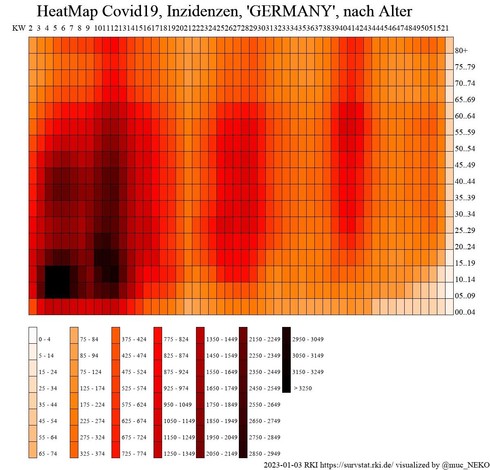
31 followers · 134 posts · Server muenchen.social#GER #GERMANY #HeatMap #COVID19 #Inzidenzen nach Alter
Daten: 03.01.2023 (Datenquelle: / https://survstat.rki.de/ )
Inzidenzen-Top4:
KW01 Meldetag 1/7:
80+: 45.88
55..59: 42.09
50..54: 38.12
30..34: 36.88
KW01:
00..04: 6.19
05..09: 4.40
10..14: 6.22
15..19: 12.33
20..24: 28.13
25..29: 36.65
30..34: 36.88
35..39: 35.22
40..44: 35.42
45..49: 35.81
50..54: 38.12
55..59: 42.09
60..64: 36.00
65..69: 24.26
70..74: 27.65
75..79: 31.88
80+: 45.88
#inzidenzen #COVID19 #heatmap #germany #ger
neko · @neko
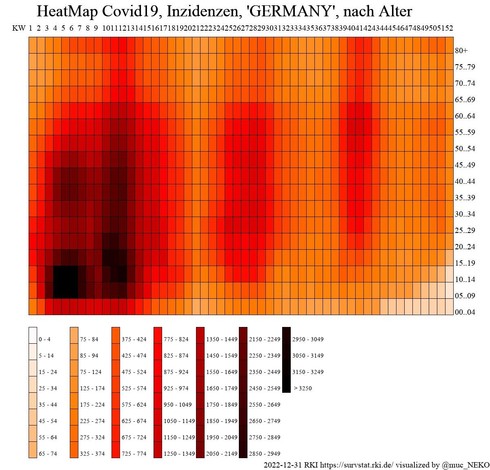
31 followers · 132 posts · Server muenchen.social#GER #GERMANY #HeatMap #COVID19 #Inzidenzen nach Alter
Daten: 31.12.2022 (Datenquelle: / https://survstat.rki.de/ )
Inzidenzen-Top4:
KW52 !! sie starten am Mo bei 0.
Meldetag 5/7:
55..59: 238.21
80+: 218.24
60..64: 204.20
50..54: 210.92
KW52:
00..04: 25.96
05..09: 21.96
10..14: 29.95
15..19: 68.41
20..24: 147.09
25..29: 185.66
30..34: 188.20
35..39: 190.00
40..44: 190.46
45..49: 193.71
50..54: 210.92
55..59: 238.21
60..64: 204.20
65..69: 129.43
70..74: 136.30
75..79: 147.66
80+: 218.24
#inzidenzen #COVID19 #heatmap #germany #ger
neko · @neko
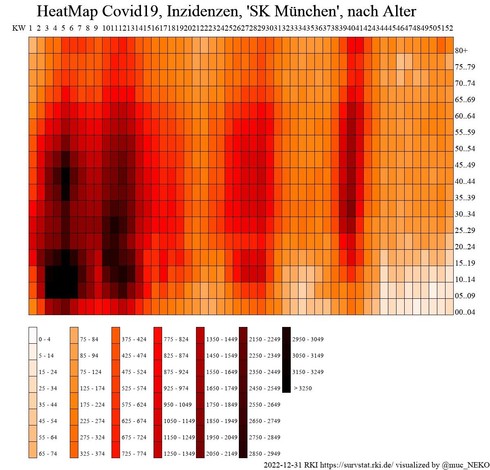
31 followers · 130 posts · Server muenchen.social#MUC #Muenchen #HeatMap #COVID19 #Inzidenzen nach Alter
@CoronaMUC Daten: 31.12.2022 (RKI / https://survstat.rki.de/ )
Inzidenzen-Top4:
KW52 !! sie starten am Mo bei 0
Meldetag 5/7:
80+: 197.25
50..54: 154.28
55..59: 150.59
45..49: 144.02
KW52:
00..04: 34.29
05..09: 17.73
10..14: 20.05
15..19: 38.31
20..24: 63.81
25..29: 90.89
30..34: 121.21
35..39: 112.21
40..44: 141.11
45..49: 144.02
50..54: 154.28
55..59: 150.59
60..64: 139.12
65..69: 116.29
70..74: 129.25
75..79: 83.32
80+: 197.25
#inzidenzen #COVID19 #heatmap #muenchen #muc
neko · @neko
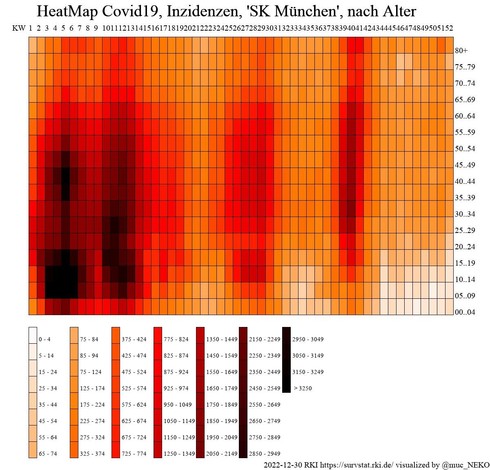
31 followers · 129 posts · Server muenchen.social#MUC #Muenchen #HeatMap #COVID19 #Inzidenzen nach Alter
@CoronaMUC Daten: 30.12.2022 (RKI / https://survstat.rki.de/ )
Inzidenzen-Top4:
KW52 !! sie starten am Mo bei 0.
Meldetag 4/7:
80+: 160.34
50..54: 131.96
40..44: 127.58
55..59: 124.31
KW52:
00..04: 31.75
05..09: 16.26
10..14: 16.70
15..19: 34.97
20..24: 53.18
25..29: 80.37
30..34: 106.41
35..39: 100.31
40..44: 127.58
45..49: 122.68
50..54: 131.96
55..59: 124.31
60..64: 115.72
65..69: 109.74
70..74: 108.57
75..79: 68.17
80+: 160.34
#inzidenzen #COVID19 #heatmap #muenchen #muc


