Steven P. Sanderson II, MPH · @stevensanderson
162 followers · 761 posts · Server mstdn.socialLisPi · @lispi314
541 followers · 11584 posts · Server mastodon.top@egypt #Medians are basically useless anyway.
Most common statistical measurements (#mode) are a lot more useful.
Even better is a dynamic graph with adjustable granularity to put said values on a #histogram for more immediate visual feedback.
#medians #mode #histogram #statistics #median
Datylon · @datylon
27 followers · 61 posts · Server vis.socialIf it looks like a bar chart and acts like a bar chart, then it probably is a histogram! 📊
Visually, histograms might resemble bar graphs. But there are some features that distinguish the two. On our new resource page, we go into details on:
- What is a histogram and its variations (and alternatives),
- How to properly design a histogram,
- We show some examples of histograms designed with Datylon.
Learn more: https://datylon.co/histogram
#histogram #designthinking #dataviz #datavisualization
#! code · @hashbangcode
16 followers · 11 posts · Server fosstodon.orgNew! Generating Histogram Colour Analysis Graphs From Images In PHP
https://www.hashbangcode.com/article/generating-histogram-colour-analysis-graphs-images-php
#php #histogram #colours #hashbangcode
#php #histogram #colours #hashbangcode
The Triangle Agency · @triangleagency
1 followers · 126 posts · Server mastodon.social
Matplotlib plots – Bar | Box | Pie | Histogram | Scatter https://triangleagency.co.uk/matplotlib-plots-bar-box-pie-histogram-scatter/?utm_source=dlvr.it&utm_medium=mastodon #TheTriangleAgencyNews #Bar #Box #Histogram
#thetriangleagencynews #bar #box #histogram
Karthikeyan A K :verified: · @mindaslab
55 followers · 447 posts · Server mstdn.socialVolkan Özçelik · @volkan
35 followers · 1223 posts · Server z2h.devYouPlot is a command line tool to draw graphs on the terminal
https://github.com/red-data-tools/YouPlot
#tools #DevEx #plotting #graph #histogram #libraries #CommandLine #cli #console #YouPlot #plot
#tools #devex #plotting #graph #histogram #libraries #CommandLine #cli #console #youplot #plot
Volkan Özçelik 🦄 · @volkan
630 followers · 1368 posts · Server hachyderm.ioYouPlot is a command line tool to draw graphs on the terminal
https://github.com/red-data-tools/YouPlot
#tools #DevEx #plotting #graph #histogram #libraries #CommandLine #cli #console
#tools #devex #plotting #graph #histogram #libraries #commandline #cli #console
Steven P. Sanderson II, MPH · @stevensanderson
36 followers · 202 posts · Server mstdn.socialI have written a post that will showcase the hai_histogram_facet_plot() function from my #r #package {healthyR.ai}, which makes it easy to create faceted histograms of numeric and factor data in R.
Some key things about the function:
🚀 You can export the graph as a #plotly plot for #interactivity
🚀 Handles factor data
🚀 You can [0, 1] scale data if you choose
🚀 Reverse factor order
Post: https://www.spsanderson.com/steveondata/posts/rtip-2022-12-08/
#RStats #R #Programming #statistic #visualization #data #histogram
#histogram #Data #visualization #statistic #Programming #RStats #interactivity #plotly #package #r
Tiago Ribeiro · @tiago_ribeiro
35 followers · 141 posts · Server mastodon.socialOutra que só descobri agora...
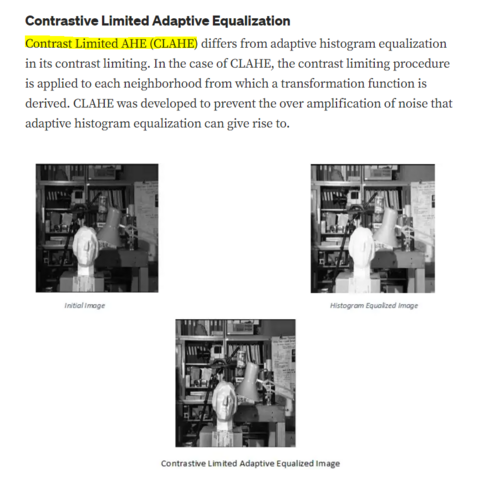
"CLAHE - Histogram Equalization"
https://www.geeksforgeeks.org/clahe-histogram-eqalization-opencv/
#CLAHE #Histogram #Equalization #PreProcessing
https://towardsdatascience.com/histogram-equalization-5d1013626e64
#clahe #histogram #equalization #preprocessing
claude · @mathr
287 followers · 2739 posts · Server post.lurk.orgI updated my #exrtact project (miscellaneous tools for #EXR image files) with a new program exrquantile that outputs data similar in purpose to a #histogram (it sorts the data from a given channel and outputs the values at regularly spaced counts, so you can easily read off the minimum, maximum, median, and other #quantile).
#quantile #histogram #exr #exrtact
claude · @mathr
288 followers · 2739 posts · Server post.lurk.orgWorking on my #bot to explore escape-time fractals, rendered with distance estimator colouring using my #et project. It's a #bash script that calls out to #ghc #haskell for calculator functionality, plus image fitness function in custom #C code (using #openmp for #parallel processing).
Flatness of #directionality #histogram seems to be a good #metric to add into the #fitness function for exploring #fractals algorithmically, because stretched/skewed images will have strong directionality peaks, while more #isotropic regions will be flatter.
I implemented it using 5x5 #Sobel filters as suggested on the #ImageJ website. Nothing fancy (like Earth Mover's Distance, which I haven't figured out for circular arrays yet) for the histogram comparison, just Euclidean vector distance.
ref: https://imagej.net/Directionality#Local_gradient_orientation
#bot #et #bash #ghc #haskell #c #openmp #parallel #directionality #histogram #metric #fitness #fractals #isotropic #sobel #imagej


