
Anita Graser 🇪🇺🇺🇦 · @underdarkGIS
2601 followers · 2067 posts · Server fosstodon.org
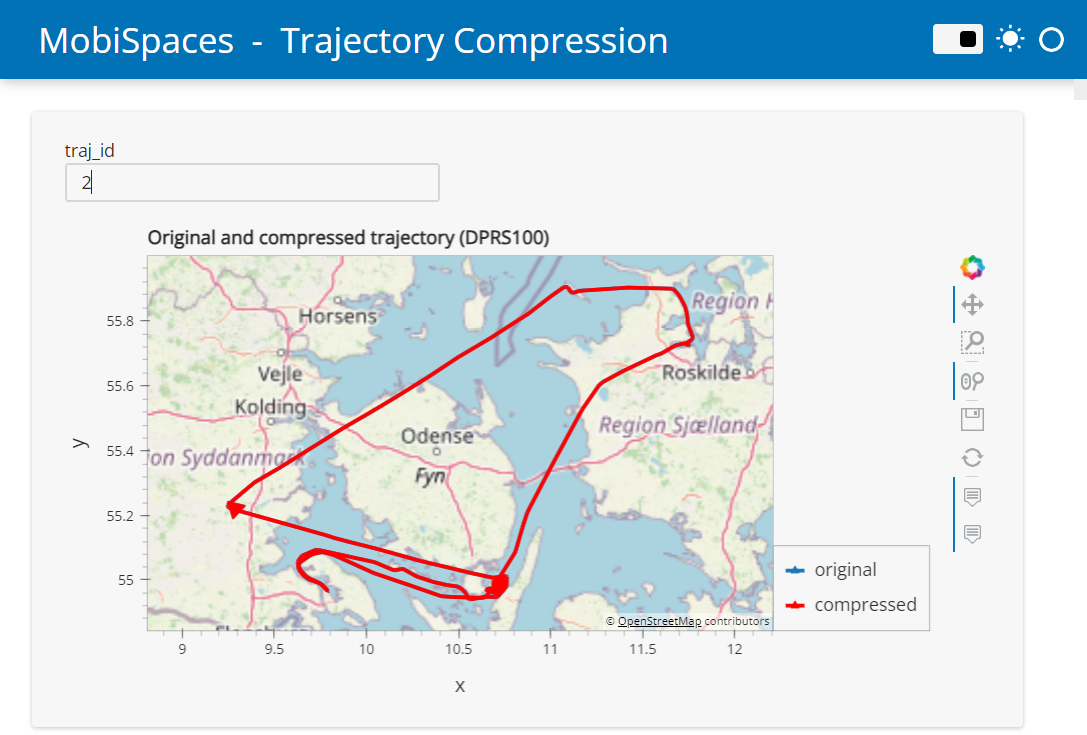
I'm so happy that we're finally in a place where we can whip up a quick trajectory data exploration app with maps and graphs from rather arbitrary inputs, be it plain old csv with x/y in any crs known to proj, or fancy gis formats in just a few minutes.
It's minimal extra effort and seems to impress most people so much more than comparable plots in a notebook 🤷♀️😀
#MovingPandas #panel #hvplot #holoviz #holoviews #geoviews #geopandas
#movingpandas #panel #hvplot #holoviz #holoviews #geoviews #Geopandas
Anita Graser 🇪🇺🇺🇦 · @underdarkGIS
2494 followers · 1908 posts · Server fosstodon.org
TIL more about #holoviews / #colorcet / #bokeh / #matplotlib color map handling than I ever wanted to know 🤨
Hopefully, the improved #movingpandas plots will be ready soon
#holoviews #colorcet #bokeh #matplotlib #movingpandas #dataviz #mobilitydatascience #movementdataanalytics
Anita Graser 🇪🇺🇺🇦 · @underdarkGIS
2474 followers · 1890 posts · Server fosstodon.org
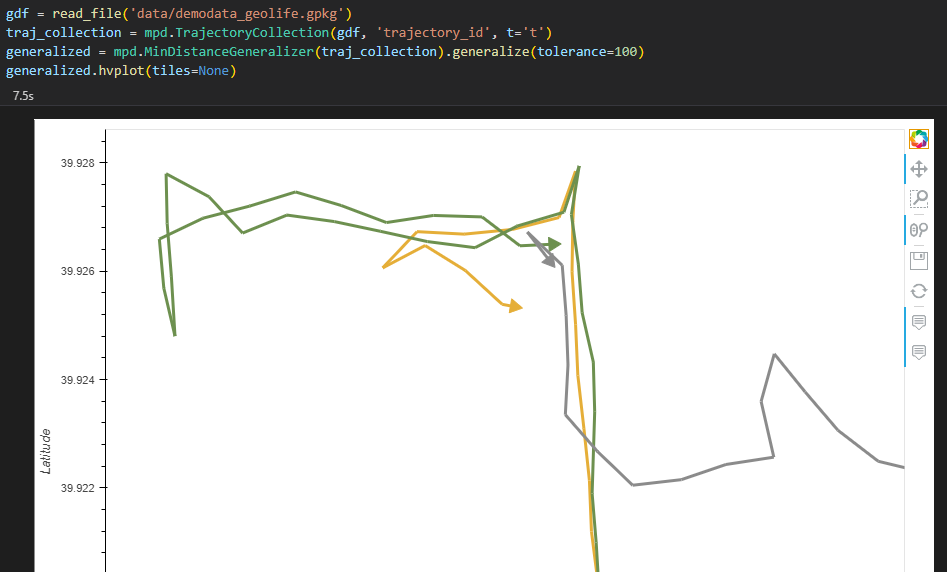
Working out the last kinks in the improved @movingpandas plots: now with proper arrow heads visualizing #movement direction
#mobility #SpatialDataScience #mobilitydatascience #sportsanalytics #movingpandas #geoviews #holoviz #holoviews #bokeh
#movement #mobility #SpatialDataScience #mobilitydatascience #sportsanalytics #movingpandas #geoviews #holoviz #holoviews #bokeh
Anita Graser 🇪🇺🇺🇦 · @underdarkGIS
2369 followers · 1719 posts · Server fosstodon.orgPublic service announcement: pin your #hvplot version to 0.8.3 for now, particularly if you use #geoviews like @movingpandas does
#hvplot #geoviews #holoviz #holoviews #Geopandas
Anita Graser 🇪🇺🇺🇦 · @underdarkGIS
2367 followers · 1717 posts · Server fosstodon.org
Did you know that @movingpandas supports plotting using custom #projections?
This #HiddenGem feature of #GeoViews is really neat and it's now featured on the update #MovingPandas homepage
#MobilityAnalytics #MovementDataAnalysis #DataScience #DataViz #Holoviews #hvplot
#projections #hiddengem #geoviews #movingpandas #mobilityanalytics #movementdataanalysis #datascience #dataviz #holoviews #hvplot
Anita Graser 🇪🇺🇺🇦 · @underdarkGIS
2367 followers · 1717 posts · Server fosstodon.orgToday, I had the pleasure to present @movingpandas at the #Maritime #Informatics & #Robotics - #Maritime2023 #SummerSchool
https://summer-schools.aegean.gr/Maritime2023
Too bad I couldn't make it there in person, but I do hope that the participants got a good impression of the #Python for #MovementDataAnalytics ecosystem:
#MovingPandas #geopandas #geoviews #hvplot #holoviews
#maritime #informatics #robotics #maritime2023 #python #movementdataanalytics #movingpandas #Geopandas #geoviews #hvplot #holoviews #summerschool
Anita Graser 🇪🇺🇺🇦 · @underdarkGIS
2144 followers · 1051 posts · Server fosstodon.org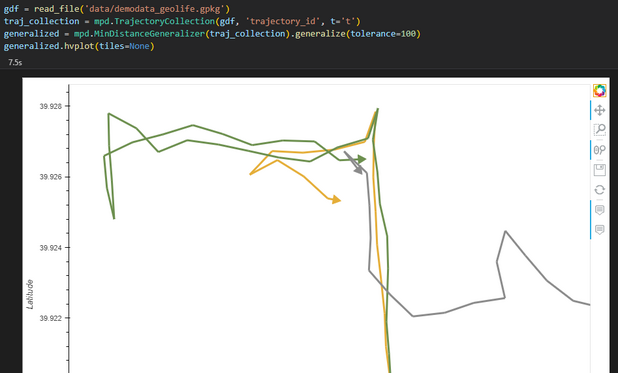
If all goes as planned, the next version of @movingpandas will ship with improved #Trajectory plotting capabilities, including, finally: #arrow markers that show the direction of the movement
https://github.com/movingpandas/movingpandas/commit/fb1174b51f0ef31ce95ffc1403b78c7eff3642b7
#MovementDataAnalytics #MovementData #MobilityAnalytics #VisualAnalytics #Bokeh #GeoViews #Holoviews #GISChat
#trajectory #arrow #movementdataanalytics #MovementData #mobilityanalytics #visualanalytics #bokeh #geoviews #holoviews #gischat

Daniel C 👁️🐝Ⓜ️ · @blue
39 followers · 161 posts · Server mastodon.deepthunder.co.ukWe've moved on from this because frankly I got bored.
I did finally manage to write a function to create an multi-y axis graph which is *unbelievably* fucking difficult for some reason. Never mind me trying to learn which API I need to use plotly in.. (#pandas, #holoviews, #matplotlib.. #panel) in the end a pandas back end change and a function did it!
But I got rudely distracted by my QNAP deciding to corrupt all my #docker containers. Which was pretty shit of it to do..
#pandas #holoviews #matplotlib #panel #docker
Anita Graser 🇪🇺🇺🇦 · @underdarkGIS
2091 followers · 850 posts · Server fosstodon.org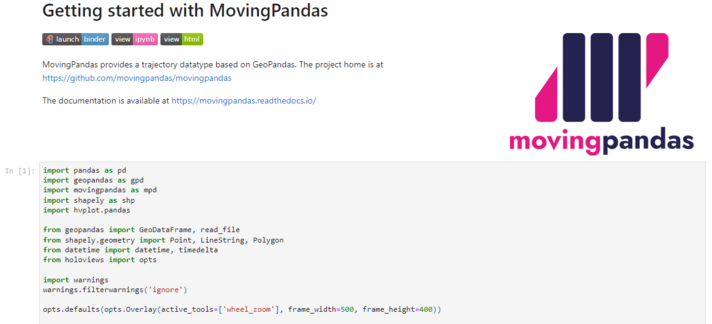
While working with #GeoViews, I noticed that the map zoom tool is not active by default.
I think this may be one of the main reasons why users find GeoViews less intuitive than #leaflet
We can set the zoom tool active using:
from holoviews import opts
opts.defaults(opts.Overlay(active_tools=['wheel_zoom'])
Full code and examples:
https://movingpandas.github.io/movingpandas-website/1-tutorials/1-getting-started.html
#geoviews #leaflet #gischat #movingpandas #bokeh #holoviews #Geopandas #python

Michael Aye · @michaelaye
128 followers · 500 posts · Server mastodon.onlineThis means that Jupyterlab remains the only viable option for developing anything that uses #bokeh plots like #holoviews with the Bokeh backend.

Dr.Kidpixo 🔢☄🔨💻 ⌨️ 🐍🐧 · @kidpixo
56 followers · 458 posts · Server mastodon.uno@ruthpozuelo @lavergnetho @EL_Uatu I would use https://geoviews.org/gallery/matplotlib/filled_contours.html
In general, I use https://datashader.org/ and https://holoviews.org/user_guide/Large_Data.html a lot those days and it can create interactive bokeh or static matplotlib with the same code.
#datashader can resample huge dataset on the fly
#datashader #geoviews #holoviews are magic, really loving it.
#datashader #geoviews #holoviews

John :idle: · @jboy
489 followers · 1450 posts · Server post.lurk.orgExperimenting with some alternative ways of visualizing textnets: https://nbviewer.jupyter.org/github/jboynyc/textnets-binder/blob/trunk/textnets_holoviews.ipynb
I'm quite impressed by #holoviews, and I particularly like the Sankey graph (at the bottom).
I really need to find some better example data to work with.