
Thomas Sandmann · @thomas_sandmann
241 followers · 132 posts · Server genomic.social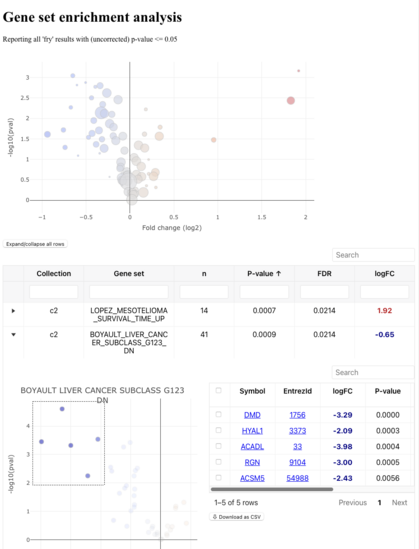
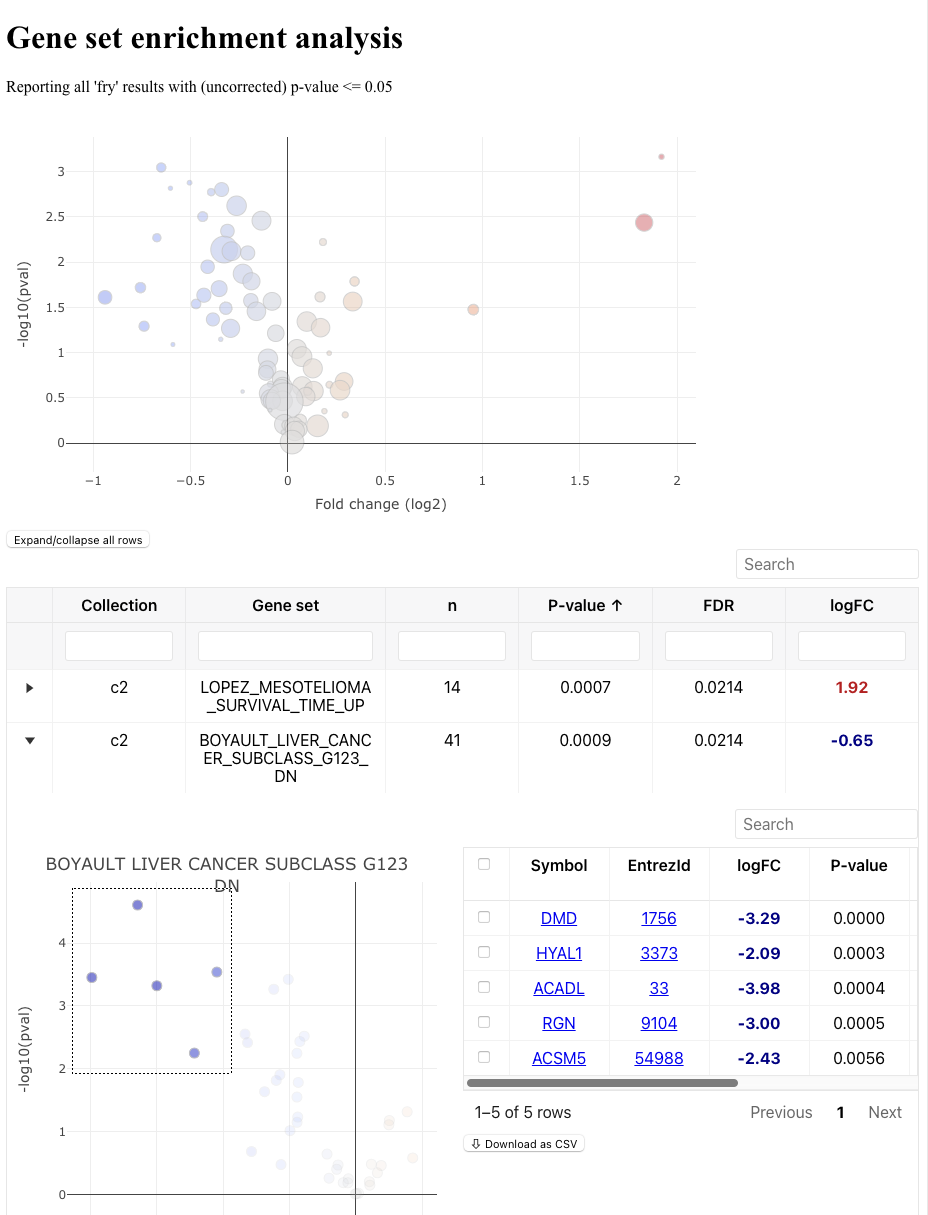
Today I learned how to create an interactive HTML report for gene-set enrichment analysis in R. It allows readers to examine set-level results & drill down into the underlying gene-level statistics interactively.
https://tomsing1.github.io/blog/posts/interactive-gene-set-results/
It's a static HTML page, e.g. no server (#shiny, #dash, etc) needed. Thanks a lot to the authors of the #plotly #reactable #crosstalk and #htmlwidget tools for making this so easy #til #rstats #bioconductor #gsea #compbio #visualization @lianos
#shiny #dash #plotly #reactable #crosstalk #htmlwidget #til #RStats #Bioconductor #gsea #compBio #visualization