
Jonatan Hildén · @jhilden
378 followers · 1841 posts · Server vis.socialMarie Neurath was born yesterday in 1898. Reading her book ”The transformer” was an, ahem, transformative experience for me as an information designer.
#infodesign
https://hyphenpress.co.uk/products/books/978-0-907259-40-4/
Jonatan Hildén · @jhilden
378 followers · 1841 posts · Server vis.socialMarie Neurath was born on this day in 1898. Reading her book ”The Transformer” was an, ahem, transformative experience for me as an information designer.
#infodesign
https://hyphenpress.co.uk/products/books/978-0-907259-40-4/
Xisca (she/her) · @xisca
35 followers · 817 posts · Server mastodon.au
Cool exercise in data visualisation that had me (dare I say) excited about thinking about tax for the 5min or so it took me to read it. Which is a lot longer than I'm normally excited about tax.
https://www.abc.net.au/news/2023-04-28/stage-three-tax-cuts-to-scale/102268304
#tax #dataviz #datavisualisation #design #infodesign #auspol
#tax #dataviz #datavisualisation #design #infodesign #auspol

Marian Dörk · @nrchtct
1197 followers · 1829 posts · Server vis.socialThe next iteration of the Information+ conference will be held in Edinburgh this November and the @InfoPlusConf organizers have just refreshed the website featuring a revolving logo accompanied by swarming particles and calls for presentations, workshops, and exhibits:
#infodesign #datavis #infoplus2023

Jen Christiansen · @ChristiansenJen
733 followers · 103 posts · Server vis.socialIt was a treat to chat with Jonathan Schwabish for PolicyViz podcast. We talked about everything from what makes science graphics weird, to designing academic posters—and even books—with the mindset that those objects are simply very large graphics.
#scicomm #dataviz #infodesign #informationdesign https://policyviz.com/podcast/episode-235-jen-christiansen/
#informationdesign #infodesign #dataviz #scicomm
Jen Christiansen · @ChristiansenJen
735 followers · 102 posts · Server vis.socialEarlier this month, I had the pleasure of chatting about science graphics with @Allitorban for her podcast Data Viz Today. Check out episode 85, in which we discuss using welcoming gestures, collaborating with others, the power of arrows, and more. #scicomm #dataviz #infodesign #informationdesign https://dataviztoday.com/shownotes/85
#informationdesign #infodesign #dataviz #scicomm
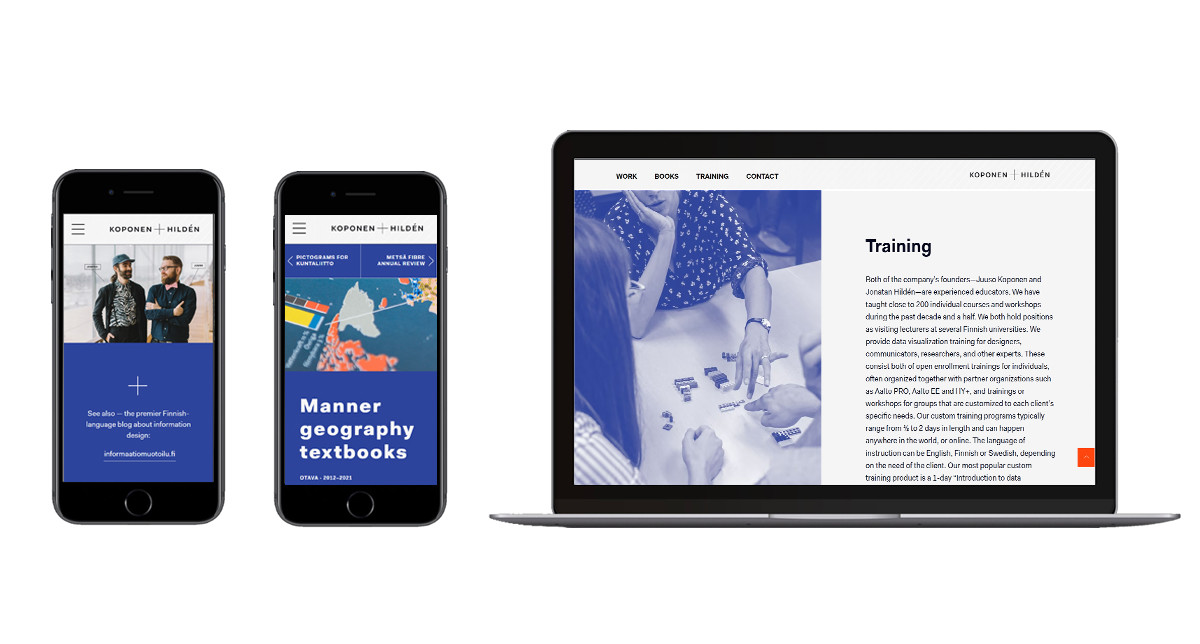
Koponen+Hildén · @koponenhilden
26 followers · 3 posts · Server mstdn.social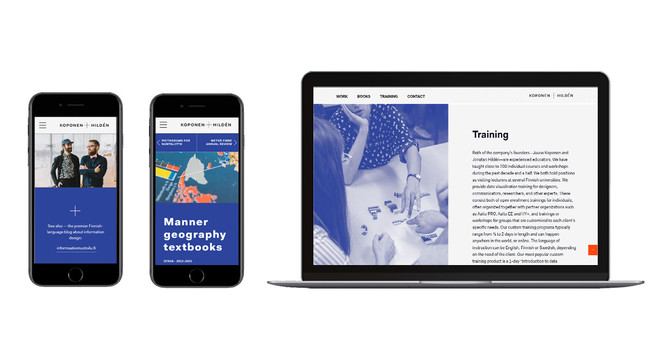
We updated our website with some new projects. Do you have data that needs visualizing or workshops that need workshopping?
Hit us up!
https://koponen-hilden.fi/
#visualization #dataviz #portfolio #designAgency #infodesign
#infodesign #designagency #portfolio #dataviz #visualization
Jen Christiansen · @ChristiansenJen
721 followers · 87 posts · Server vis.socialI’m excited to see that dates have been announced for the Information+ conference. (Nov 22-24, in Edinburgh.) #infodesign #dataviz https://informationplusconference.com/2023/

Marco Cortella :verified: · @Mcx83
87 followers · 152 posts · Server mastodon.uno📅Dal 22 al 24 Novembre, Edimburgo, Information+ Conference 2023. Evento sull'information design e la #dataVisualization.
Iscrizioni aperte da Luglio 2023.
#dataViz #informationDesign
---
RT @InfoPlusConf
we are thrilled to announce that the Info+ Conf 2023 is coming to Edinburgh in November!
#infoplus2023 is an interdisciplinary conference on #datavis and #infodesign 🎨📊
stay tuned as we release more information: https://informatio…
https://twitter.com/InfoPlusConf/status/1629070646801055744
#datavisualization #dataviz #informationdesign #infoplus2023 #datavis #infodesign
Jen Christiansen · @ChristiansenJen
706 followers · 72 posts · Server vis.socialI wrote a tip sheet for The Open Notebook on designing science graphics:
https://www.theopennotebook.com/2023/02/07/tip-sheet-designing-science-graphics/ (I’m a huge fan of @Open_Notebook , so this was exciting. If you’re interested in the craft of science journalism, I recommend checking out the site!) #infodesign #scicomm #journalism
#journalism #scicomm #infodesign
DatavizAdventure · @Datavizadventure
26 followers · 17 posts · Server vis.socialThe growth of shadow banking: discovering a hidden world.
Here's an update on my latest #datavisualization. This is the way I originally wanted to display the information. A possible version for #Tableau in the next few days 😁 .
https://www.behance.net/gallery/162566341/The-Growing-of-Shadow-Banking
.
.
.
.
.
.
.
.
.
.
#Datavisualization #Dataanalytics #Dataviz #Informationdesign #Design #Infographic #Infographics #InfoDesign #Management
#management #infodesign #infographics #infographic #design #informationdesign #dataviz #dataanalytics #tableau #datavisualization

Jos Schuurmans (EN) · @josschuurmans
56 followers · 286 posts · Server masthead.socialIs “stream” as a design paradigm over? – On my Om
https://om.co/2023/01/25/is-stream-as-a-design-paradigm-over/
#streaming #RiverOfNews #RiverThinking #InfoArchitecture #IA #InfoDesign #blogging #curation #KM #HCI
#hci #km #curation #blogging #infodesign #ia #infoarchitecture #riverthinking #riverofnews #streaming

Chris Moorehead · @cjmoorehead
6 followers · 8 posts · Server techhub.socialAn #introduction, or reconnection for those who used to follow me at that Bird thing: I’m a professional engineer and designer with a keen interest in #DesignLeadership, #DesignOps, #UX, #InfoDesign, #DataViz, and #Typography. I currently work as the Head of UX at a major financial software company, where I lead the UX research, product design, design operations, technical writing, and localization teams. Before moving to the tech sector, I worked in management consulting, and, prior to that, I was a mechanical and industrial engineer working in aerospace and defence. When I’m not at my day job, I teach design at OCAD, where I’ve been a faculty member for over a decade. I’ve lived in Toronto for most of my adult life but given that my employer is now permanently remote I recently moved to the small town of Stratford, where my partner @kteahen and I have a house which is about to undergo a major renovation. 🤞
#introduction #designleadership #designops #ux #infodesign #dataviz #typography
Jen Christiansen · @ChristiansenJen
492 followers · 36 posts · Server vis.social
My colleague Amanda Montañez curated this neat highlights collection of 2022 Scientific American graphics. #SciComm #InfoDesign #DataViz https://www.scientificamerican.com/article/the-most-compelling-science-graphics-of-2022/
Marian Dörk · @nrchtct
972 followers · 1627 posts · Server vis.social@ChristiansenJen wow! this is not just a really useful list of resources for anyone in #DataVis #InfoDesign #SciComm, but also a wonderful testimonial for your book. looking forward to hold in my hands.
DatavizAdventure · @Datavizadventure
22 followers · 11 posts · Server vis.social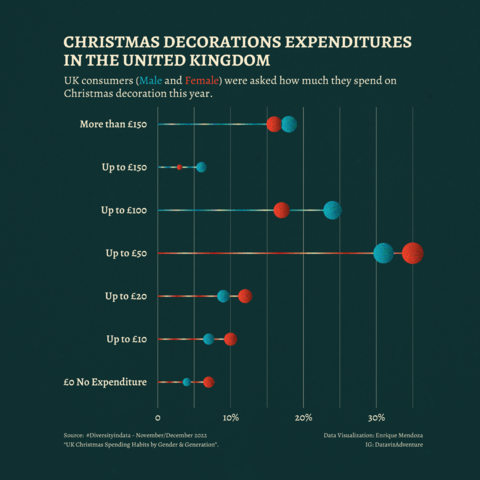
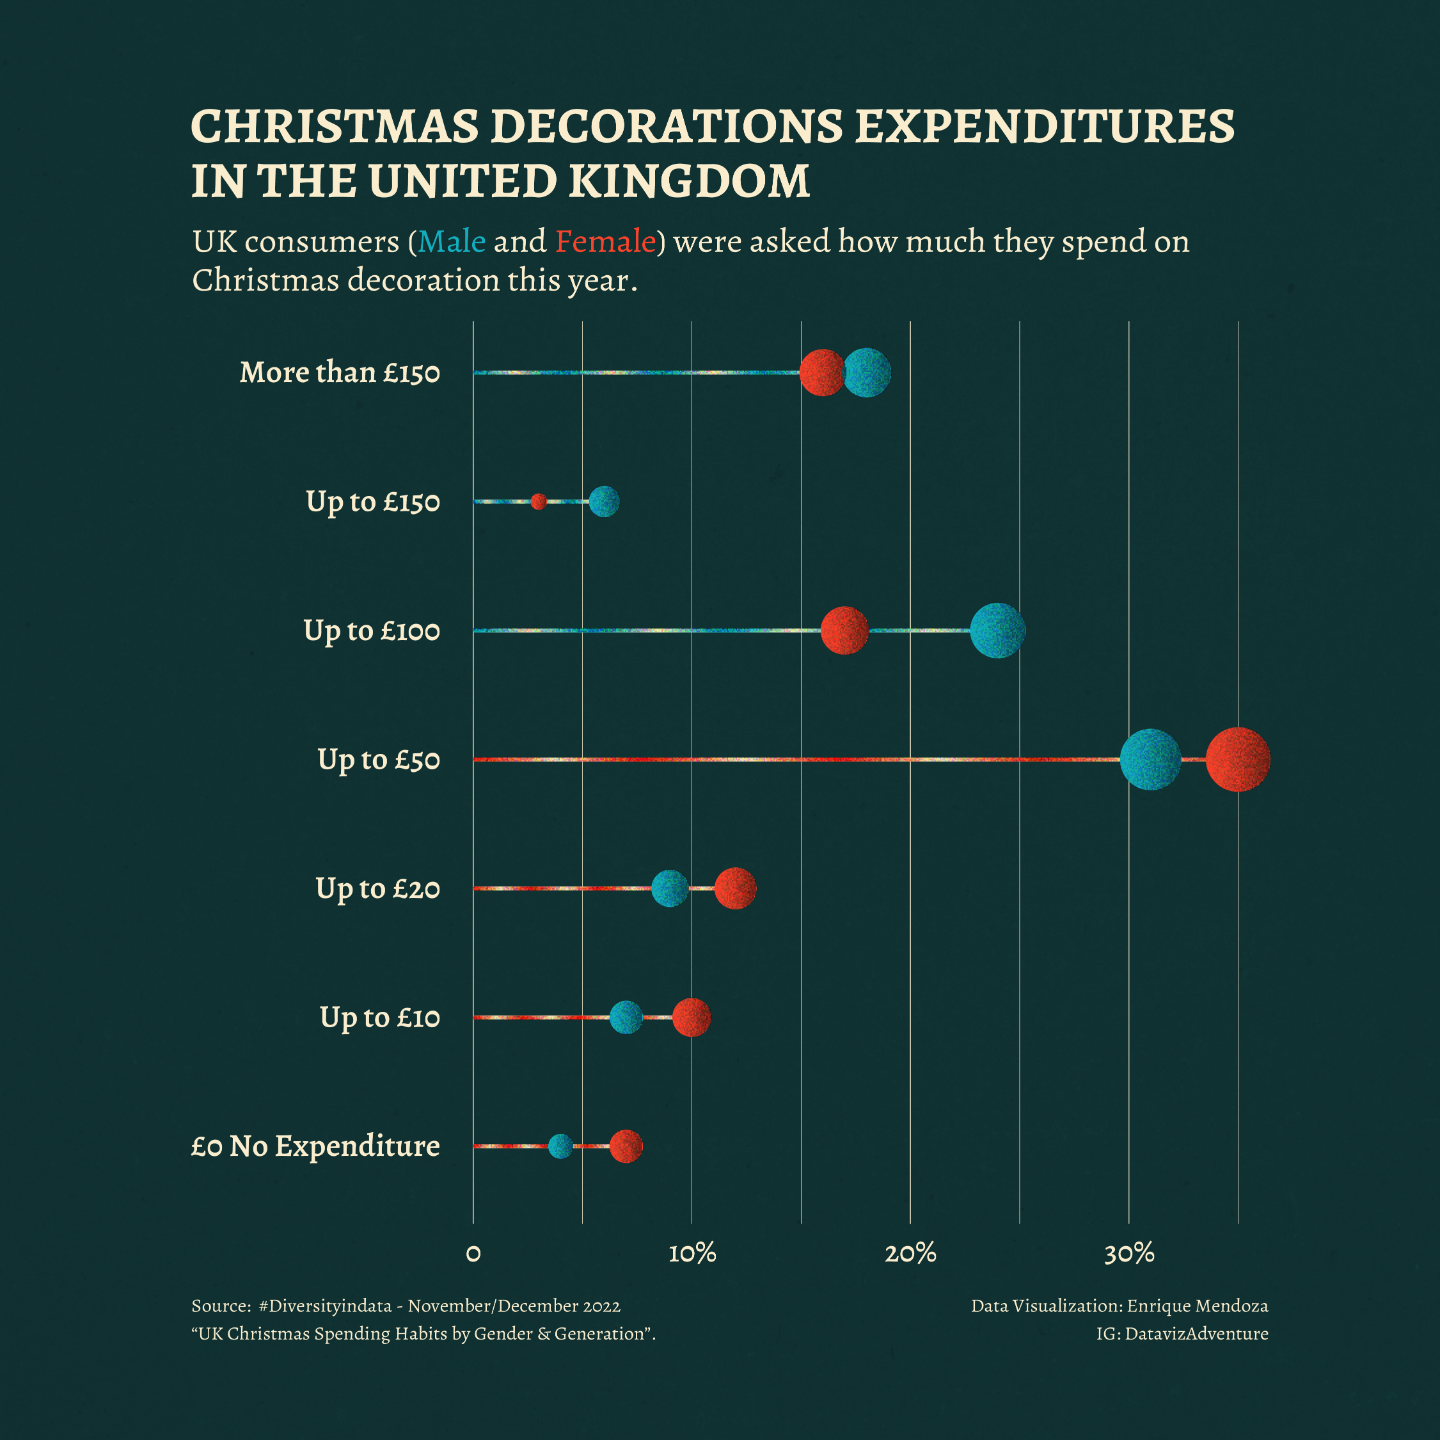
Hi #datafam
Here my #dataviz for the #DiversityInData initiative. This month, the datasets focus on UK Christmas Spending Habits by Gender & Generation.
Source:
- Diversity in Data (Nov/Dec 2022) | statista.com
- "Christmas shopping statistics Analysis" conducted by finder.com
.
.
.
.
.
.
#DataViz #DataVisualization #DataVizSociety #DataIsBeautiful #DataVizAdventure #Design #Designer #InfoDesign #DataArt #VisulArt #Winteriscoming #Christmas #Christmas2022 #UK #christmasdecorations
#christmasdecorations #uk #christmas2022 #christmas #winteriscoming #visulart #dataart #infodesign #designer #design #datavizadventure #dataisbeautiful #datavizsociety #datavisualization #diversityindata #dataviz #datafam

· @morsel
5 followers · 5 posts · Server mastodon.socialDespite being an #introvert it seems to be reasonably polite to have an introduction.
Professionally I earn my money with #ITServiceManagement #enterprisearchitecture #infodesign #publiccloud #datacenter
Apart from that i like to play #mmo and #simracing games. I enjoy #wrestling, #nfl and #motogp.
While not in front of a screen i do like to be bad at #nineball from time to time.
Looking forward to being awkward and silent around here after migrating from birdsite.
#introvert #ITServiceManagement #enterprisearchitecture #infodesign #publiccloud #datacenter #mmo #simracing #wrestling #nfl #motogp #nineball

Tony 📊 · @tonyvisualizes
173 followers · 398 posts · Server vis.social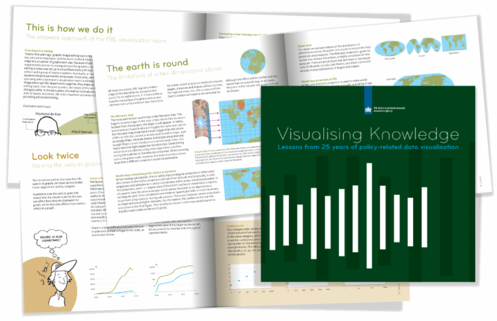
Hi fellow #dataviz and #infodesign Donnies!
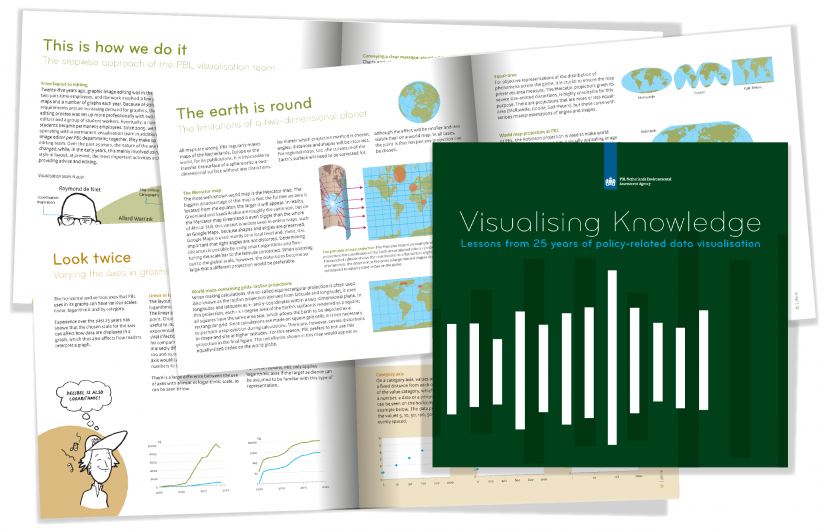
Last summer, I visited the Infographics Conference. One of the speakers was PBL NL Environmental Assessment Agency.
Their great visualisation team published a 25yr-anniversary booklet with their examples, work methods and lessons learned.
'Visualising Knowledge. Lessons from 25 years of policy-related data visualisation'
You can download the English PDF for free via
https://www.pbl.nl/en/publications/visualising-knowledge
NL versie ook beschikbaar
https://www.pbl.nl/publicaties/kennis-verbeeld

Sol Kawage · @uauage
155 followers · 139 posts · Server vis.social#infodesign Do you think that on a map or diagram, the Legend needs to be labelled? Do we need to tell the reader: THIS IS THE LEGEND ?
or is it obvious, what it is?

Yuri Engelhardt · @yuri
279 followers · 308 posts · Server vis.social
RT @IIID_infodesign@twitter.com
The Information Design Summer School has a reputation as the best place to get a fast introduction to the concepts, principles and challenges of information design. It's back online for 2022, on Tuesdays and Thursdays at 14:00GMT. Sign up now: http://lnkd.in/e4JhwZ4 #infodesign
🐦🔗: https://twitter.com/IIID_infodesign/status/1512087940326846475